Equities
| MINTs | |
|---|---|
| JCI(IDN) | +1.51% |
| INMEX(MEX) | +5.97% |
| NGSEINDX(NGA) | +2.95% |
| XU030(TUR) | +9.00% |
| BRICS | |
|---|---|
| IBOV(BRA) | +16.69% |
| SHCOMP(CHN) | +11.96% |
| NIFTY(IND) | +10.39% |
| INDEXCF(RUS) | +0.37% |
| TOP40(ZAF) | +4.08% |
Commodities
| Energy | |
|---|---|
| Brent Crude Oil | +10.30% |
| Ethanol | +4.44% |
| Heating Oil | +8.39% |
| RBOB Gasoline | +38.22% |
| Natural Gas | +13.84% |
| WTI Crude Oil | +11.73% |
| Metals | |
|---|---|
| Palladium | +15.93% |
| Copper | +2.35% |
| Gold 100oz | -0.06% |
| Silver 5000oz | +4.73% |
| Platinum | +5.15% |
Currencies
| MINTs | |
|---|---|
| USDIDR(IDN) | -1.56% |
| USDMXN(MEX) | -4.16% |
| USDNGN(NGA) | +0.00% |
| USDTRY(TUR) | -4.86% |
| BRICS | |
|---|---|
| USDBRL(BRA) | -9.97% |
| USDCNY(CHN) | -1.35% |
| USDINR(IND) | -3.18% |
| USDRUB(RUS) | -9.94% |
| USDZAR(ZAF) | -7.24% |
| Agricultural | |
|---|---|
| Cocoa | -2.75% |
| Feeder Cattle | -0.55% |
| White Sugar | +8.29% |
| Cattle | -4.71% |
| Coffee (Robusta) | +9.77% |
| Corn | -1.27% |
| Lumber | +21.75% |
| Orange Juice | +17.57% |
| Sugar #11 | +4.72% |
| Coffee (Arabica) | +11.78% |
| Cotton | +2.76% |
| Soybeans | +7.00% |
| Lean Hogs | -2.05% |
| Soybean Meal | +4.55% |
| Wheat | +5.96% |
Credit Indices
| Index | Change |
|---|---|
| Markit CDX EM | +2.89% |
| Markit CDX NA HY | +3.28% |
| Markit CDX NA IG | -27.66% |
| Markit iTraxx Asia ex-Japan IG | -6.67% |
| Markit iTraxx Australia | -15.03% |
| Markit iTraxx Europe | -26.80% |
| Markit iTraxx Europe Crossover | -98.68% |
| Markit iTraxx Japan | -9.45% |
| Markit MCDX (Municipal CDS) | -14.58% |
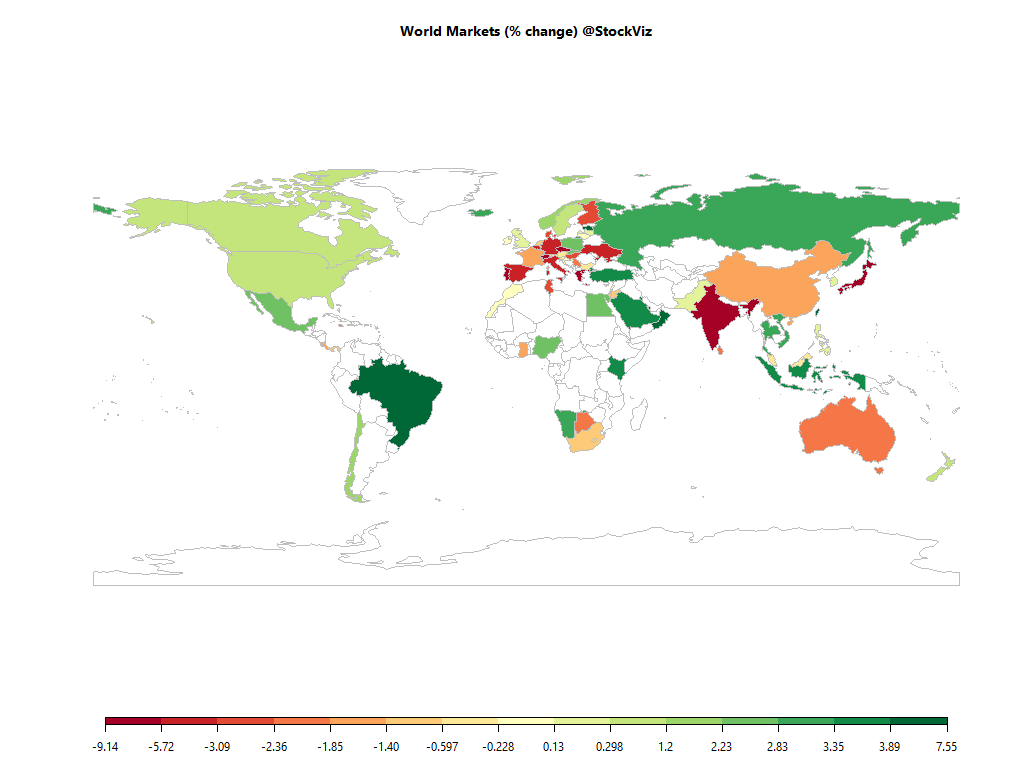
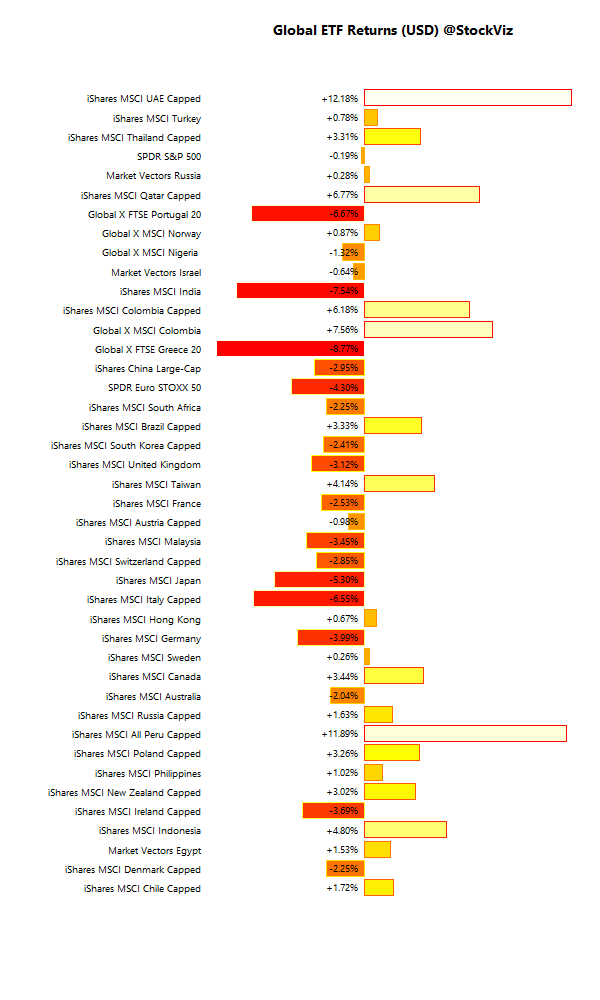
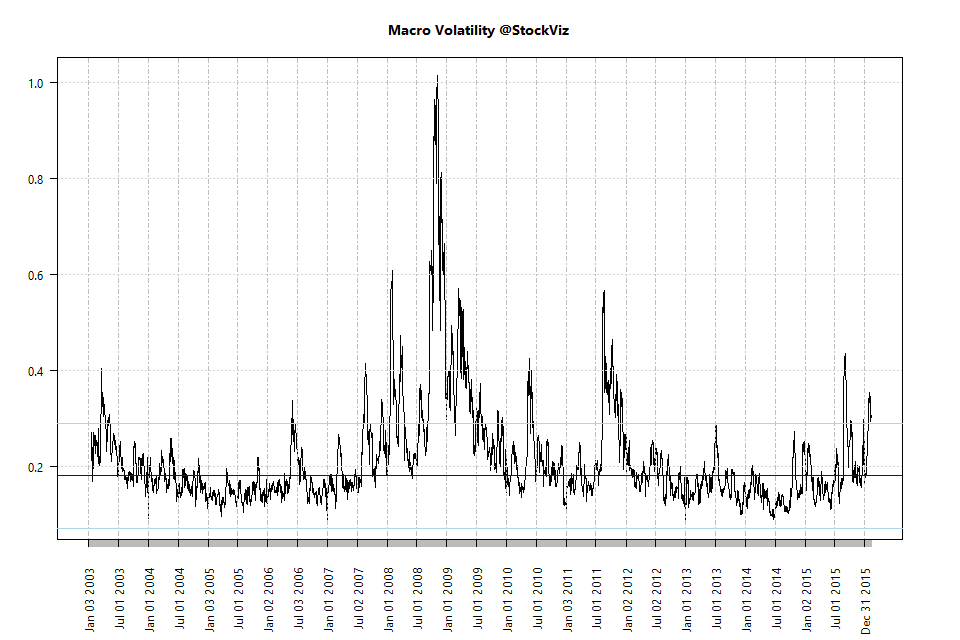
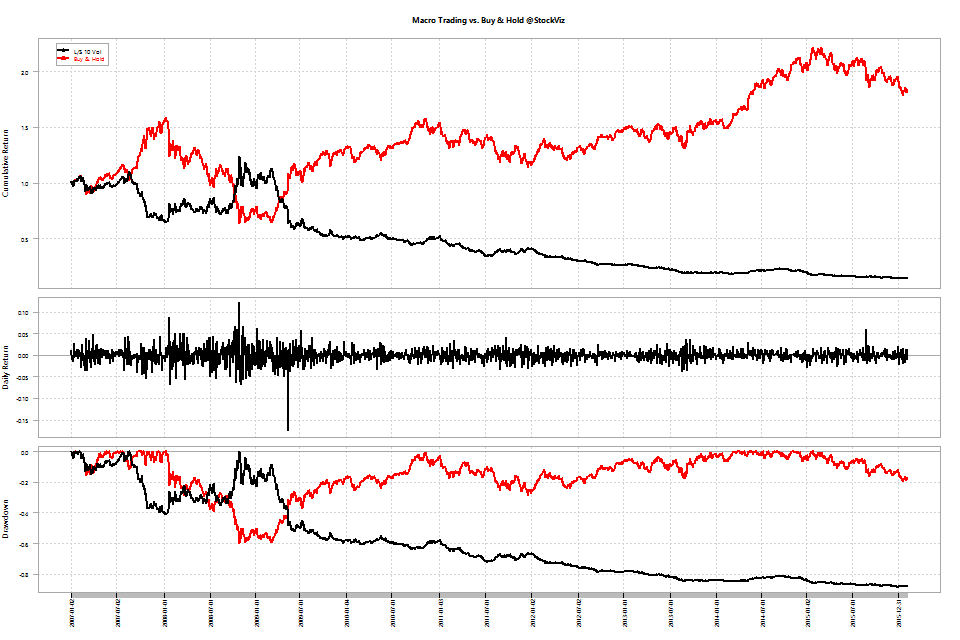
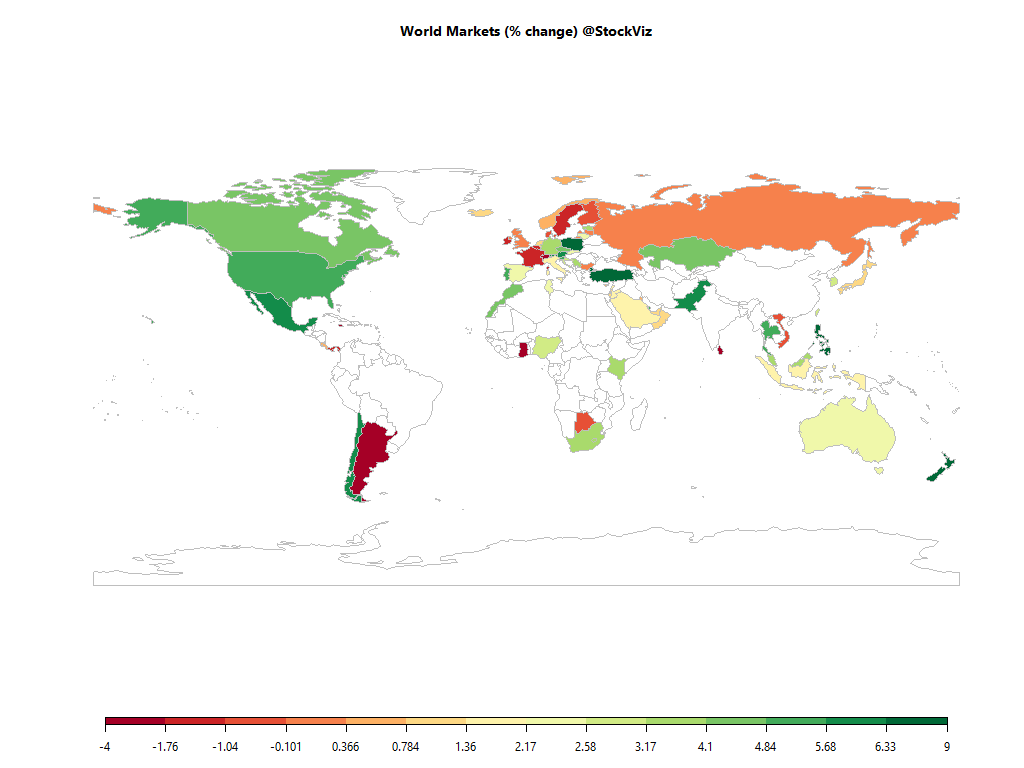
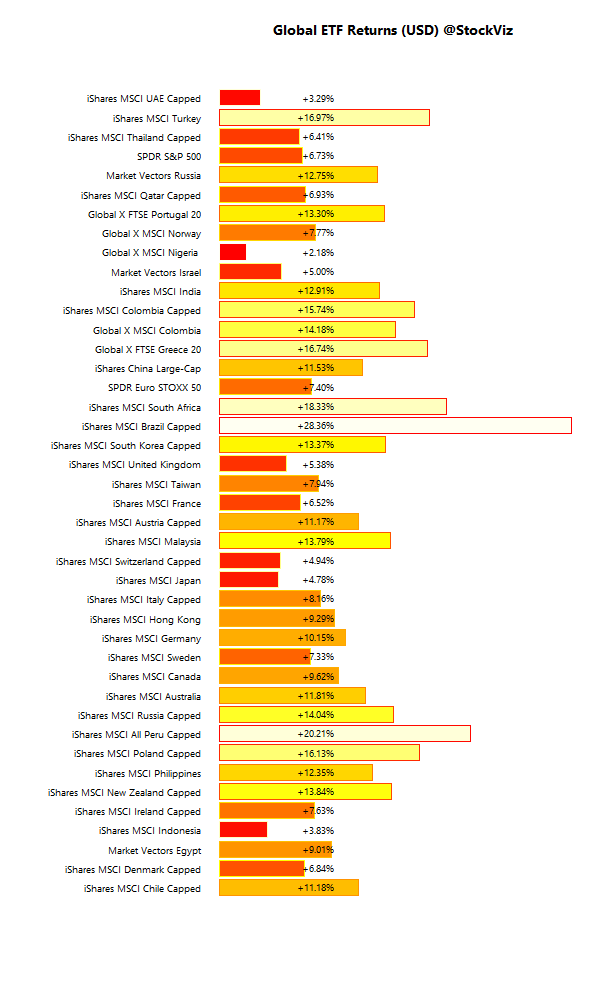
Markets rebounded with the Fed assuming the role of the world’s central bank…
International ETFs (USD)
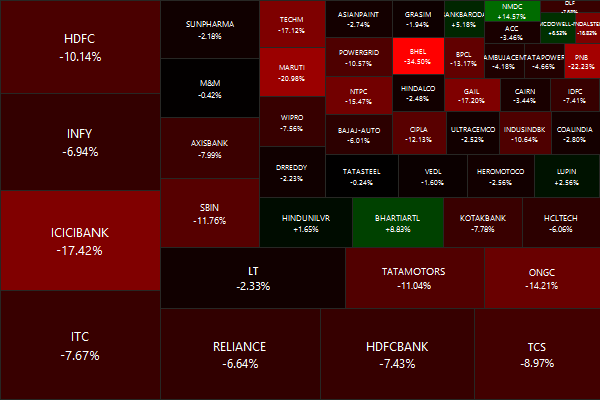
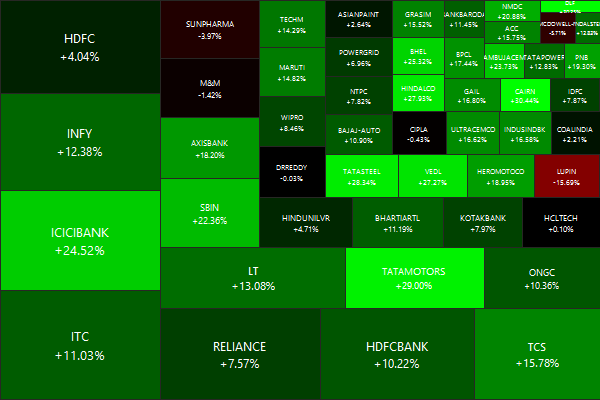
Nifty Heatmap
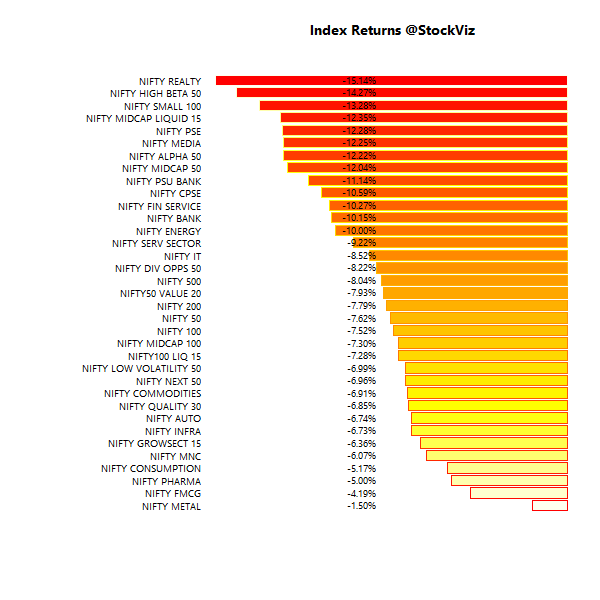
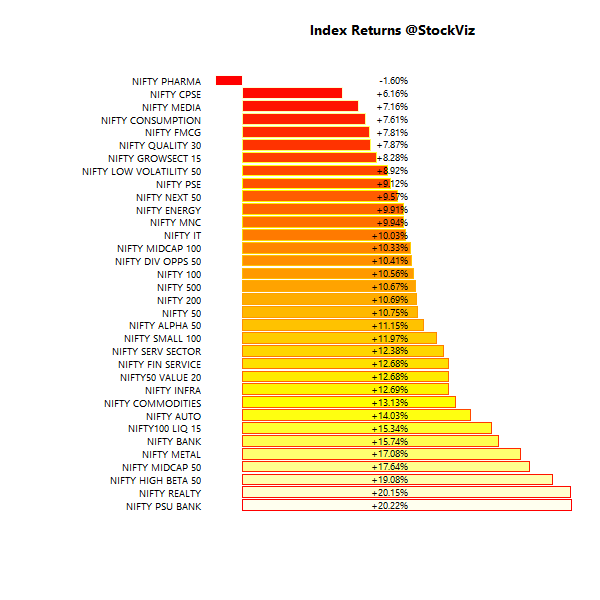
Index Returns
Market Cap Decile Performance
| Decile | Mkt. Cap. | Adv/Decl |
|---|---|---|
| 1 (micro) | +0.54% | 70/61 |
| 2 | +9.38% | 82/48 |
| 3 | +10.53% | 91/39 |
| 4 | +9.03% | 82/48 |
| 5 | +7.85% | 84/46 |
| 6 | +6.78% | 85/45 |
| 7 | +10.83% | 83/47 |
| 8 | +7.10% | 83/47 |
| 9 | +12.46% | 81/49 |
| 10 (mega) | +1.97% | 74/57 |
Top Winners and Losers
| TATAMOTORS | +29.00% |
| RELINFRA | +30.19% |
| CAIRN | +30.44% |
| LUPIN | -15.69% |
| APOLLOHOSP | -9.19% |
| COALINDIA | -6.13% |
Dash for trash?
ETF Performance
| PSUBNKBEES | +19.47% |
| BANKBEES | +15.43% |
| INFRABEES | +12.76% |
| NIFTYBEES | +11.70% |
| JUNIORBEES | +9.02% |
| CPSEETF | +8.08% |
| GOLDBEES | -3.22% |
With bank balance-sheet clean up in full swing, banks got the better bid…
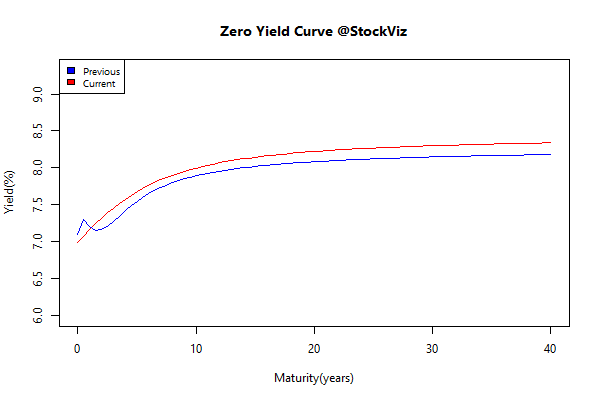
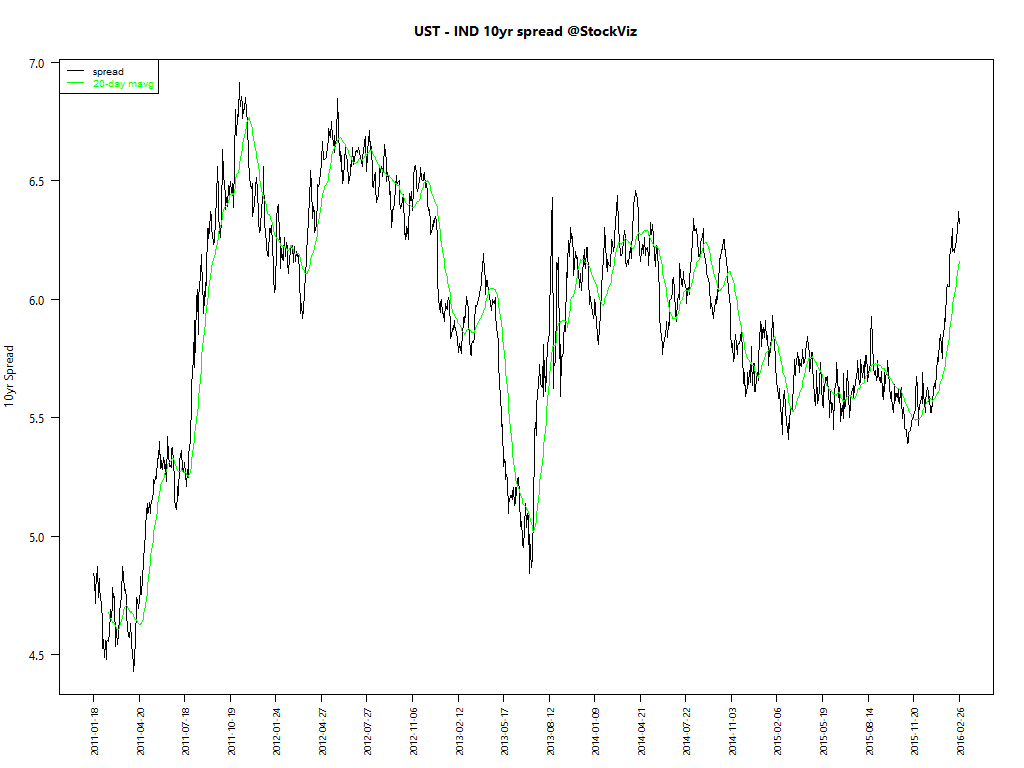
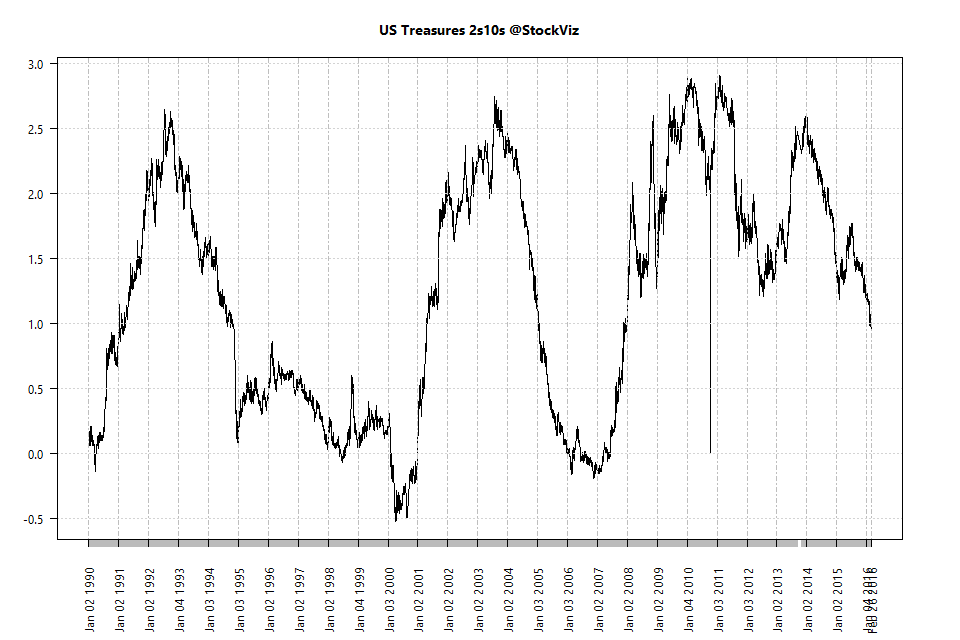
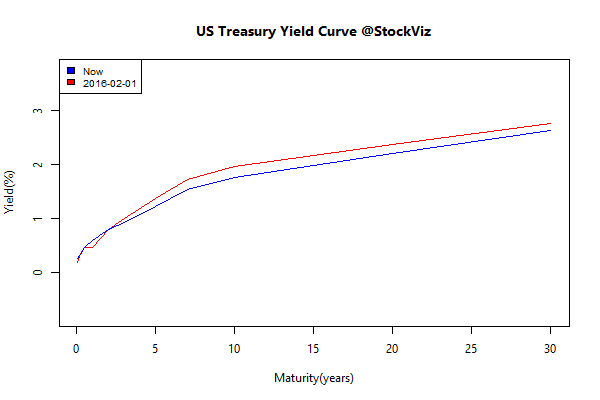
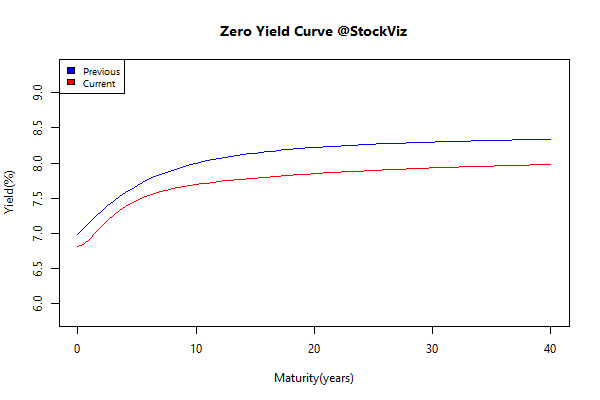
Yield Curve
Bond Indices
| Sub Index | Change in YTM | Total Return(%) |
|---|---|---|
| 0 5 | -0.22 | +1.22% |
| 5 10 | -0.24 | +1.91% |
| 10 15 | -0.30 | +2.56% |
| 15 20 | -0.35 | +3.94% |
| 20 30 | -0.37 | +4.59% |
Rate cut already factored in?
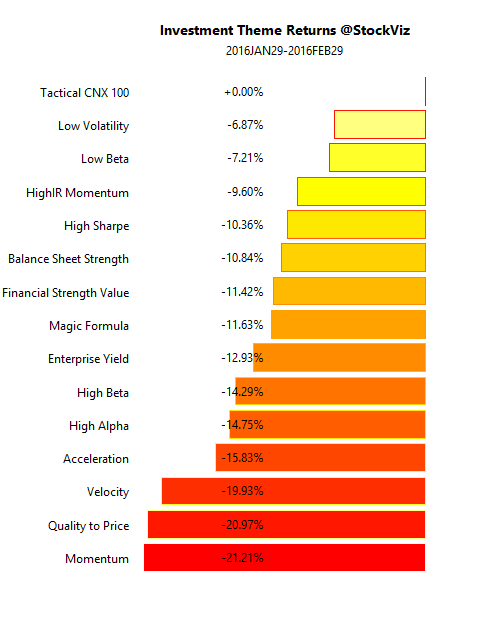
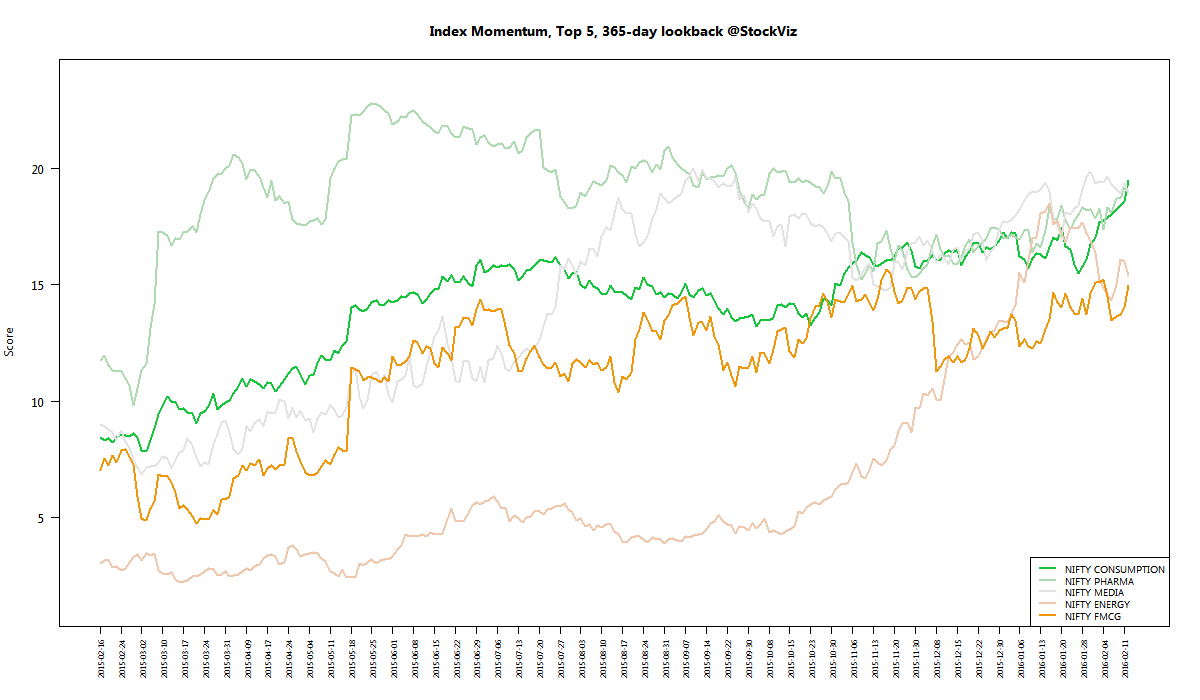
Investment Theme Performance
| High Beta | +17.65% |
| Magic Formula | +16.77% |
| Acceleration | +14.99% |
| Quality to Price | +13.49% |
| Velocity | +13.19% |
| Enterprise Yield | +13.04% |
| Financial Strength Value | +12.79% |
| Momentum | +11.93% |
| Balance Sheet Strength | +11.37% |
| High Alpha | +9.86% |
| Low Volatility | +9.14% |
| HighIR Momentum | +8.08% |
| High Sharpe | +7.67% |
| Low Beta | +7.34% |
| Tactical CNX 100 | +3.39% |
The worst hit asset classes saw the steepest rebound…
Equity Mutual Funds
Bond Mutual Funds
Thought to sum up the month
Why do amateurs believe they can outperform the professionals — or even identify those pros who will outperform? (Performance of individual mutual funds cannot be predicted with any greater degree of accuracy than individual stocks or bonds.)
- Overconfidence
- Optimism Bias
- Hindsight Bias
- Attribution Bias
- Confirmation Bias