Theme: Momentum Update 04.04.2016

held since returns (%)
SANGAMIND
2015-Sep-07
+14.87
NAVINFLUOR
2015-Dec-01
-8.90
8KMILES
2015-Dec-01
+10.09
RAJESHEXPO
2015-Dec-01
-12.27
KWALITY
2016-Jan-01
-16.69
MOREPENLAB
2016-Jan-01
-28.62
NILKAMAL
2016-Feb-02
-14.98
ICIL
2016-Feb-02
-7.74
GMBREW
2016-Feb-02
+18.41
COSMOFILMS
2016-Feb-02
+7.29
NDL
2016-Feb-02
-13.72
AEGISCHEM
2016-Feb-02
-0.10
MIC
2016-Feb-02
-10.63
WELSPUNIND
2016-Mar-02
+14.48
GAYAPROJ
2016-Mar-02
-12.90
JINDALPOLY
2016-Mar-02
+5.31
DISHMAN
2016-Mar-02
+0.59
JUBILANT
2016-Mar-02
+25.13
RUSHIL
2016-Mar-02
-34.70
CHENNPETRO
2016-Mar-02
+11.32
Since the last rebalance on 2016-Mar-02 till 2016-Apr-01, this strategy has returned +5.61%

You can find more details about the Momentum Theme here.

March Madness 2016

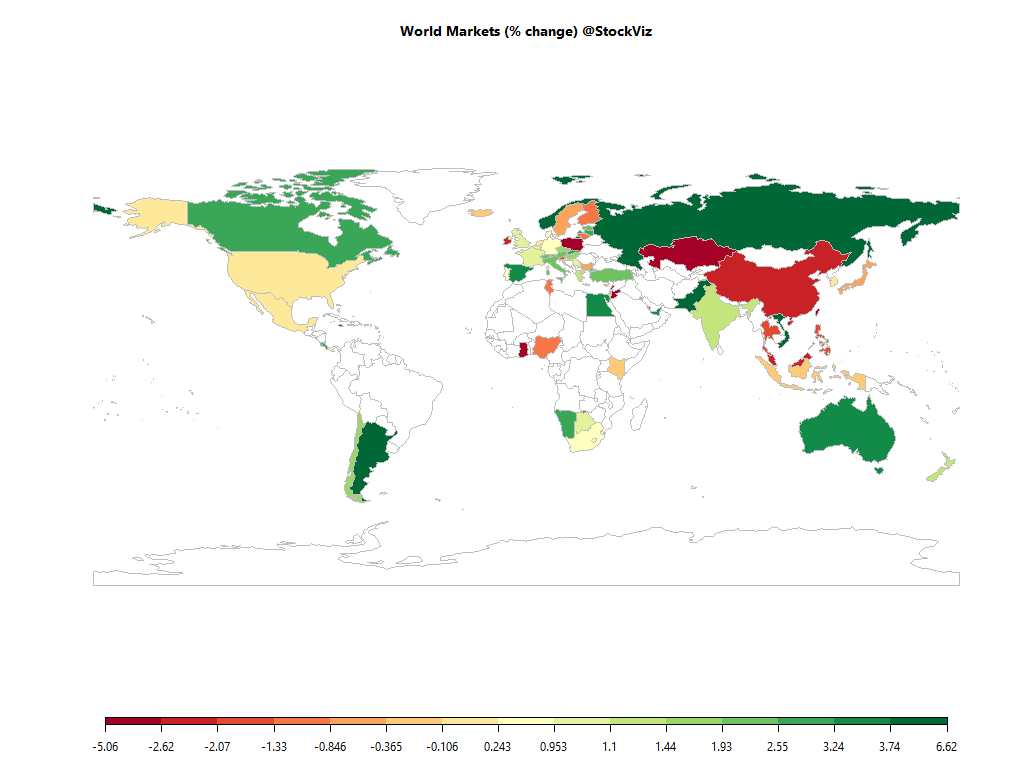
world.2016-02-29.2016-03-31

Equities

Major
DAX(DEU) +3.33%
CAC(FRA) -1.04%
UKX(GBR) +0.09%
NKY(JPN) +0.86%
SPX(USA) +5.44%
MINTs
JCI(IDN) +1.51%
INMEX(MEX) +5.97%
NGSEINDX(NGA) +2.95%
XU030(TUR) +9.00%
BRICS
IBOV(BRA) +16.69%
SHCOMP(CHN) +11.96%
NIFTY(IND) +10.39%
INDEXCF(RUS) +0.37%
TOP40(ZAF) +4.08%

Commodities

Energy
Brent Crude Oil +10.30%
Ethanol +4.44%
Heating Oil +8.39%
RBOB Gasoline +38.22%
Natural Gas +13.84%
WTI Crude Oil +11.73%
Metals
Palladium +15.93%
Copper +2.35%
Gold 100oz -0.06%
Silver 5000oz +4.73%
Platinum +5.15%

Currencies

USDEUR:-4.70% USDJPY:-0.63%

MINTs
USDIDR(IDN) -1.56%
USDMXN(MEX) -4.16%
USDNGN(NGA) +0.00%
USDTRY(TUR) -4.86%
BRICS
USDBRL(BRA) -9.97%
USDCNY(CHN) -1.35%
USDINR(IND) -3.18%
USDRUB(RUS) -9.94%
USDZAR(ZAF) -7.24%
Agricultural
Cocoa -2.75%
Feeder Cattle -0.55%
White Sugar +8.29%
Cattle -4.71%
Coffee (Robusta) +9.77%
Corn -1.27%
Lumber +21.75%
Orange Juice +17.57%
Sugar #11 +4.72%
Coffee (Arabica) +11.78%
Cotton +2.76%
Soybeans +7.00%
Lean Hogs -2.05%
Soybean Meal +4.55%
Wheat +5.96%

Credit Indices

Index Change
Markit CDX EM +2.89%
Markit CDX NA HY +3.28%
Markit CDX NA IG -27.66%
Markit iTraxx Asia ex-Japan IG -6.67%
Markit iTraxx Australia -15.03%
Markit iTraxx Europe -26.80%
Markit iTraxx Europe Crossover -98.68%
Markit iTraxx Japan -9.45%
Markit MCDX (Municipal CDS) -14.58%
Markets rebounded with the Fed assuming the role of the world’s central bank…

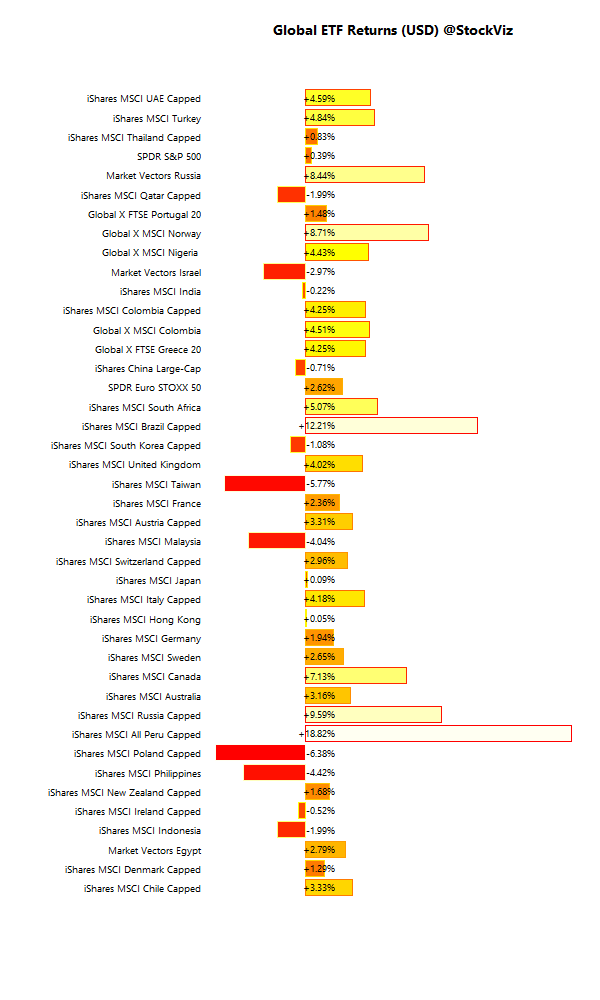
International ETFs (USD)

global.etf.performance.2016-02-29.2016-03-31

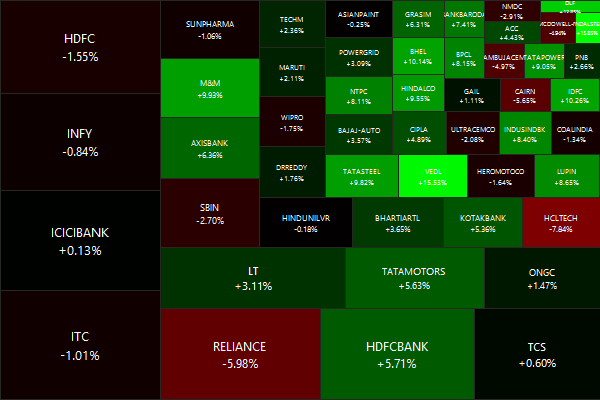
Nifty Heatmap

NIFTY 50.2016-02-29.2016-03-31

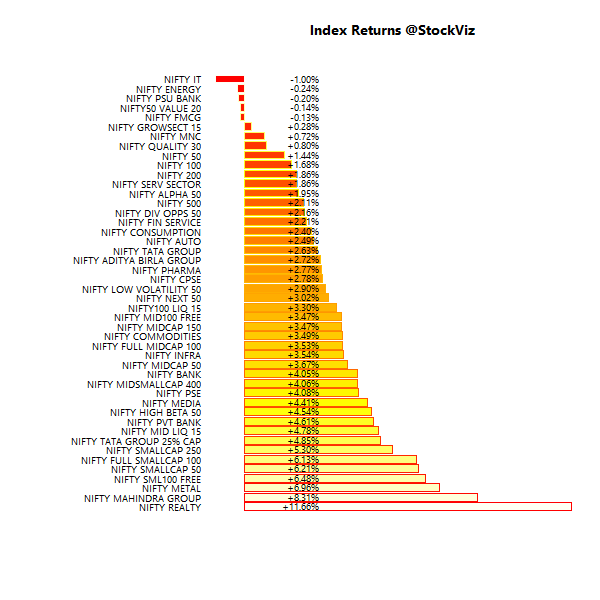
Index Returns

index.performance.2016-02-29.2016-03-31

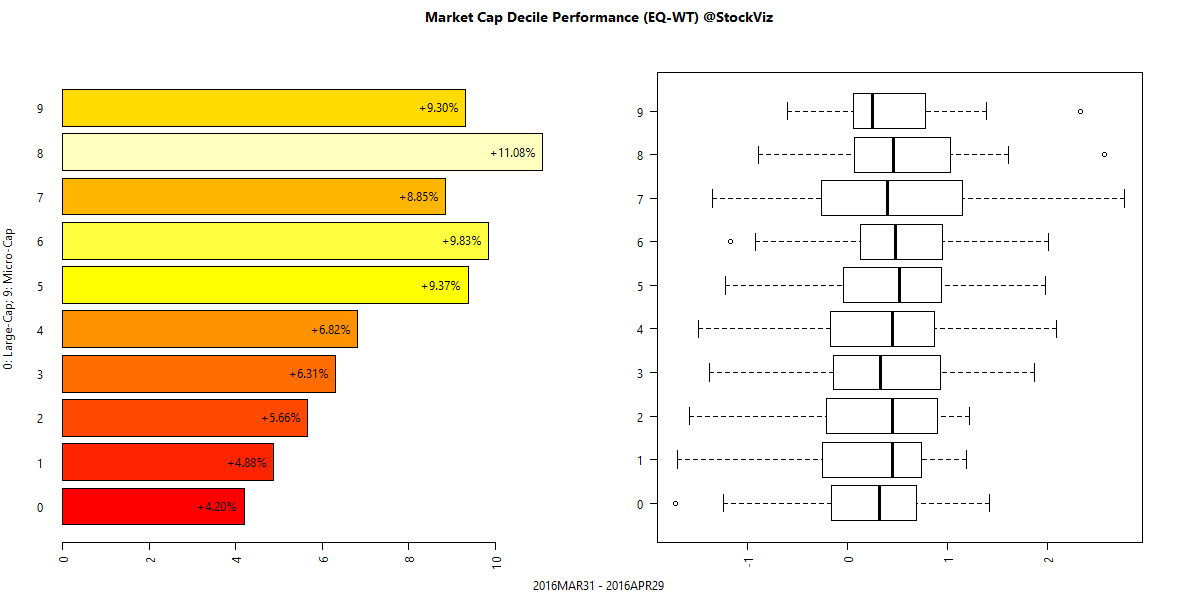
Market Cap Decile Performance

Decile Mkt. Cap. Adv/Decl
1 (micro) +0.54% 70/61
2 +9.38% 82/48
3 +10.53% 91/39
4 +9.03% 82/48
5 +7.85% 84/46
6 +6.78% 85/45
7 +10.83% 83/47
8 +7.10% 83/47
9 +12.46% 81/49
10 (mega) +1.97% 74/57

Top Winners and Losers

TATAMOTORS +29.00%
RELINFRA +30.19%
CAIRN +30.44%
LUPIN -15.69%
APOLLOHOSP -9.19%
COALINDIA -6.13%
Dash for trash?

ETF Performance

PSUBNKBEES +19.47%
BANKBEES +15.43%
INFRABEES +12.76%
NIFTYBEES +11.70%
JUNIORBEES +9.02%
CPSEETF +8.08%
GOLDBEES -3.22%
With bank balance-sheet clean up in full swing, banks got the better bid…

Yield Curve

yieldCurve.2016-02-29.2016-03-31

Bond Indices

Sub Index Change in YTM Total Return(%)
0 5 -0.22 +1.22%
5 10 -0.24 +1.91%
10 15 -0.30 +2.56%
15 20 -0.35 +3.94%
20 30 -0.37 +4.59%
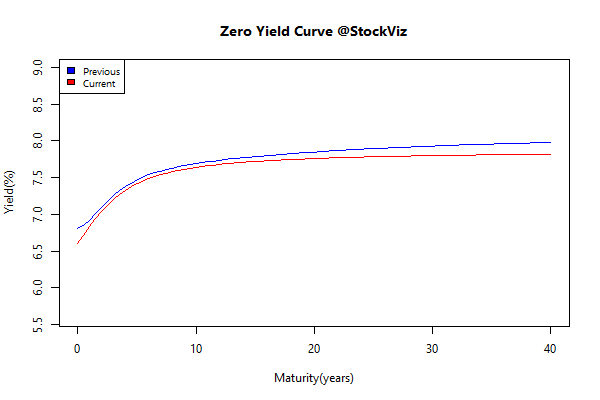
Rate cut already factored in?

Investment Theme Performance

The worst hit asset classes saw the steepest rebound…

Equity Mutual Funds

Bond Mutual Funds

Thought to sum up the month

Why do amateurs believe they can outperform the professionals — or even identify those pros who will outperform? (Performance of individual mutual funds cannot be predicted with any greater degree of accuracy than individual stocks or bonds.)

  1. Overconfidence
  2. Optimism Bias
  3. Hindsight Bias
  4. Attribution Bias
  5. Confirmation Bias

Source: Why We Think We’re Better Investors Than We Are

Monthly Recap: Winter

world.2016-01-29.2016-02-29

Equities

Major
DAX(DEU) -3.09%
CAC(FRA) -1.44%
UKX(GBR) +0.22%
NKY(JPN) -9.14%
SPX(USA) +0.40%
MINTs
JCI(IDN) +3.52%
INMEX(MEX) +2.41%
NGSEINDX(NGA) +2.74%
XU030(TUR) +3.56%
BRICS
IBOV(BRA) +6.39%
SHCOMP(CHN) -1.50%
NIFTY(IND) -7.62%
INDEXCF(RUS) +3.10%
TOP40(ZAF) -0.60%

Commodities

Energy
Brent Crude Oil +5.42%
RBOB Gasoline +20.16%
WTI Crude Oil +0.57%
Ethanol -2.68%
Heating Oil +3.61%
Natural Gas -25.63%
Metals
Copper +1.94%
Palladium +0.74%
Platinum +7.21%
Gold 100oz +11.54%
Silver 5000oz +4.93%

Currencies

USDEUR:-0.50% USDJPY:-7.25%

MINTs
USDIDR(IDN) -2.92%
USDMXN(MEX) +0.11%
USDNGN(NGA) +0.10%
USDTRY(TUR) +0.22%
BRICS
USDBRL(BRA) +0.07%
USDCNY(CHN) -0.53%
USDINR(IND) +0.93%
USDRUB(RUS) -0.89%
USDZAR(ZAF) -0.25%
Agricultural
Cattle +3.18%
Feeder Cattle +1.22%
Lean Hogs +6.19%
White Sugar +0.02%
Coffee (Robusta) +0.51%
Corn -4.78%
Lumber +5.88%
Soybeans -2.98%
Wheat -6.37%
Cocoa +10.09%
Cotton -4.85%
Coffee (Arabica) -3.26%
Orange Juice -9.50%
Soybean Meal -4.92%
Sugar #11 +9.12%

Credit Indices

Index Change
Markit CDX EM +0.27%
Markit CDX NA HY -0.58%
Markit CDX NA IG +7.19%
Markit iTraxx Asia ex-Japan IG +5.66%
Markit iTraxx Australia +15.41%
Markit iTraxx Europe +9.54%
Markit iTraxx Europe Crossover +45.82%
Markit iTraxx Japan +12.00%
Markit MCDX (Municipal CDS) +3.25%
Jan and Feb saw a wave of volatility hit pretty much every asset class. Diversification provided scant protection in wave-after-wave of selling across world markets and asset classes. Hopefully the great purge is done and we can look forward to better days ahead…

International ETFs (USD)

global.etf.performance.2016-01-29.2016-02-29

Nifty Heatmap

NIFTY 50.2016-01-29.2016-02-29

Index Returns

index.performance.2016-01-29.2016-02-29

Market Cap Decile Performance

Decile Mkt. Cap. Adv/Decl
1 (micro) -22.65% 46/80
2 -19.11% 29/96
3 -20.26% 31/95
4 -17.46% 30/95
5 -16.40% 31/95
6 -15.09% 37/88
7 -12.49% 42/84
8 -12.19% 34/91
9 -11.15% 50/76
10 (mega) -6.23% 63/63
Mid- small- and micro-caps bore the brunt…

Top Winners and Losers

MARICO +6.81%
BHARTIARTL +8.83%
EICHERMOT +14.23%
BHEL -34.50%
PNB -22.23%
AUROPHARMA -21.41%
Eicher Motors emerged a big winner…

ETF Performance

GOLDBEES +9.31%
JUNIORBEES -6.73%
INFRABEES -6.80%
NIFTYBEES -7.07%
CPSEETF -9.72%
BANKBEES -9.83%
PSUBNKBEES -11.21%
Gold. Enuf said.

Yield Curve

yieldCurve.2016-01-29.2016-02-29

Bond Indices

Sub Index Change in YTM Total Return(%)
0 5 +0.14 +0.28%
5 10 +0.12 +0.02%
10 15 +0.15 -0.42%
15 20 +0.12 -0.41%
20 30 +0.11 -0.38%
Long bonds got shellacked…

Investment Theme Performance

Equity Mutual Funds

Bond Mutual Funds

Fund flows

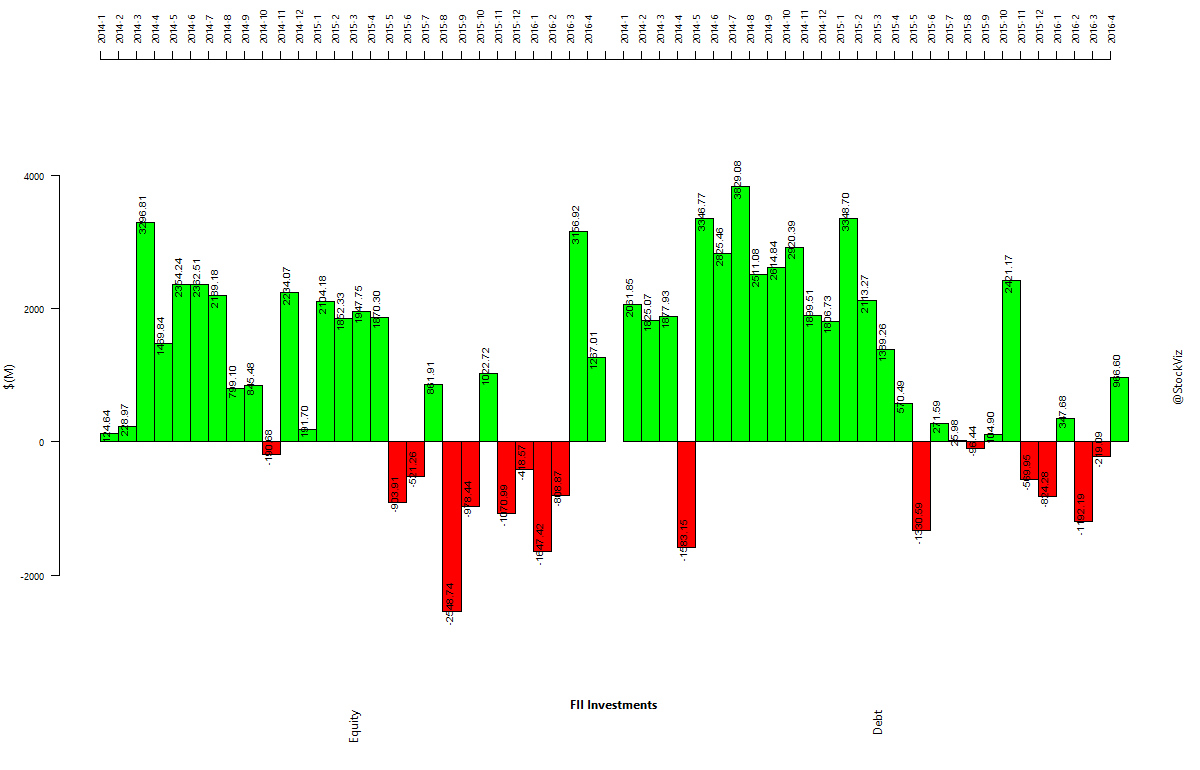
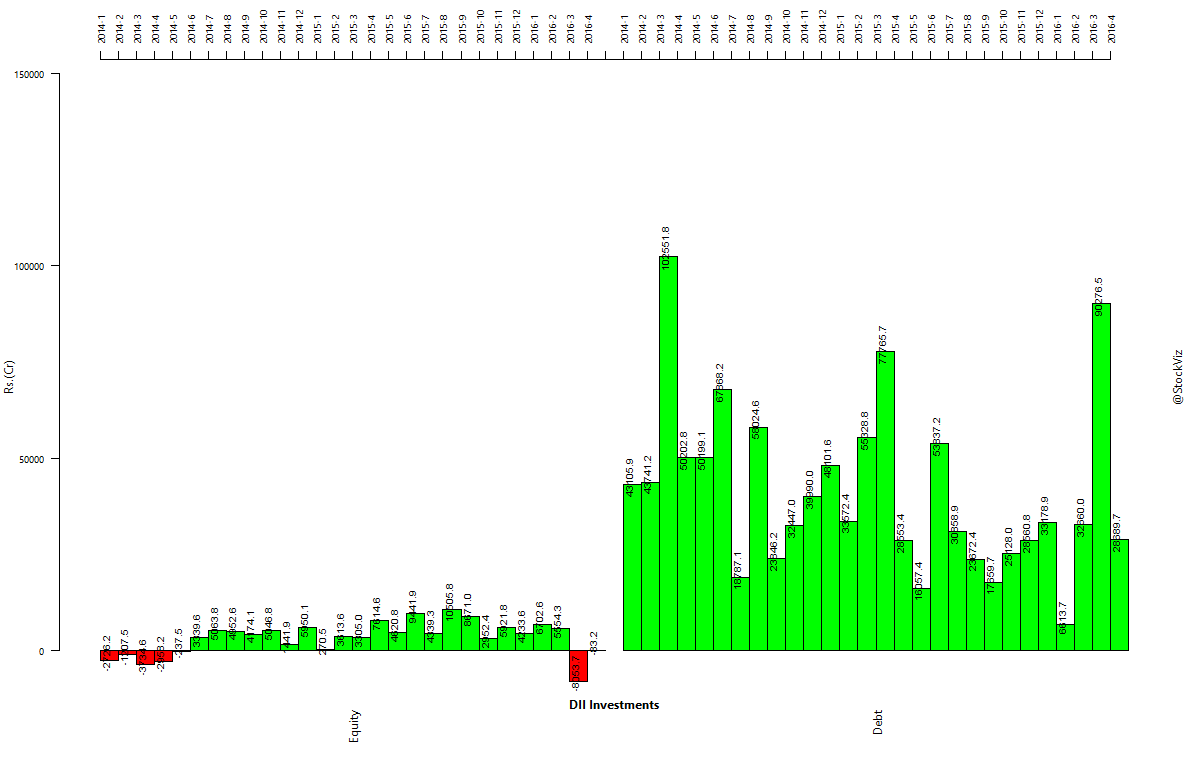
FIIs sold out of both equities and bonds…

fii-investments.2014-01-01.2016-02-29

dii-investments.2014-01-01.2016-02-29

Bonds

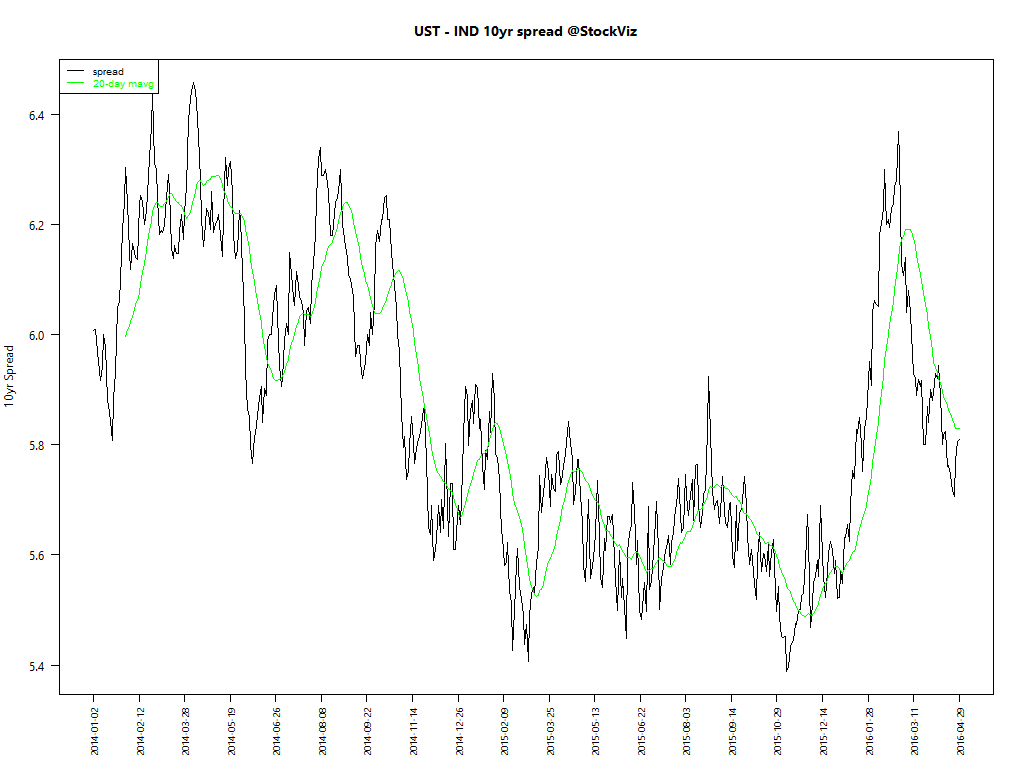
The spread between 10-year US treasuries and Indian gilts are at levels seen in late 2013…
ust-ind-10yr-spread.2011-01-18

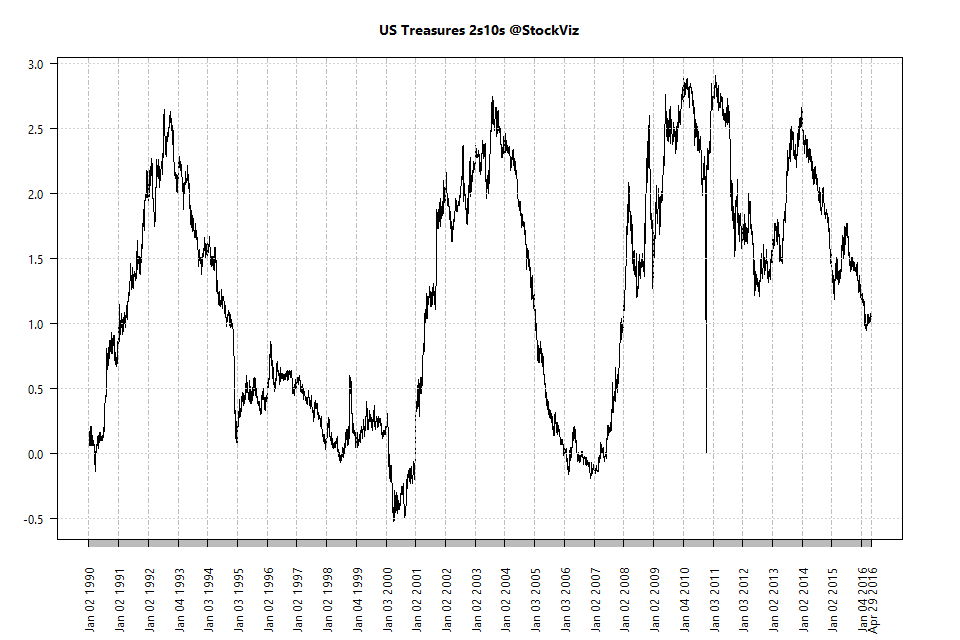
… and all is not hunky-dory in the US bond markets either. The spread between 10yrs and 2yrs are at their lowest since 2008…
ust-yield-curve.2s10s

… and the whole yield curve shifted down in February.
ust-yield-curve.2011-01-18

Thoughts

As we hit ‘publish’ on this article, Indian markets are enjoying a post-budget rally. Did markets find a bottom in February? Or is more pain to come? Bring on the March madness!

Introducing the Global Macro Dashboard

It is all local until it is not

World markets just witnessed a spiraling sell-off that caught most investors off-guard. The problem is that for most of the time, markets are local. Except for those times when they aren’t and correlations go to 1.

We tried singling out different factors to check if they could act as leading indicators of market sell-offs:

It is not one thing and it is never the same thing

The problem is that, statistically, no one global indicator is going to be a perfect canary in the coal mine. However, once the number of “meaningful” events crosses a threshold, correlations tend to 1.

But what exactly defines “meaningful?” Is it 1-sigma or 2-sigma? Should it be change in price or price itself? What should be the number of periods over which these statistics are calculated? The answers to these questions are going to take a while to figure out. In the meantime, we decided to create a dashboard that lets investors choose some of these filters.

You can play with our Global Macro Dashboard here: StockViz/GlobalDashboard

Welcome to glocal markets.

Index Update 14.02.2016

MOMENTUM

We run our proprietary momentum scoring algorithm on indices just like we do on stocks. You can use the momentum scores of sub-indices to get a sense for which sectors have the wind on their backs and those that are facing headwinds.

Traders can pick their longs in sectors with high short-term momentum and their shorts in sectors with low momentum. Investors can use the longer lookback scores to position themselves using our re-factored index Themes.

You can see how the momentum algorithm has performed on individual stocks here.

Here are the best and the worst sub-indices:

index momentum best 365 2016-02-12 png

index momentum best 50 2016-02-12 png

index momentum worst 365 2016-02-12 png

index momentum worst 50 2016-02-12 png

Relative Strength Spread

NIFTY_500 relative-spread-index 50 2016-02-12 png

Refactored Index Performance

50-day performance, from December 03, 2015 through February 12, 2016:

Equally Weighted Market Cap. Weighted
GROWSECT 15 (EQUAL) -6.95% IT (CAP) -3.90%
QUALITY 30 (EQUAL) -9.73% PHARMA (CAP) -4.29%
FMCG (EQUAL) -10.08% GROWSECT 15 (CAP) -4.52%
CONSUMPTION (EQUAL) -11.07% QUALITY 30 (CAP) -7.22%
AUTO (EQUAL) -11.17% ENERGY (CAP) -8.90%
PHARMA (EQUAL) -11.26% FMCG (CAP) -10.06%
ENERGY (EQUAL) -11.53% COMMODITIES (CAP) -10.30%
MNC (EQUAL) -12.24% CONSUMPTION (CAP) -10.41%
COMMODITIES (EQUAL) -12.32% SERV SECTOR (CAP) -11.79%
IT (EQUAL) -13.54% VALUE 20 (CAP) -12.03%
MEDIA (EQUAL) -15.13% MEDIA (CAP) -12.18%
VALUE 20 (EQUAL) -15.16% MNC (CAP) -12.86%
SERV SECTOR (EQUAL) -16.18% PSE (CAP) -14.25%
PSE (EQUAL) -17.26% METAL (CAP) -14.56%
CPSE (EQUAL) -19.21% AUTO (CAP) -15.14%
FIN SERVICE (EQUAL) -20.29% CPSE (CAP) -15.57%
LIQ 15 (EQUAL) -20.52% FIN SERVICE (CAP) -16.78%
INFRA (EQUAL) -21.81% INFRA (CAP) -16.79%
BANK (EQUAL) -22.99% BANK (CAP) -18.51%
METAL (EQUAL) -23.62% LIQ 15 (CAP) -20.52%
REALTY (EQUAL) -25.92% MIDCAP LIQUID 15 (CAP) -23.99%
MIDCAP LIQUID 15 (EQUAL) -25.97% REALTY (CAP) -26.29%
PSU BANK (EQUAL) -38.49% PSU BANK (CAP) -36.73%

Trend Model Summary

Index Signal % From Peak Day of Peak
NIFTY AUTO LONG
22.25
2015-Jan-27
NIFTY BANK LONG
32.03
2015-Jan-27
NIFTY COMMODITIES LONG
42.67
2008-Jan-04
NIFTY CONSUMPTION LONG
14.40
2015-Aug-05
NIFTY ENERGY LONG
37.45
2008-Jan-14
NIFTY FIN SERVICE LONG
28.84
2015-Jan-28
NIFTY FMCG LONG
17.79
2015-Feb-25
NIFTY INFRA LONG
63.65
2008-Jan-09
NIFTY IT LONG
89.19
2000-Feb-21
NIFTY MEDIA LONG
26.02
2008-Jan-04
NIFTY METAL LONG
72.78
2008-Jan-04
NIFTY MNC LONG
22.21
2015-Aug-10
NIFTY PHARMA SHORT
19.88
2015-Apr-08
NIFTY PSE LONG
43.76
2008-Jan-04
NIFTY PSU BANK LONG
63.39
2010-Nov-05
NIFTY REALTY LONG
93.12
2008-Jan-14
NIFTY SERV SECTOR LONG
23.80
2015-Mar-03
FMCG/Consumption provided some “flight-to-safety” benefits. But the overall 50-day performance of different sub-sectors have been pretty grim.