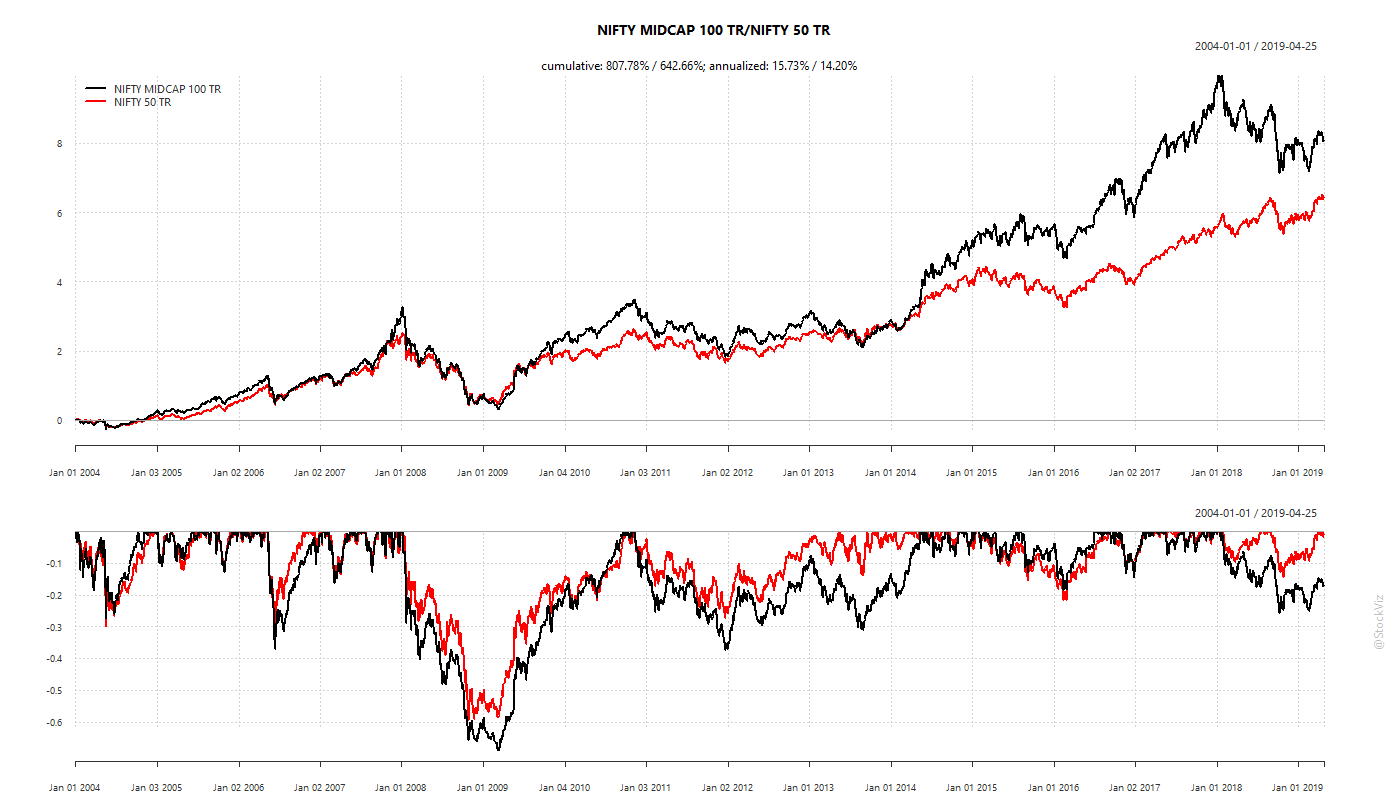
Book Review: Atomic Habits

In the book Atomic Habits: An Easy and Proven Way to Build Good Habits and Break Bad Ones (Amazon,) author James Clear lays out a step-by-step guide on how to adopt better habits.

An excerpt from the book that hit the spot for me:

Your current habits are not necessarily the best way to solve the problems you face; they are just the methods you learned to use. Once you associate a solution with the problem you need to solve, you keep coming back to it.
Habits are all about associations.
You see a cue, categorize it based on past experience, and determine the appropriate response.
Every action is preceded by a prediction. Life feels reactive, but it is actually predictive.
Our behavior is heavily dependent on these predictions. Put another way, our behavior is heavily dependent on how we interpret the events that happen to us, not necessarily the objective reality of the events themselves.

Most investors are well aware of biases that they should overcome. However, when the hypothetical becomes real, they feel powerless to control their behavior. How do you go about making the right choices by default? By making them a habit. And this book will put you on a path where you can make better choices.

Recommendation: Must read!

No Silver Bullets

Most of the time, beta swamps alpha. Take the case of the Roubini Country Insights model, for example. It claims to “rank countries based on an analysis of over 2500 data points from institutions such as the Bank of International Settlements and the World Bank.” Also, “these data points cover each country’s demographics, quality of education, healthcare and ability to innovate, and will look at the country’s growth potential in political and social spheres, as well as its top-down macro-economic situation.” It sounds like it does everything that a smart investment manager with a long-only global equities mandate should be doing. And you would expect such a smart model to add significant alpha.

Thanks to Barclays, a bunch of equity indices based on this model have been available for a while now. We were curious as to how these performed vs. their corresponding plain-vanilla market-cap weighted cousins.

market-cap vs. maro-quant

Developed markets: MSCI World (black) vs. Insights (green)
Emerging markets: MSCI EM (red) vs. Insights (blue)

The value add from the smart-beta quantitative “Insights” model, roughly about 1% a year, seems skinny compared to all the work that must have gone into it. 2500 data points is a big dataset but it looks like most of them have no effect on equity returns. This also ties into the curse of dimensionality when dealing with complex adaptive systems – more data typically subtracts from the model.

As an investor, it probably would have been easier to stay invested in one of the cap-weighted indices, just accepting the beta, rather than reach for that 1% extra with fancy sounding strategies.

Index Valuations, Part II

In Part I of Index Valuations, we showed how the relative PE (price-to-earnings ratio) and PB (price-to-book ratio) of the NIFTY 50 and NIFTY MIDCAP 50 indices have varied over time. What would a portfolio that weighted each of these based on the relative valuation ratio look like?

Backtest

Suppose, the relative ratio (R) = Ratio(MIDCAP)/Ratio(NIFTY)
Then, at the end of every month, re-weight the protfolio so that portfolio (S1) = R * NIFTY + (1-R) * MIDCAP, and
portfolio (S2) = (1-R) * NIFTY + R * MIDCAP

Ratio can either be PE or PB

PE based weights:
PE weights

PB based weights:
PB weights

It looks like:

  1. a portfolio with PB based weights is a lot less volatile than the PE based one.
  2. PB portfolio recovers much faster that the PE or plain-vanilla indices from deep drawdowns
  3. PB out-performs an equal weight portfolio

You can track and map this strategy to your portfolio using the PB weighted NIFTY/MIDCAP Theme.

Code and charts on github.

What is the right benchmark for funds owning US equities?

Some funds, the Parag Parikh Long Term Equity, for example, have a carve out for international (primarily US) equities. From a tax perspective, if a fund owns at least 65% of its portfolio in Indian stocks, it is treated as “Indian Equity Fund” for taxation – 15% short-term gains and 10% long-term gains (if held beyond one year). Otherwise, short-term gains (if held for less than 3-years) are added to your income and taxed at your marginal rate. So there is some advantage in packaging US stocks inside a an Indian equity fund. However, what is the appropriate benchmark in this case?

The PP-LTE Fund benchmarks against the NIFTY 500 TR index. But based on its portfolio, it should ideally be benchmarked against a 65/35 Indian Midcap/US Large Cap index. If you construct an Index with the M100 ETF making 65% of the portfolio and the rest allocated to the SPY ETF (tracking the S&P 500 index,) you will get an idea of the fund’s alpha/excess returns.

Parag Parikh Long Term Equity vs. 65/35 M100/SPY:
PPFAS.Dir.vs.ETFs

If you rebalance the 65/35 monthly, the LTE Fund’s annualized returns are 16.47% (Reg.) and 17.10% (Dir.) vs. the 65/35’s 15.30%. That’s excess returns of 1.8% for the direct plan, delivered to investors in a tax efficient manner, after all costs have been factored in. Another way to look at this is that even if the present management is replaced and investors do not have faith in the new one, they can just replace the fund with two ETFs and get almost to the same place.

Code and charts on github.