The Little Book of Behavioral Investing: This Time is Different

Bubbles. Kids love them. Investors hate them. And if the rest of the populace understood their meaning in financial terms, they would hate ’em too. Especially in the current economic climate, largely the result of a bubble that blinded, muted and deafened us from the signs of a tornado in the making.

To be fair, words of dissent and caution did rise during the bubble of India’s accelerating growth, warning investors and leaders of impending danger. But as happens in the case of most bubbles, no one really listens. Instead, the harbinger of bad news becomes the target of jokes, rants, and career aspersions.

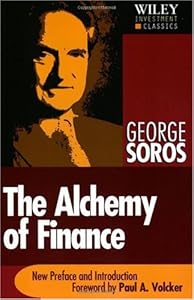
Cover of "The Little Book of Behavioral I...

A “bubble” in market parlance is defined as a real price movement at least two standard deviations from trend. But more than the definition, it’s the aftermath of the bubble that brings home the real meaning of the deadly phenomenon. We’re onto Chapter 11 of The Little Book of Behavioral Investing: How not to be your worst enemy. And the theme this time, as I’m sure you’ve guessed, is bubbles.

India is currently experiencing the repercussions of a debt-driven bubble gone bust. As Jayanti Ghosh, Professor of Economics and Chairperson at the Centre for Economic Studies and Planning, Jawaharlal Nehru University, New Delhi states: “The Indian economy may well be on the verge of a full-blown currency crisis.”

Inflation is biting the middle class from every side. With the price of basic amenities touching the sky, and the rupee-dollar rate making exporters jittery, we’re exhibiting the classic signs of “revulsion,” the terminal phase of John Stuart Mill‘s framework of a bubble. Let’s break that up:

Phase 1: Displacement: India’s potential is discovered by developing countries like US, UK, etc. Lots of capital flows in. Real estate and construction jump. Traded goods see a slump.

Phase 2: Bubble nurturing: As the boom grows, more investment options arise in non-trading sectors such as real estate and construction. Credit lines opened up for the masses, at low interest rates.

Phase 3: Euphoria: The general consensus is that the graph will continue rising. Investors abandon time-tested valuation methods and adopt new tools to justify the current price and trend. Over-confidence and over-optimism rule decisions as investors stop thinking about the logic and viability of their commitments. Everyone wants a slice of the pie.

Phase 4: Financial distress: Insiders start cashing out. Since June more than $12bn has been withdrawn by portfolio investors alone (ref). This is a phase when fraud and defaults abound and traders are forced to sell goods at basement prices to meet obligations.

Phase 5: Revulsion: Investors stay away from the market, needing time to recover from the shock. This leads to bargain basement asset prices. That’s where we’re at today.

Montier quotes Herb Stein’s (Chairman of the Council of Economic Advisers under Presidents Nixon and Ford) prophetic words to underscore the fatality of bubbles: “If something can’t go on forever, it won’t.” If the market looks too good to be true, it probably is.

Why, if the signs of a bubble are apparent to at least some market watchers, do investors get taken in? Sometimes it’s because professional investors must answer to clients and bosses who disagree with their cautious point of view. It becomes a choice between risking their career or their client’s money – an easy decision for most. And other times, investors are blinded by their own behavioral tendencies, namely:

  1. Over-optimism: Bad things only happen to other people. We’re good.
  2. Illusion of control: We can control the outcome of events, however high the probability of our loss if we measure the problem mathematically.
  3. Self-serving bias: We interpret information to suit our self-interest – keep the client happy (not that that’s going to last), listen to the boss, I need this job, etc.
  4. Myopia: We focus on the short-term versus long for palliative comfort. Why worry about tomorrow?
  5. Inattentional blindness: An interesting word that means we simply do not expect to see what we’re not looking for. Meaning that if a bear winged past while we were looking for that plane on the horizon, we probably wouldn’t notice.

Montier suggests investors keep the following points in mind to avoid succumbing to bubbles:

  1. Educate yourself on market history. The stories are horrifying enough to make you vigilant.
  2. Don’t assume bubbles are black swans. The signs are always visible, if you’re looking for them.

Bubble busts have broken economies before and the worst for us could still be ahead. Meanwhile, Montier suggests an action plan for investors – Watch the market for signs and do your own research. Don’t ignore circumstances for short-term gains because the long-term impact of a bubble can break you for good.


Monica Samuel is doing a chapter-wise review of the book: The Little Book of Behavioral Investing: How not to be your worst enemy by James Montier. You can follow the series by following this tag: tlbbinvesting or by subscribing to this rss feed: tlbbifeed


Weekly Recap: Tolstoy vs. Chekov

Nifty weekly performance heatmap

Oh what a week! It took Rajan’s encouraging words to salvage what could have been a complete rout. Nifty: -1.38% (-1.90% in USD terms)

Index Performance

index weekly performance

Top Winners and Losers

TATASTEEL +5.51%
DIVISLAB +12.53%
ADANIENT +12.58%
ASHOKLEY -10.91%
TATAGLOBAL -10.09%
RELINFRA -8.49%
Adani Enterprises continued to enthrall… Should call it Adani Entertainment instead.

Etfs

JUNIORBEES +1.11%
GOLDBEES +0.98%
INFRABEES -0.22%
BANKBEES -0.53%
PSUBNKBEES -1.42%
NIFTYBEES -1.49%
Midcaps outperformed Largecaps. Question for PSU banks: how much are you going to dilute existing investors?

Advancers and Decliners

advancers and decliners

Yield Curve

Holiday-shortened four day week. Can’t read much into this…

yield curve

Interbank Rates

mibor intebank lending rates

Sector Performance

weekly sector performance chart

Investment Theme Performance

Value themes beat everything else fair and square…

Thought for the Weekend

Tolstoy was a fox whose work was somewhat compromised, especially later in his life, by his belief that one ought to be a hedgehog. To choose Tolstoy is to accept that Pahom ought to have limited his ambitions and chosen to act dead rather than die trying to own the world.


Chekov is pure fox. He offers many conflicting, ambiguous and impressionistic takes on the human condition. But on one point he is unambiguous: in the acting dead/choosing life decision, Chekov is unwavering in his assertion that choosing life is the right thing to do, whatever that choice might entail.


Russia chose wrong, and ended up with the Soviet Union.

Source: The Gooseberry Fallacy

Will the real arbitrageur please stand up?

The first sign of active HFT involvement is that most of the low-hanging fruit would have been plucked. i.e., text-book arbitrage opportunities would not exist. In the futures market, the low-hanging fruit is the cash-futures basis. Equity futures have a ‘fair-value’:

Futures Price = Cash Price [1+r (x/360)] – Dividends; where x = days to expiration of the futures contract

So whenever the basis goes out of hand, its possible to pocket some risk-free profit.

  1. if Futures << Cash, go long futures, short cash. Or,
  2. if Futures >> Cash, go short futures, long cash.

Given the absurdity involved in shorting stocks, option 1) is not feasible for individual investors. But if HFT arbitrageurs are efficient, then scenario 2) should not exist. So I pulled up some charts and I have annotated days where HFT machines were probably in sleep mode. The filled candlesticks are the cash and the black boxes are the futures candlesticks. Ideally, the futures black boxes should coincide with the cash candlesticks.

JUBLFOOD futures and cash candlestick chart

IDEA futures and cash candlestick chart

Since August this year, there has been at least 5 instances where a risk-free profit could have been locked in by shorting futures and going long cash – if you had a low-latency trading machine.

I pulled up the charts of some of the other punter counters:

JPASSOCIAT futures and cash candlestick chart

RCOM futures and cash candlestick chart

TATASTEEL futures and cash candlestick chart

ADANIENT futures and cash candlestick chart

So what exactly is going on here? Is the cost of funding so high that the HFT guys let this one slide? Or is the liquidity so bad that this can’t be done in size, and hence not attractive to HFT? Will the real arbitrageur please stand up?


Ashwani and Emkay: Doodh ya Paani?

The analysts at Ashwani Gujral have collated list of five stocks which can deliver 10-50% returns in the next one year amid volatility. (ET) And not to be left behind, Emkay came out with a research report that picked 9 stocks for the long haul. (MC)

In our tradition of recording things for posterity, we have create two Themes that will track the performance of these research reports:
Ashwani Gujral’s Top 5 Picks – Nov 2013
Emkay’s Picks Nov-2013

 
You can now follow these themes from right within your portfolio and keep track of how the individual stocks perform.


USDINR 63.5/65 Bull Spread

We entered a USDINR 63.5/65 Bull Spread today. Basically you buy the ITM call and sell the OTM strike – cheaper than buying a call outright.

The trade has a max payoff of Rs. 955 and costs around Rs. 565 to put on. Here’s how the pay-off looks like:

USDINR bull spread payoff

The break-even is around 64 – basically the Rupee has to trade above that. But since we sold the 65 call, our returns are capped if the Rupee depreciates below 65 anytime soon. Novembers were last trading at 64.02 (+0.34)

USDINR technical chart

We had discussed a USDINR Condor before where we were betting on range-bound behavior… and it didn’t quite end well. Hopefully the setup works better this time… fingers crossed!