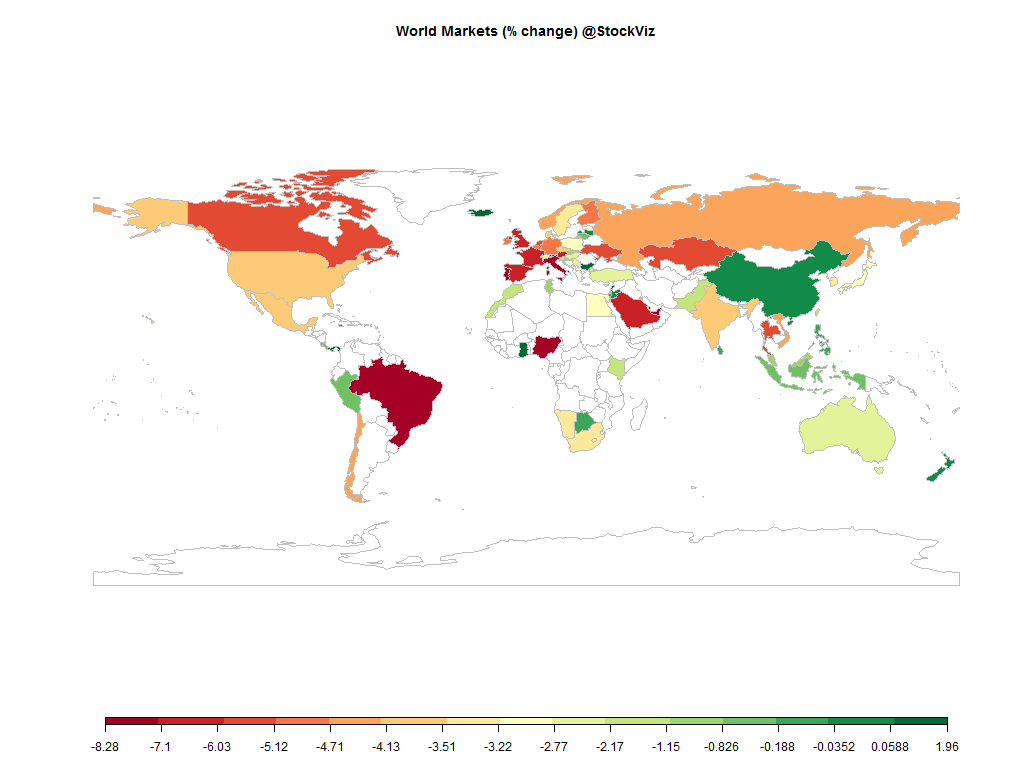
Equities
Commodities
| Energy |
| Brent Crude Oil |
-2.76% |
| Ethanol |
-17.62% |
| Heating Oil |
-6.10% |
| Natural Gas |
-7.90% |
| RBOB Gasoline |
-7.91% |
| WTI Crude Oil |
-2.38% |
| Metals |
| Copper |
+1.74% |
| Gold 100oz |
+2.04% |
| Palladium |
-0.44% |
| Platinum |
+1.89% |
| Silver 5000oz |
+5.19% |
| Agricultural |
| Cattle |
-2.85% |
| Coffee (Robusta) |
-2.81% |
| White Sugar |
-2.95% |
| Corn |
+1.46% |
| Sugar #11 |
-2.89% |
| Cocoa |
+3.07% |
| Lean Hogs |
-3.27% |
| Lumber |
+2.64% |
| Soybean Meal |
+1.38% |
| Wheat |
+5.19% |
| Coffee (Arabica) |
-4.20% |
| Cotton |
-0.96% |
| Feeder Cattle |
+1.23% |
| Orange Juice |
-2.05% |
| Soybeans |
+2.17% |
Credit Indices
| Index |
Change |
| Markit CDX EM |
-0.96% |
| Markit CDX NA HY |
-0.21% |
| Markit CDX NA IG |
+1.16% |
| Markit iTraxx Asia ex-Japan IG |
+0.70% |
| Markit iTraxx Australia |
+0.11% |
| Markit iTraxx Europe |
-1.46% |
| Markit iTraxx Europe Crossover |
-2.94% |
| Markit iTraxx Japan |
-2.13% |
| Markit iTraxx SovX Western Europe |
-0.97% |
| Markit LCDX (Loan CDS) |
+0.08% |
| Markit MCDX (Municipal CDS) |
+1.07% |
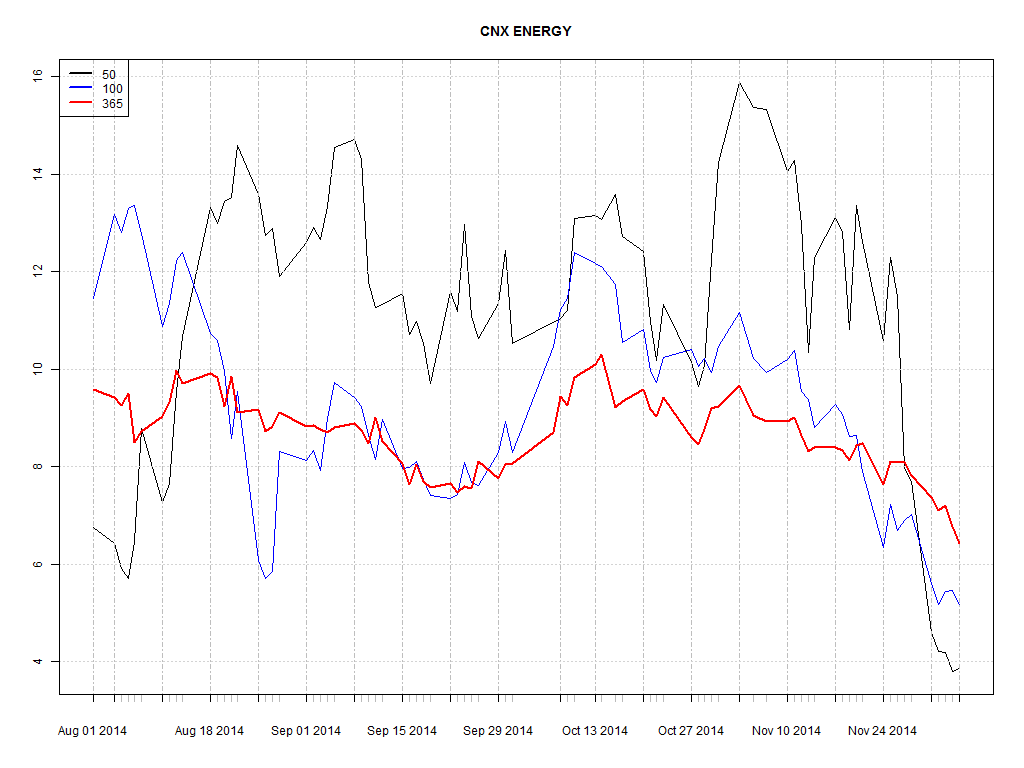
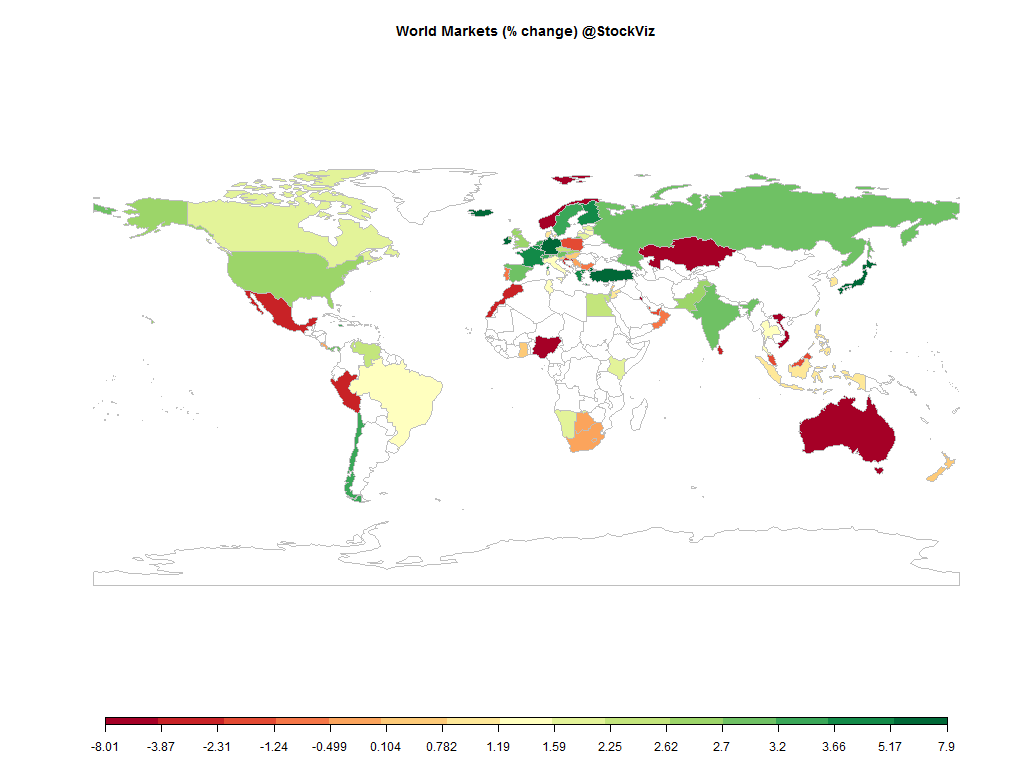
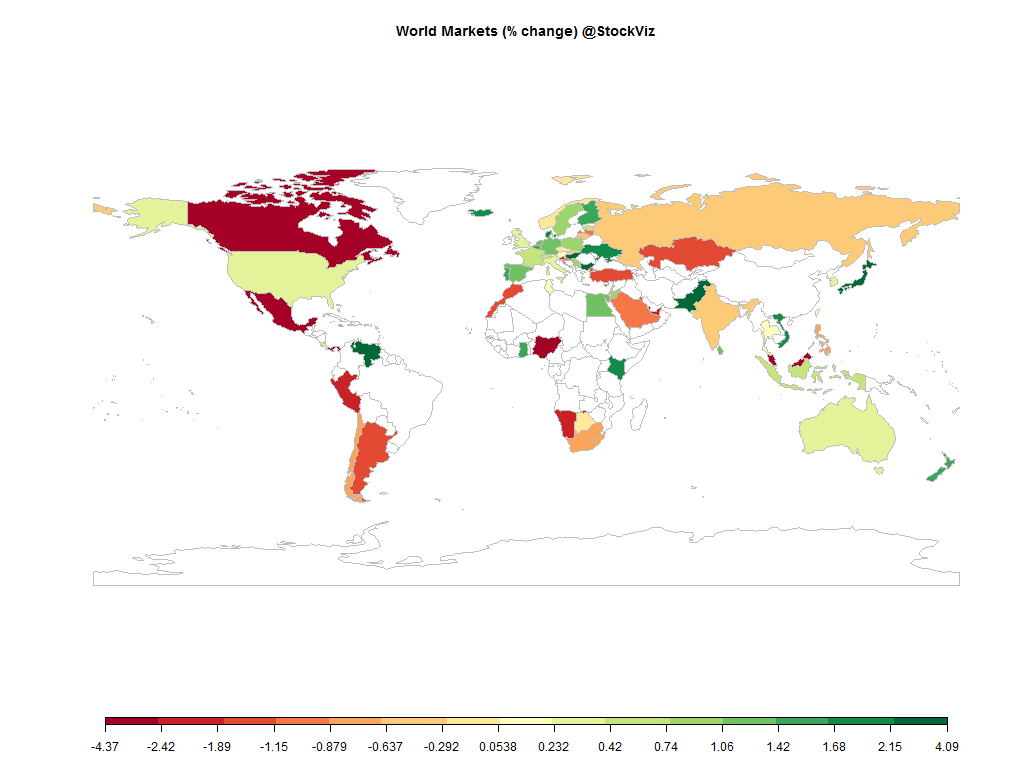
The ECB did not announce the sovereign QE that everybody hoped for. Oil continued to tumble. Credit spreads seem to be sending out warning signals. The dollar rally continued, especially against oil producing currencies. Metals caught a breather.
Oil

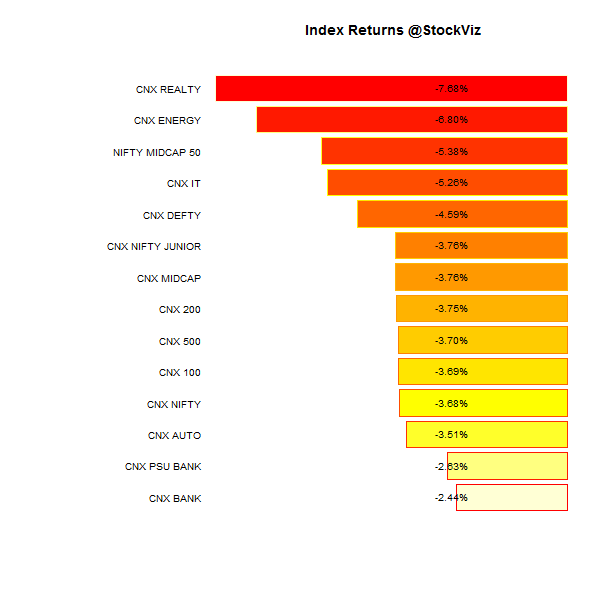
Index Returns
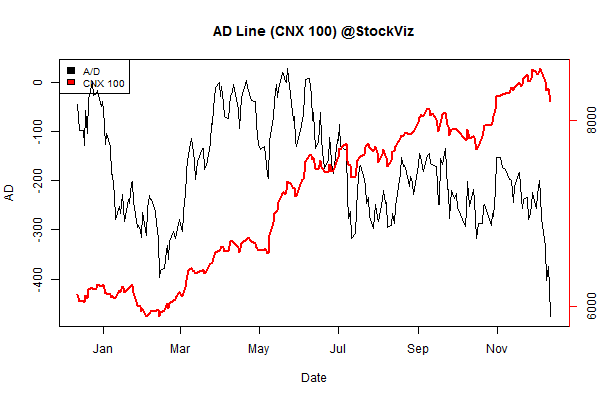
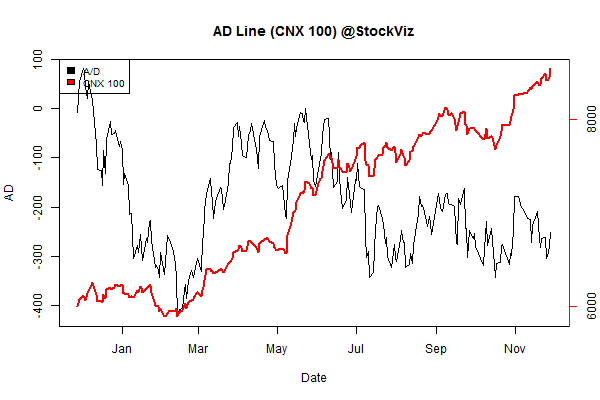
Advance Decline
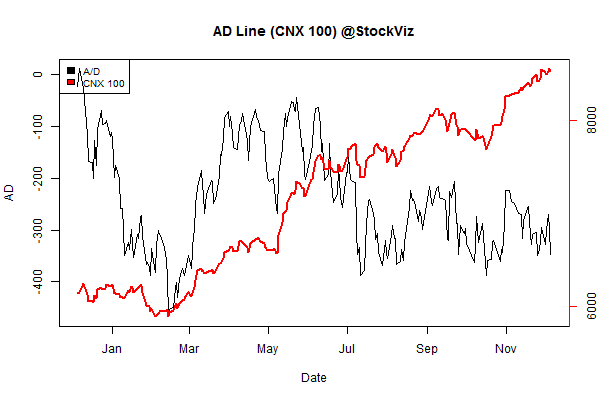
Market Cap Decile Performance
| Decile |
Mkt. Cap. |
Adv/Decl |
| 1 (micro) |
-0.09% |
72/68 |
| 2 |
+1.65% |
68/72 |
| 3 |
+2.01% |
69/71 |
| 4 |
+1.81% |
69/70 |
| 5 |
+1.60% |
69/71 |
| 6 |
+1.34% |
74/66 |
| 7 |
+2.57% |
72/68 |
| 8 |
+2.78% |
79/61 |
| 9 |
+2.26% |
76/64 |
| 10 (mega) |
+0.03% |
75/65 |
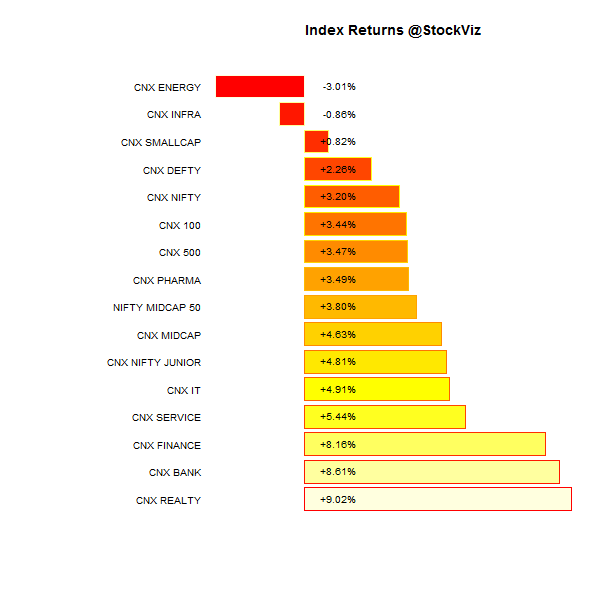
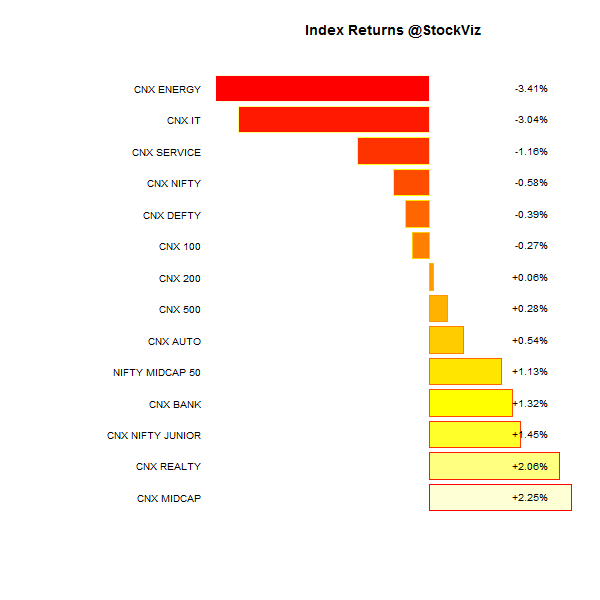
Midcaps outperformed large caps…
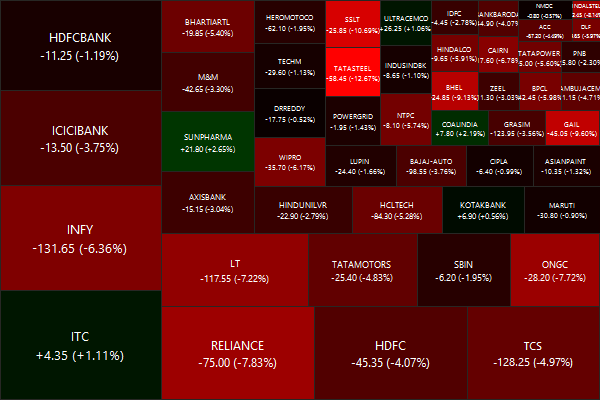
Top Winners and Losers
SAIL turned out to be a classic value trap – moats eroded and its largest investor axed to get rid of it…
ETF Performance
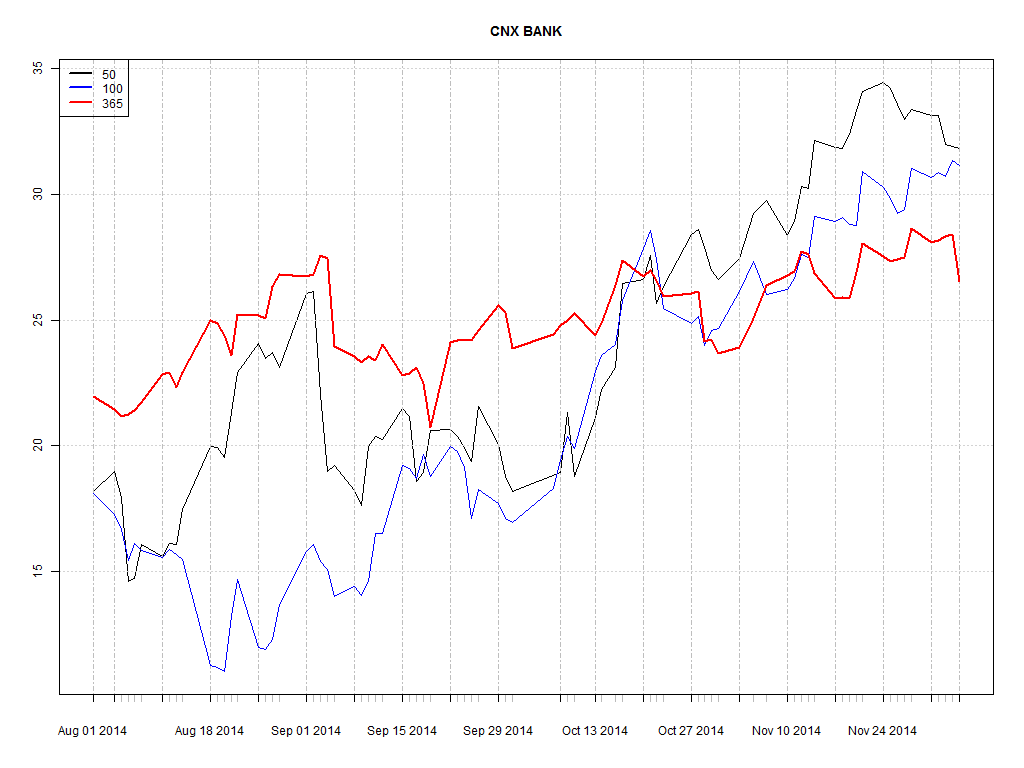
The rally in banking stocks continued, outperforming the Nifty…
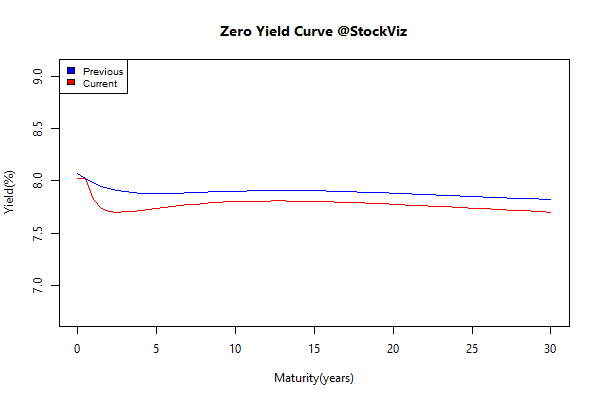
Yield Curve
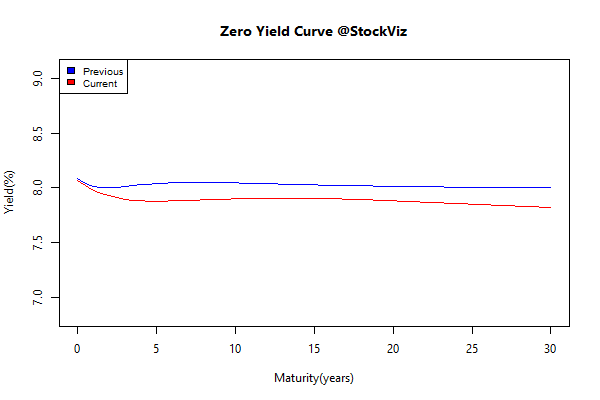
Bond Indices
| Sub Index |
Change in YTM |
Total Return(%) |
| GSEC TB |
-0.15 |
+0.19% |
| GSEC SUB 1-3 |
-0.08 |
+0.43% |
| GSEC SUB 3-8 |
-0.16 |
+0.67% |
| GSEC SUB 8 |
-0.19 |
+1.48% |
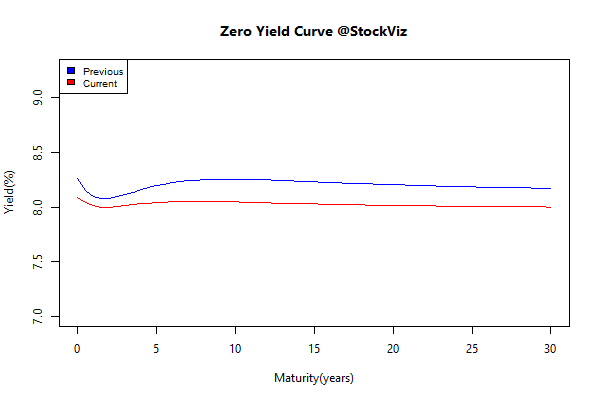
The long bond continued to post gains – falling inflation and rate cuts backed in.
Investment Theme Performance
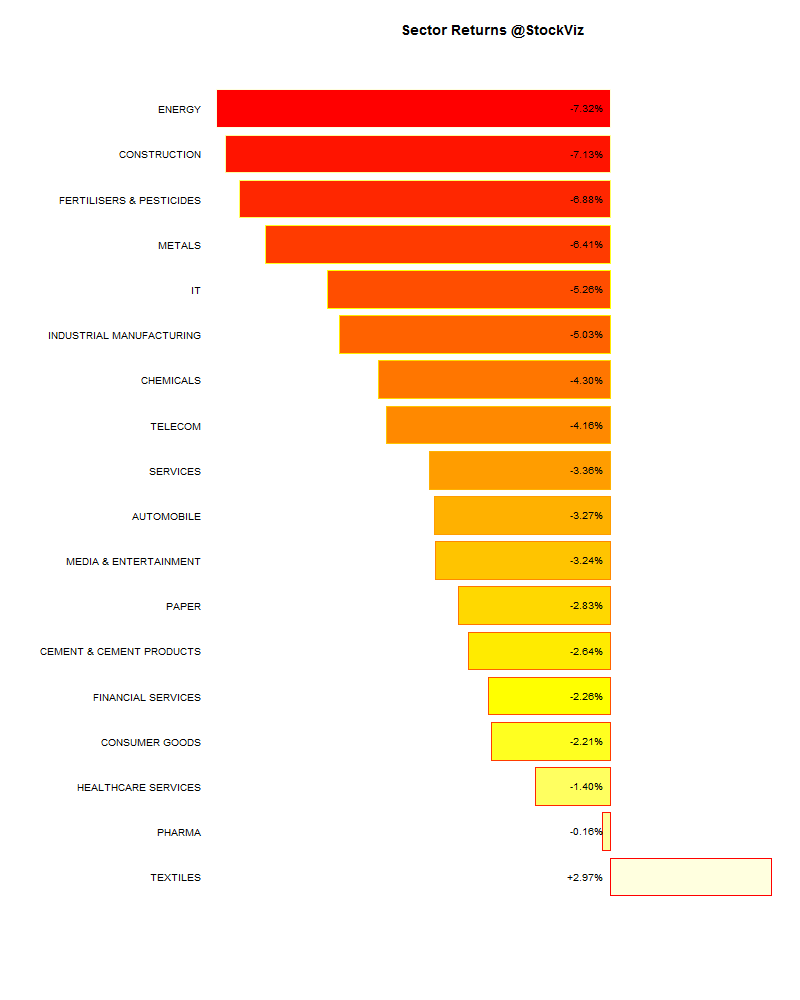
Value is back after a month long period of under-performance. Momentum 200 now references 20 stocks to reduce volatility.
Thought for the weekend
When people invest in lower-risk strategies, what they are really buying is the perception of lower risk. Risk is like the air in a long balloon, with the result that when anyone tries to squeeze it away in one area they only succeed in redistributing it – and building up extra pressure – elsewhere.
Thus, if investors are seeking to reduce the volatility of earning streams by buying certain businesses then all they are doing is increasing their risk elsewhere – namely in the elevated valuations they are now having to pay.
When one looks at valuations and the fact so many people are so worried about all the different risks they see in the world has led to risk itself being lowly valued. Ironically enough, one of the cheapest things you can find in the market these days and therefore with a reduced level of valuation risk… is risk.
Source: Why investors are wrong to think they can eliminate risk completely
Related: Risk, Volatility and Returns
