Your world at 9am
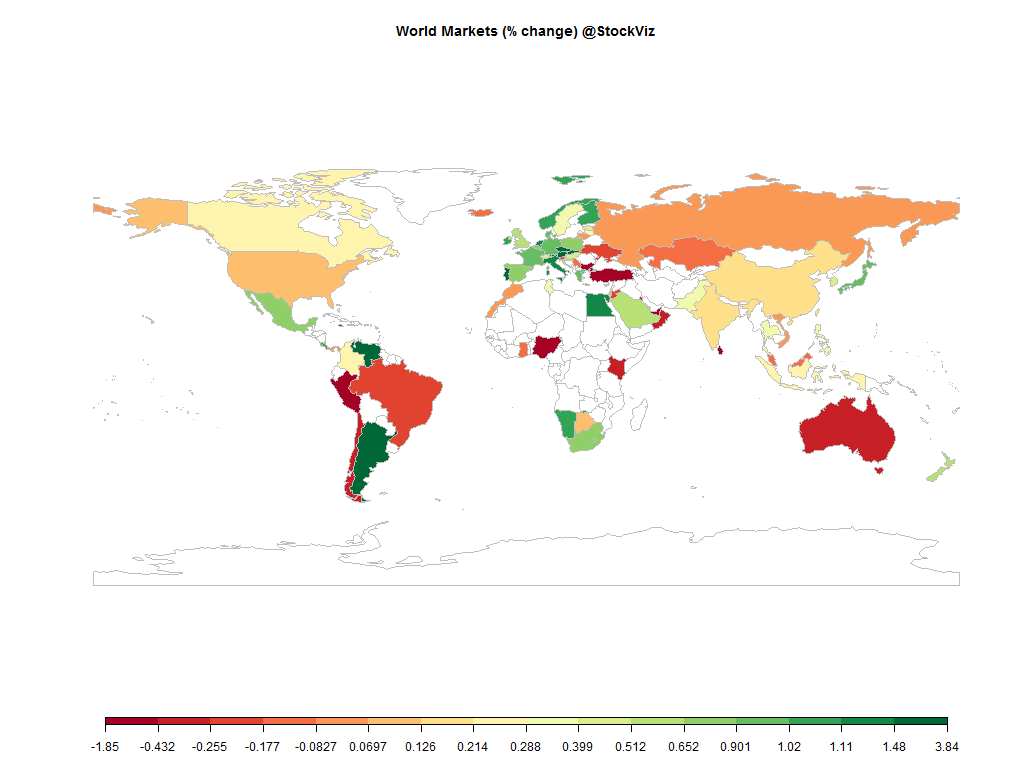
Equities
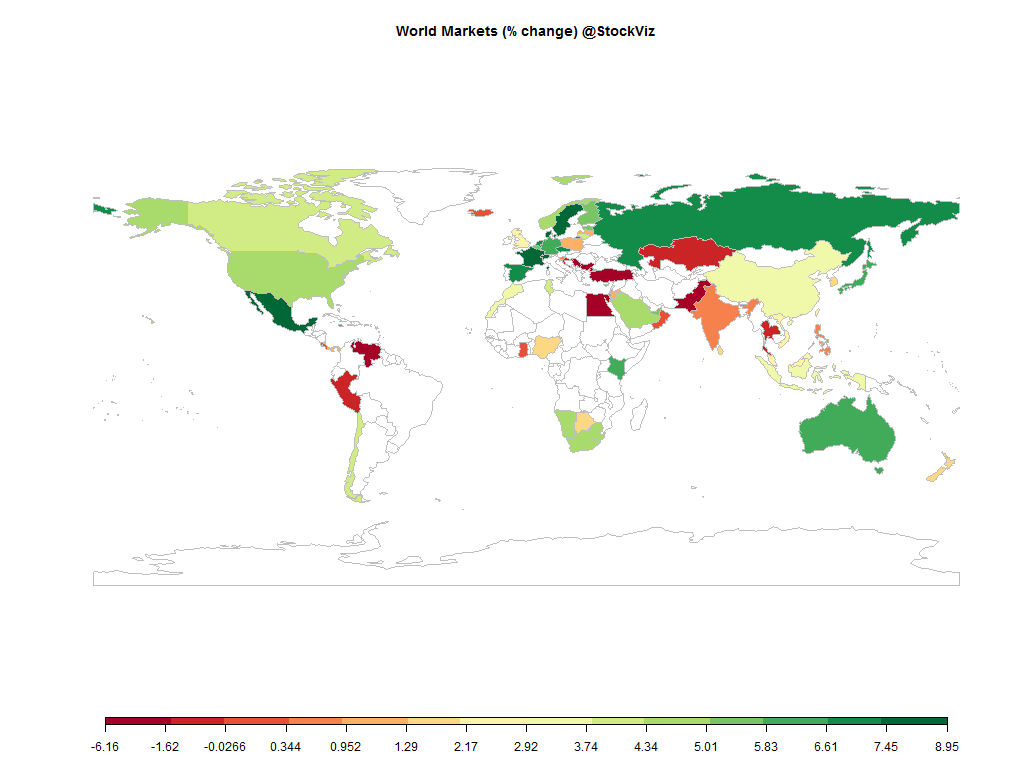
| MINTs | |
|---|---|
| JCI(IDN) | +0.22% |
| INMEX(MEX) | +0.79% |
| NGSEINDX(NGA) | -0.82% |
| XU030(TUR) | -1.85% |
| BRICS | |
|---|---|
| IBOV(BRA) | -0.20% |
| SHCOMP(CHN) | +0.13% |
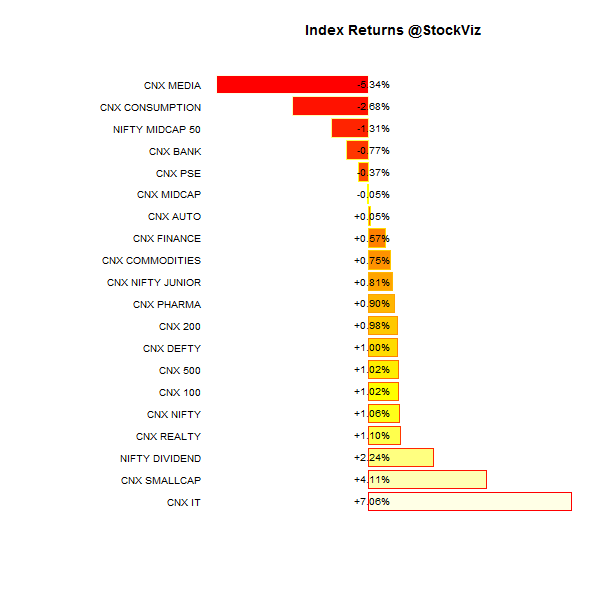
| NIFTY(IND) | +0.17% |
| INDEXCF(RUS) | +0.07% |
| TOP40(ZAF) | +0.77% |
Commodities
| Energy | |
|---|---|
| Brent Crude Oil | +0.86% |
| Ethanol | +0.00% |
| Heating Oil | +0.54% |
| Natural Gas | -0.32% |
| RBOB Gasoline | +0.66% |
| WTI Crude Oil | +0.61% |
| Metals | |
|---|---|
| Copper | +0.00% |
| Gold 100oz | +0.00% |
| Palladium | +0.42% |
| Platinum | +0.07% |
| Silver 5000oz | +0.24% |
Currencies
| MINTs | |
|---|---|
| USDIDR(IDN) | +0.03% |
| USDMXN(MEX) | -0.02% |
| USDNGN(NGA) | +0.00% |
| USDTRY(TUR) | -0.08% |
| BRICS | |
|---|---|
| USDBRL(BRA) | +0.78% |
| USDCNY(CHN) | -0.03% |
| USDINR(IND) | -0.15% |
| USDRUB(RUS) | -0.28% |
| USDZAR(ZAF) | -0.23% |
| Agricultural | |
|---|---|
| Cattle | +0.00% |
| Cocoa | +0.00% |
| Coffee (Arabica) | -0.48% |
| Coffee (Robusta) | +0.00% |
| Corn | -0.26% |
| Cotton | +0.00% |
| Feeder Cattle | +0.00% |
| Lean Hogs | +0.00% |
| Lumber | +0.00% |
| Orange Juice | +0.00% |
| Soybean Meal | -0.12% |
| Soybeans | +0.10% |
| Sugar #11 | +0.60% |
| Wheat | +0.00% |
| White Sugar | +0.00% |
Must reads
ECB will buy bonds that carry a negative yield, as long as that doesn’t fall below the rate it charges banks on deposits, which is -0.20%. (WSJ)
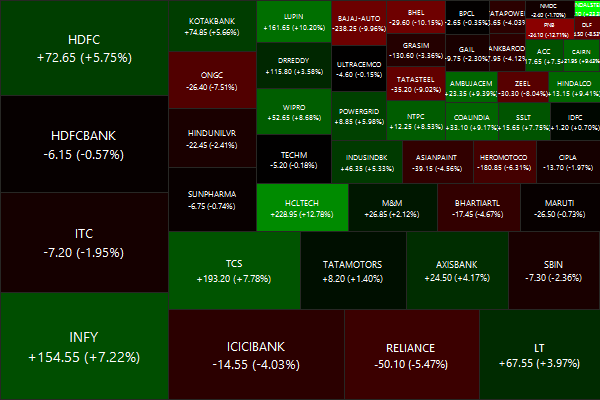
Infosys and Wipro in fight to renew Rs 12,000 crore outsourcing contract that will expire this year. Last time around, HCL Tech ate their lunch. (ET) [stockquote]HCLTECH[/stockquote] [stockquote]INFY[/stockquote] [stockquote]WIPRO[/stockquote]
Will we soon have FDI in retail? (LiveMint)
Indian GDP numbers: did bureaucrats take something that was not broken and fix it until it was? (FT)
EPFO will once again consider diversifying its investment pattern to park 5-15% of its corpus in equity and infrastructure trusts. (ET)
Goldman: “The twin forces of regulation and technology are opening the door for an expanding class of competitors to capture profit pools long controlled by banks.” (FT)
Good luck and have a nice long weekend!