Equities
| MINTs | |
|---|---|
| JCI(IDN) | -0.85% |
| INMEX(MEX) | -1.38% |
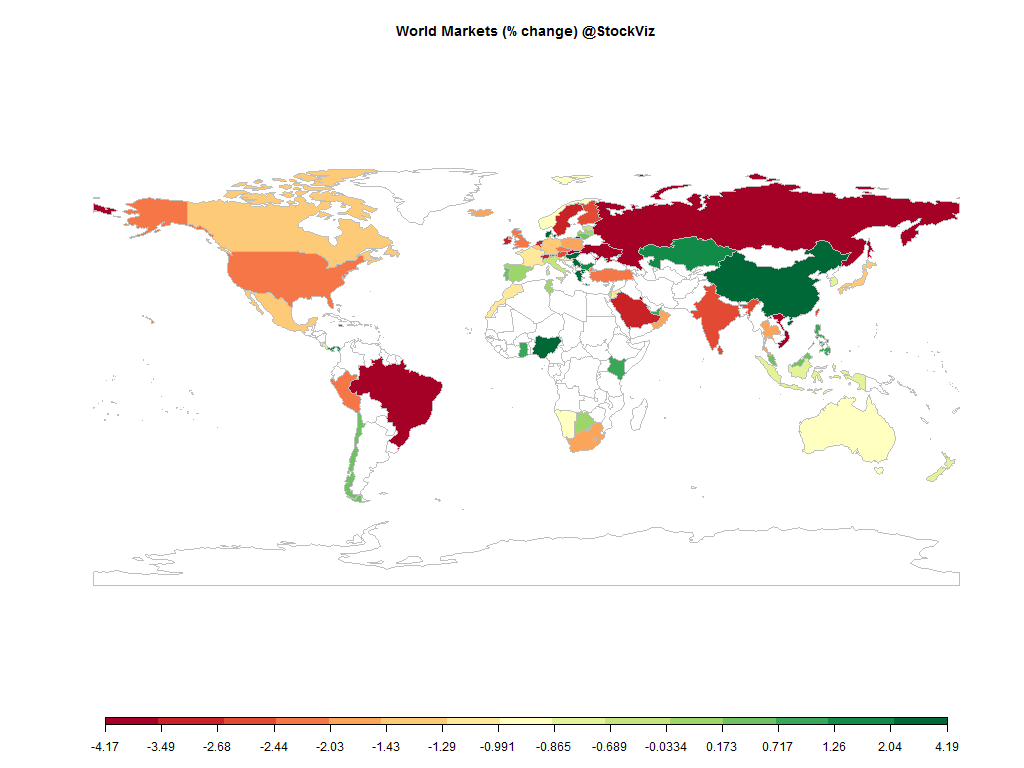
| NGSEINDX(NGA) | +4.19% |
| XU030(TUR) | -2.11% |
| BRICS | |
|---|---|
| IBOV(BRA) | -3.75% |
| SHCOMP(CHN) | +2.04% |
| NIFTY(IND) | -2.68% |
| INDEXCF(RUS) | -3.51% |
| TOP40(ZAF) | -1.96% |
Commodities
| Energy | |
|---|---|
| Ethanol | +0.20% |
| WTI Crude Oil | +5.63% |
| Brent Crude Oil | +2.21% |
| Natural Gas | -4.59% |
| Heating Oil | -0.01% |
| RBOB Gasoline | +0.28% |
| Metals | |
|---|---|
| Copper | -0.36% |
| Gold 100oz | +1.09% |
| Silver 5000oz | +1.19% |
| Palladium | -5.09% |
| Platinum | +0.08% |
Currencies
| MINTs | |
|---|---|
| USDIDR(IDN) | -0.45% |
| USDMXN(MEX) | +1.29% |
| USDNGN(NGA) | -0.10% |
| USDTRY(TUR) | +1.33% |
| BRICS | |
|---|---|
| USDBRL(BRA) | +0.48% |
| USDCNY(CHN) | +0.18% |
| USDINR(IND) | -0.08% |
| USDRUB(RUS) | -2.49% |
| USDZAR(ZAF) | +0.06% |
| Agricultural | |
|---|---|
| Cattle | +2.56% |
| Corn | +1.36% |
| Feeder Cattle | +1.78% |
| Wheat | -4.05% |
| Cotton | +0.92% |
| Soybeans | -0.46% |
| Sugar #11 | -4.65% |
| White Sugar | -1.91% |
| Coffee (Arabica) | -3.53% |
| Coffee (Robusta) | -0.66% |
| Lumber | +0.28% |
| Soybean Meal | -0.68% |
| Cocoa | -1.29% |
| Lean Hogs | +4.79% |
| Orange Juice | +10.93% |
Credit Indices
| Index | Change |
|---|---|
| Markit CDX EM | +0.62% |
| Markit CDX NA HY | +0.09% |
| Markit CDX NA IG | +0.79% |
| Markit iTraxx Asia ex-Japan IG | -1.54% |
| Markit iTraxx Australia | -0.45% |
| Markit iTraxx Europe | -1.36% |
| Markit iTraxx Europe Crossover | -1.06% |
| Markit iTraxx Japan | -1.24% |
| Markit iTraxx SovX Western Europe | -0.42% |
| Markit LCDX (Loan CDS) | +0.00% |
| Markit MCDX (Municipal CDS) | +1.48% |
It was a sea of red ink in the markets this week. Oil gyrated and the US Dollar ended mixed.
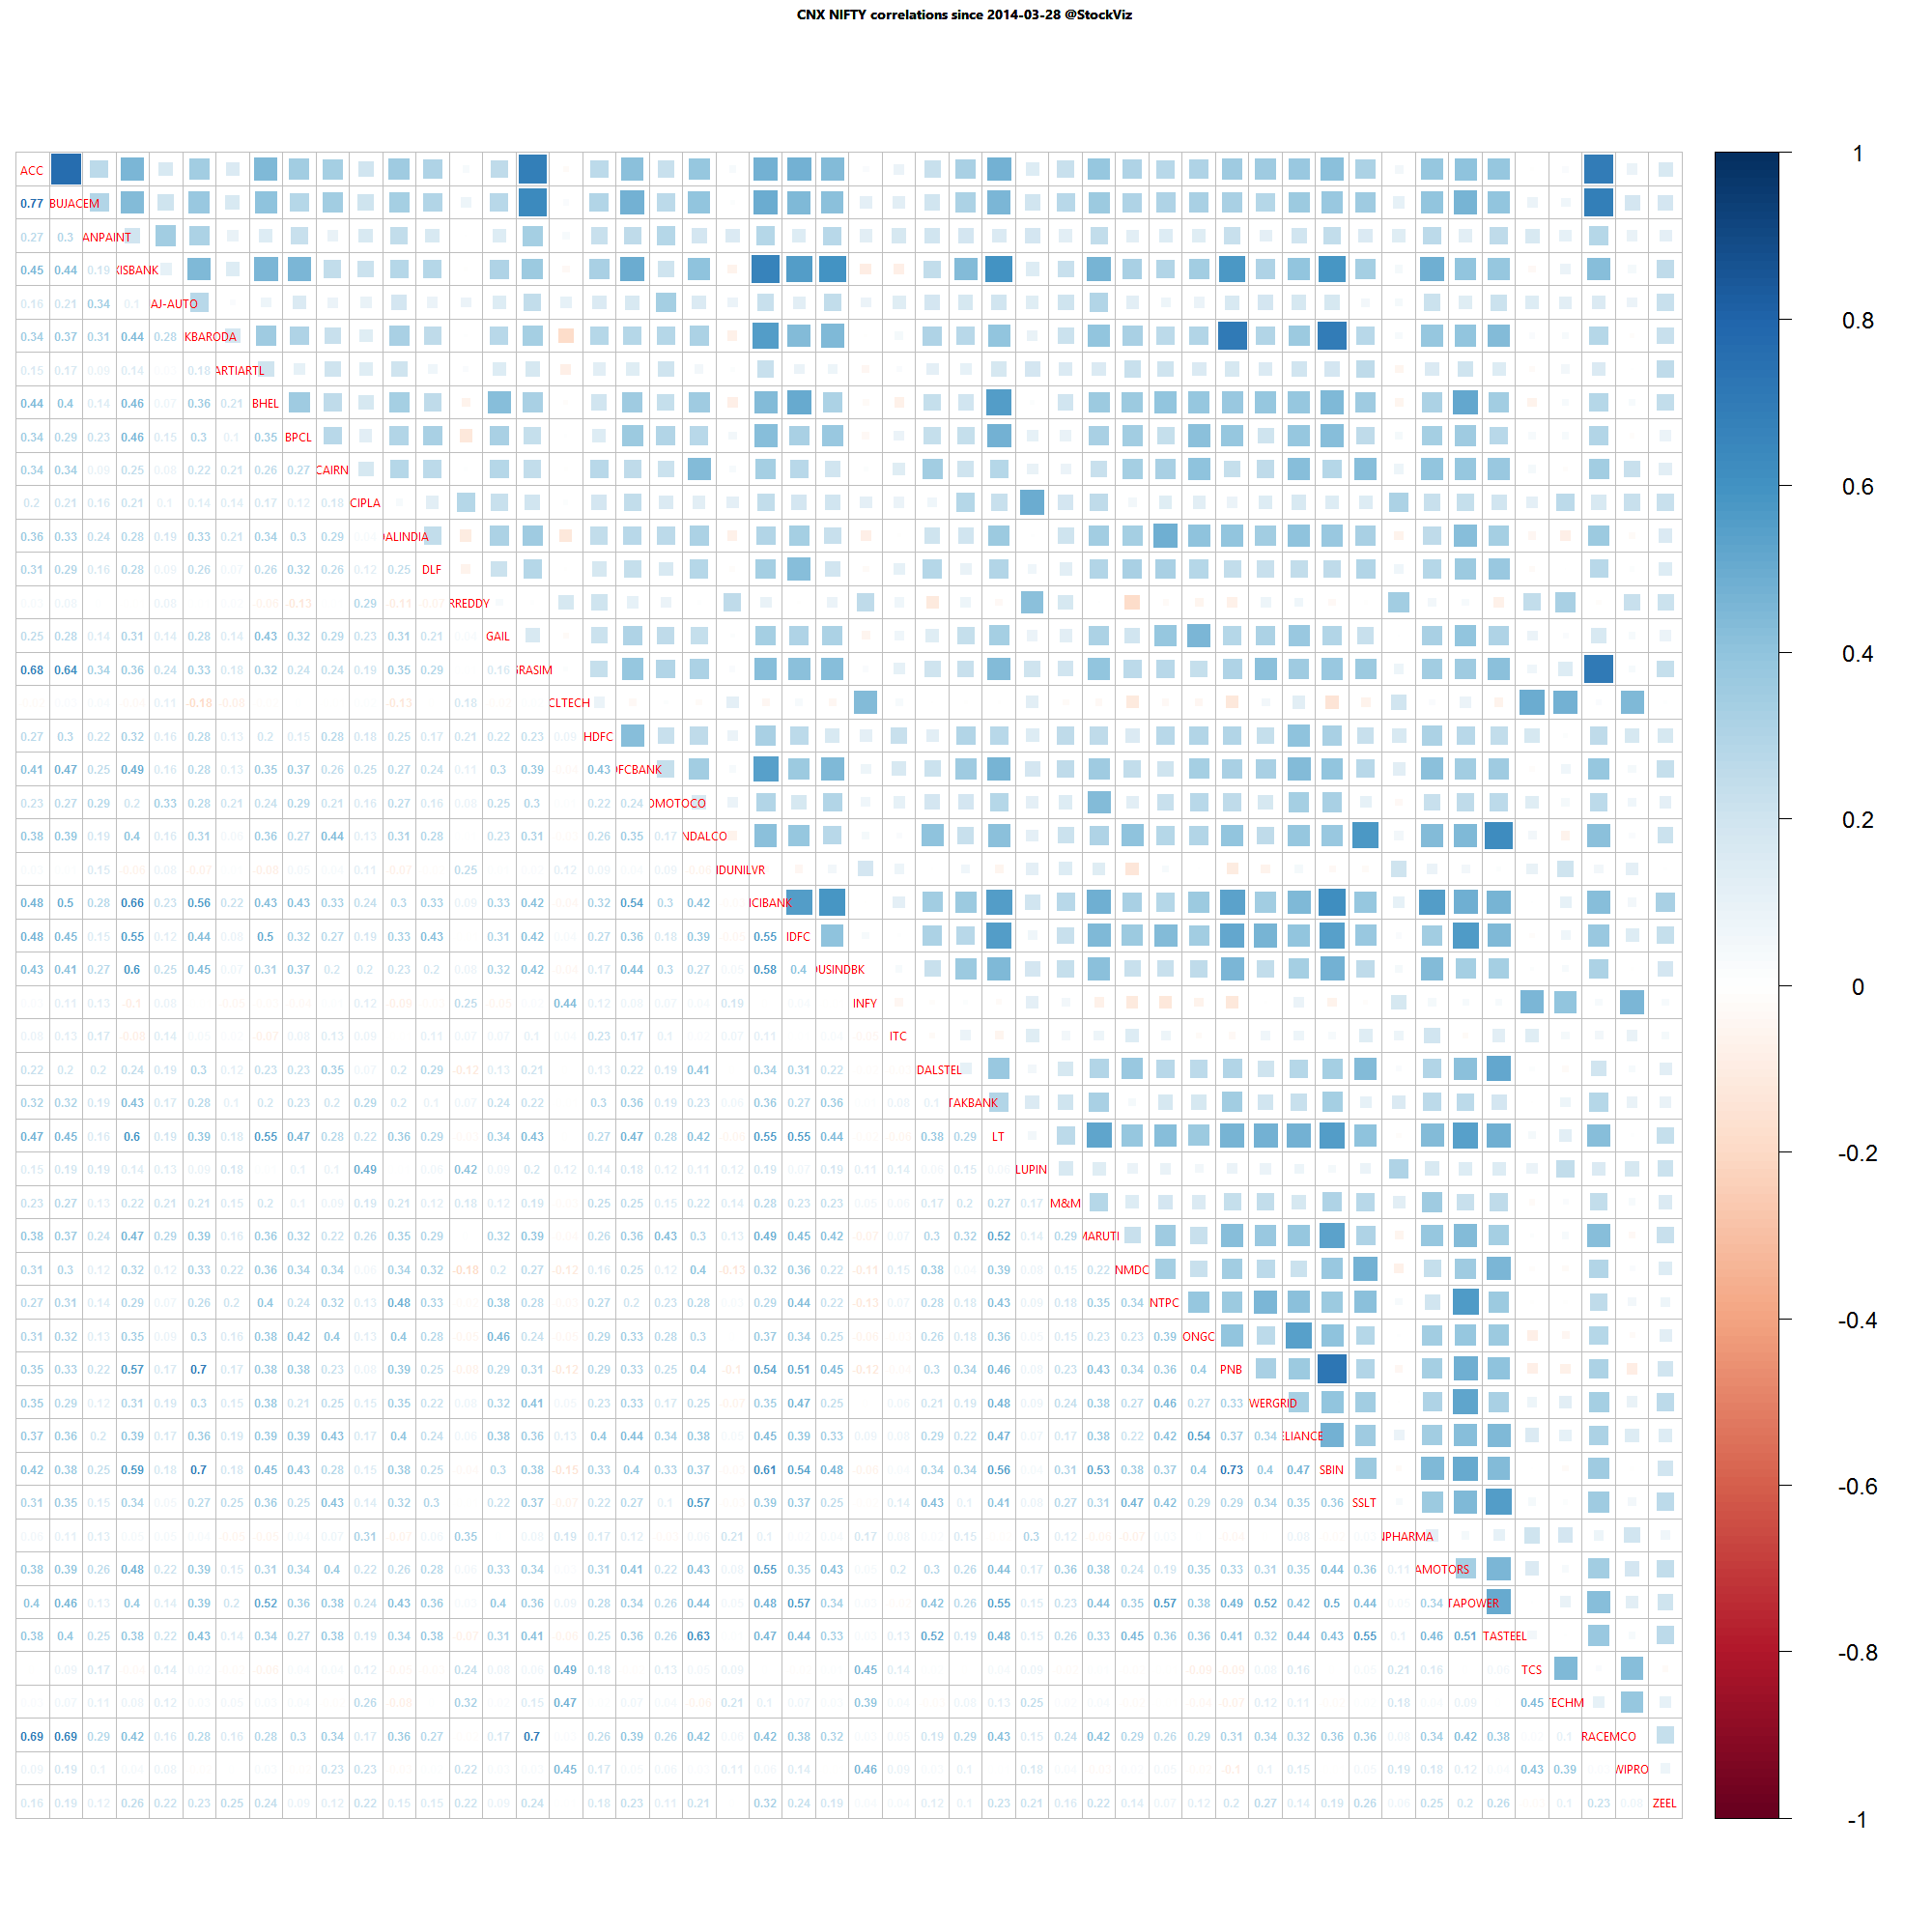
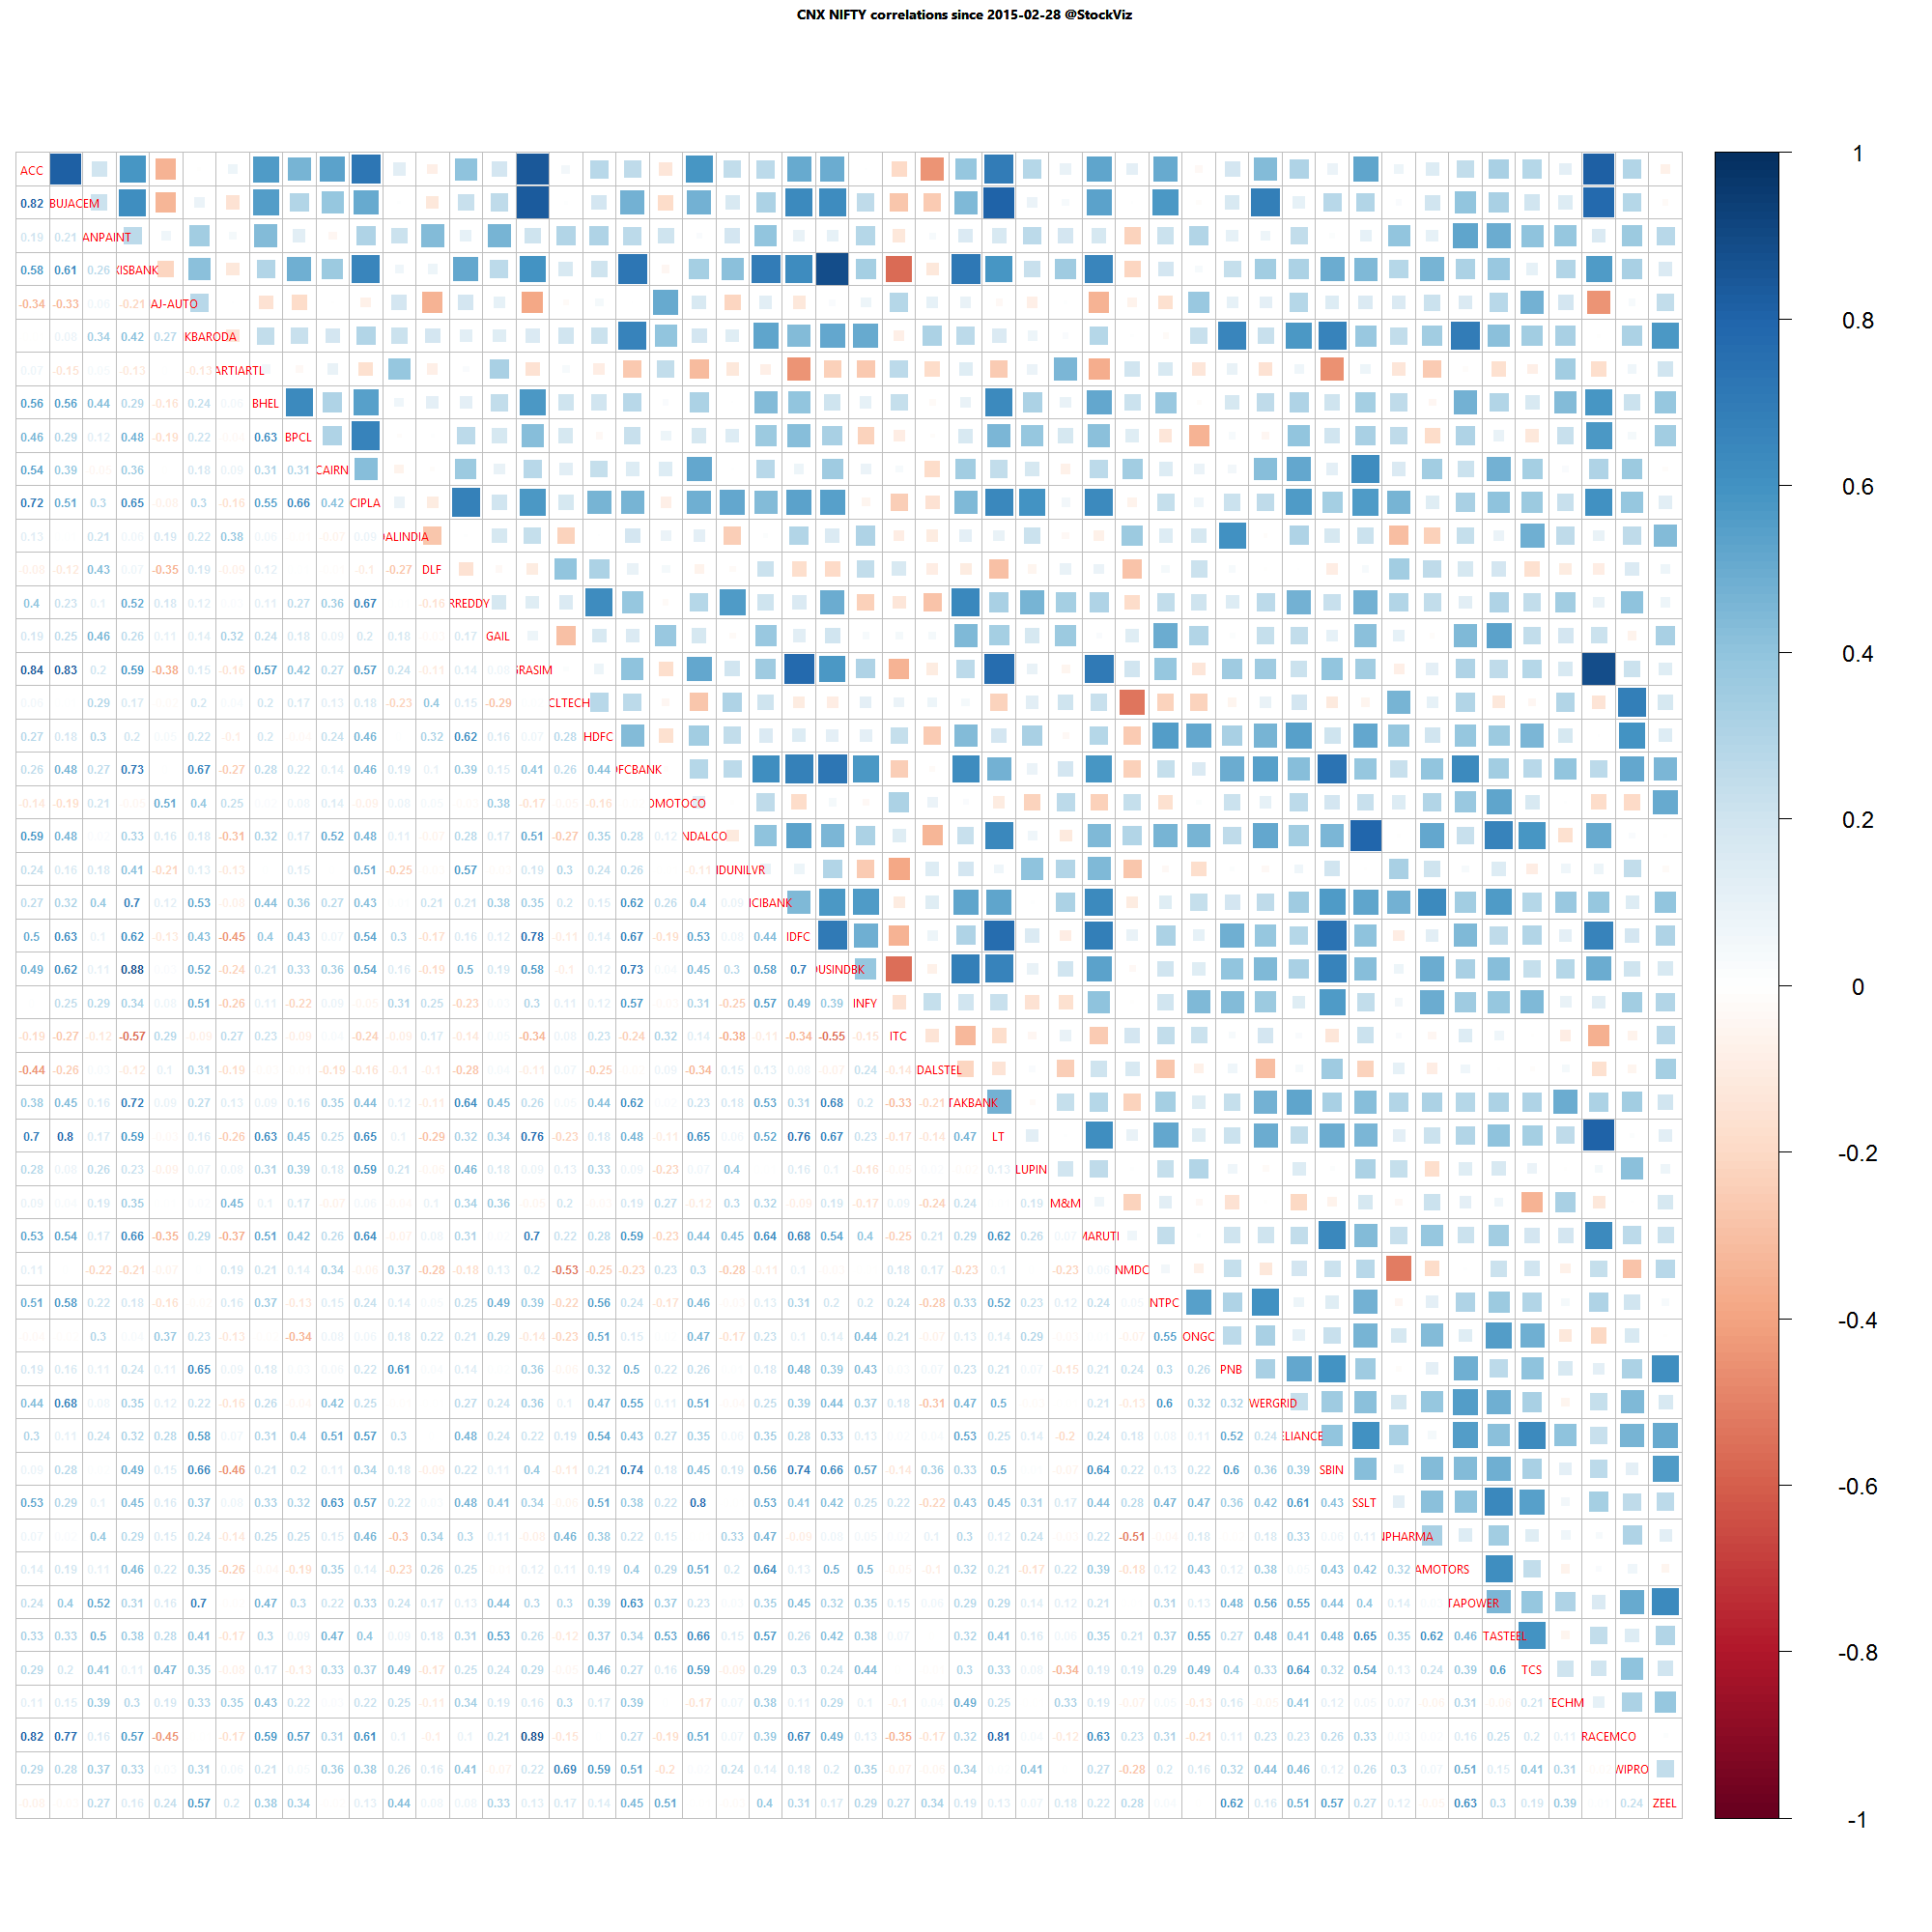
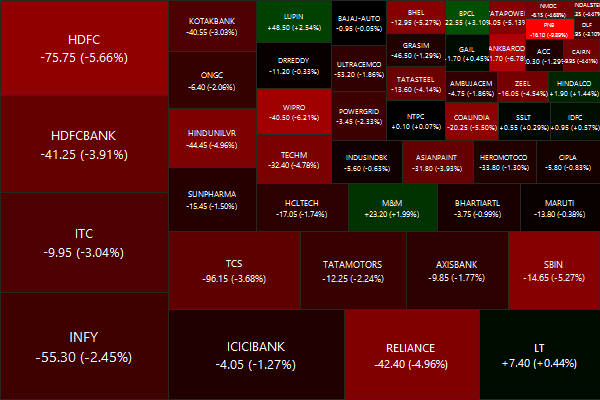
Nifty Heatmap
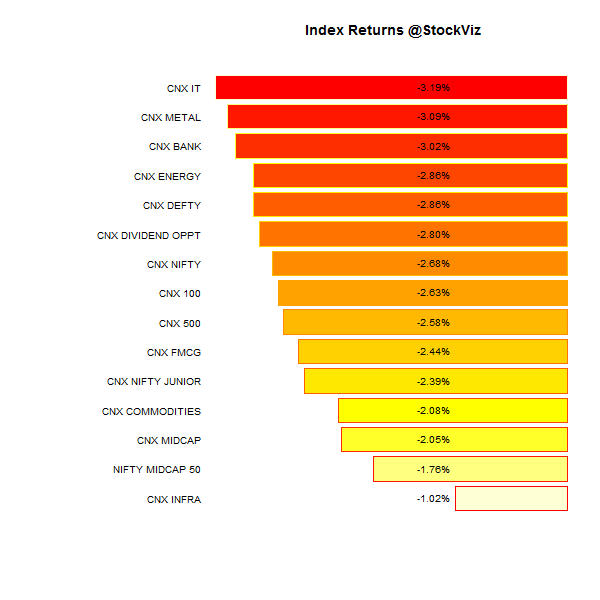
Index Returns
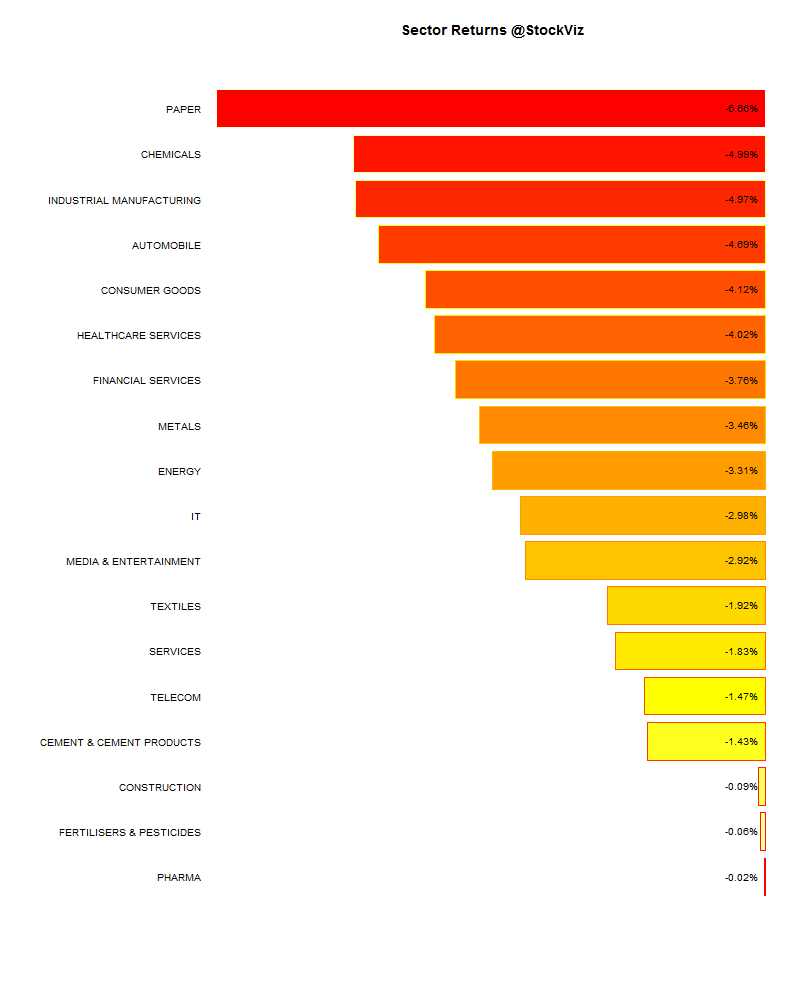
Sector Performance
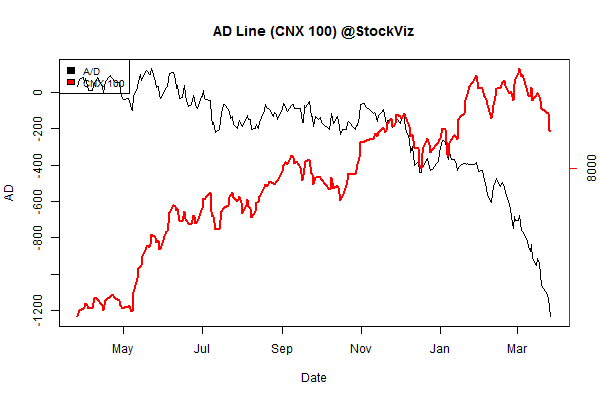
Advance Decline
Market Cap Decile Performance
| Decile | Mkt. Cap. | Adv/Decl |
|---|---|---|
| 1 (micro) | -12.20% | 58/76 |
| 2 | -8.87% | 52/81 |
| 3 | -7.74% | 50/83 |
| 4 | -7.73% | 52/81 |
| 5 | -6.92% | 54/79 |
| 6 | -6.81% | 57/77 |
| 7 | -5.57% | 47/86 |
| 8 | -5.34% | 56/77 |
| 9 | -3.95% | 62/71 |
| 10 (mega) | -3.40% | 68/66 |
Stocks across the board got shellacked…
Top Winners and Losers
| BPCL | +3.10% |
| AUROPHARMA | +3.97% |
| UPL | +4.30% |
| PNB | -9.89% |
| SRTRANSFIN | -9.15% |
| BOSCHLTD | -7.88% |
Momentum names were hurt the most…
ETF Performance
| GOLDBEES | +1.61% |
| INFRABEES | -1.04% |
| CPSEETF | -2.44% |
| NIFTYBEES | -2.71% |
| BANKBEES | -3.15% |
| JUNIORBEES | -3.24% |
| PSUBNKBEES | -5.50% |
PSU banks are yet to fully acknowledge the full extent of NPAs. Also, who is going to fill the holes in their balance-sheets?
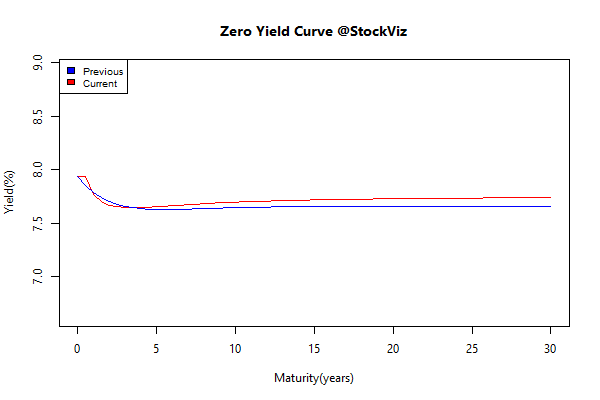
Yield Curve
Bond Indices
| Sub Index | Change in YTM | Total Return(%) |
|---|---|---|
| GSEC TB | +0.35 | +0.03% |
| GSEC SUB 1-3 | +0.38 | -0.33% |
| GSEC SUB 3-8 | +0.12 | -0.80% |
| GSEC SUB 8 | +0.04 | -0.54% |
The long end of the curve came under a bit of pressure…
Investment Theme Performance
| CNX 100 Enterprise Yield | -0.63% |
| Financial Strength Value | -0.88% |
| NSE & BSE Mix | -1.25% |
| Balance Sheet Strength | -1.36% |
| Magic Formula | -2.03% |
| Auto and Consumer Goods Quality to Price | -2.24% |
| PPFAS Long Term Value | -2.92% |
| Tactical CNX 100 | -2.98% |
| Low Volatility | -3.09% |
| ASK Life | -3.15% |
| Momentum | -3.15% |
| Media, Health, IT, Telecom, Services, Pharma Quality To Price | -3.38% |
| High Beta | -3.80% |
| Next Trillion | -4.07% |
| ADAG stocks | -4.08% |
| Quality to Price | -4.12% |
| Textile, Metals, Chemicals, Paper and Energy Quality to Price | -4.37% |
Not a single investment strategy ended the week in the green…
Equity Mutual Funds
Bond Mutual Funds
Thought to sum up the week
Our “experiencing selves” and our “remembering selves” perceive facts differently.