Equities
| MINTs | |
|---|---|
| JCI(IDN) | +0.45% |
| INMEX(MEX) | +2.01% |
| NGSEINDX(NGA) | +1.57% |
| XU030(TUR) | +1.23% |
| BRICS | |
|---|---|
| IBOV(BRA) | +3.42% |
| SHCOMP(CHN) | +5.88% |
| NIFTY(IND) | +2.26% |
| INDEXCF(RUS) | -0.29% |
| TOP40(ZAF) | +2.18% |
Commodities
| Energy | |
|---|---|
| Heating Oil | +1.02% |
| Brent Crude Oil | +1.01% |
| Ethanol | +1.03% |
| Natural Gas | -4.35% |
| RBOB Gasoline | -1.32% |
| WTI Crude Oil | +3.27% |
| Metals | |
|---|---|
| Silver 5000oz | -1.20% |
| Palladium | +3.72% |
| Platinum | +0.60% |
| Copper | -0.36% |
| Gold 100oz | +0.17% |
Currencies
| MINTs | |
|---|---|
| USDIDR(IDN) | -0.93% |
| USDMXN(MEX) | +0.66% |
| USDNGN(NGA) | +0.01% |
| USDTRY(TUR) | +1.17% |
| BRICS | |
|---|---|
| USDBRL(BRA) | -3.03% |
| USDCNY(CHN) | +0.17% |
| USDINR(IND) | -0.28% |
| USDRUB(RUS) | -6.78% |
| USDZAR(ZAF) | +0.07% |
| Agricultural | |
|---|---|
| Sugar #11 | +4.55% |
| Coffee (Arabica) | +1.08% |
| Coffee (Robusta) | +6.95% |
| Corn | -1.18% |
| Feeder Cattle | -3.00% |
| White Sugar | +2.18% |
| Cotton | +3.65% |
| Lean Hogs | -0.53% |
| Lumber | -2.52% |
| Orange Juice | -9.96% |
| Soybean Meal | -6.64% |
| Soybeans | -3.82% |
| Cattle | -1.88% |
| Cocoa | +0.99% |
| Wheat | -0.57% |
Credit Indices
| Index | Change |
|---|---|
| Markit CDX EM | +1.47% |
| Markit CDX NA HY | +0.49% |
| Markit CDX NA IG | -3.14% |
| Markit iTraxx Asia ex-Japan IG | -4.97% |
| Markit iTraxx Australia | -4.50% |
| Markit iTraxx Europe | -0.71% |
| Markit iTraxx Europe Crossover | -11.21% |
| Markit iTraxx Japan | -1.42% |
| Markit iTraxx SovX Western Europe | -0.56% |
| Markit LCDX (Loan CDS) | -0.09% |
| Markit MCDX (Municipal CDS) | -0.14% |
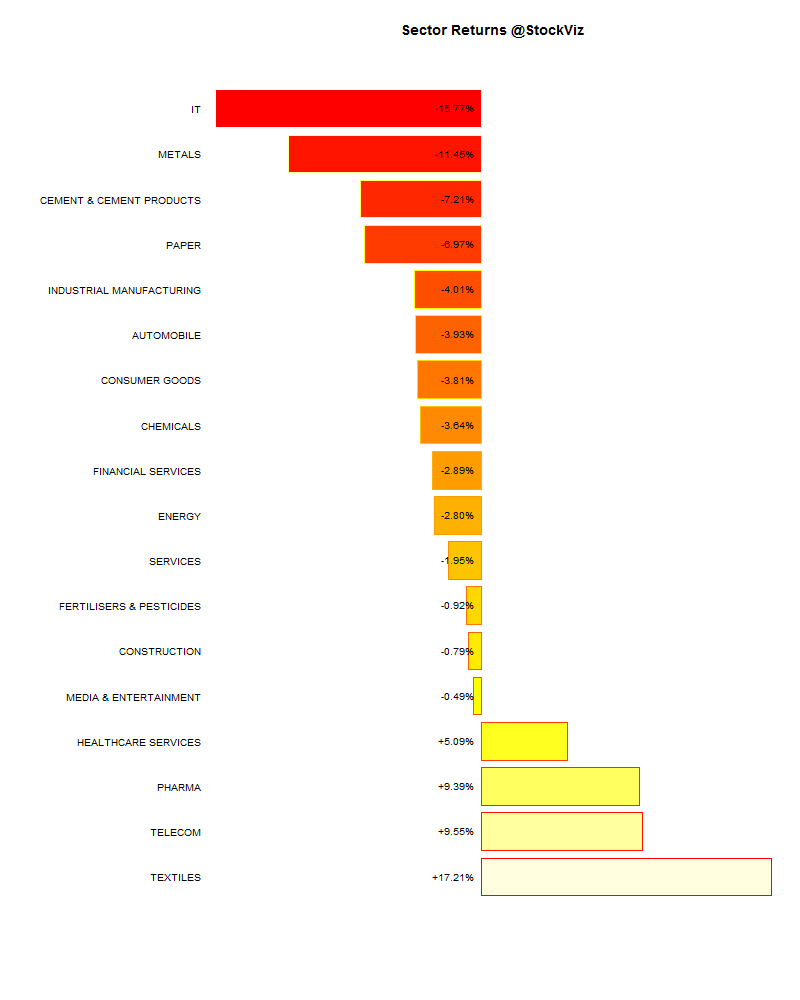
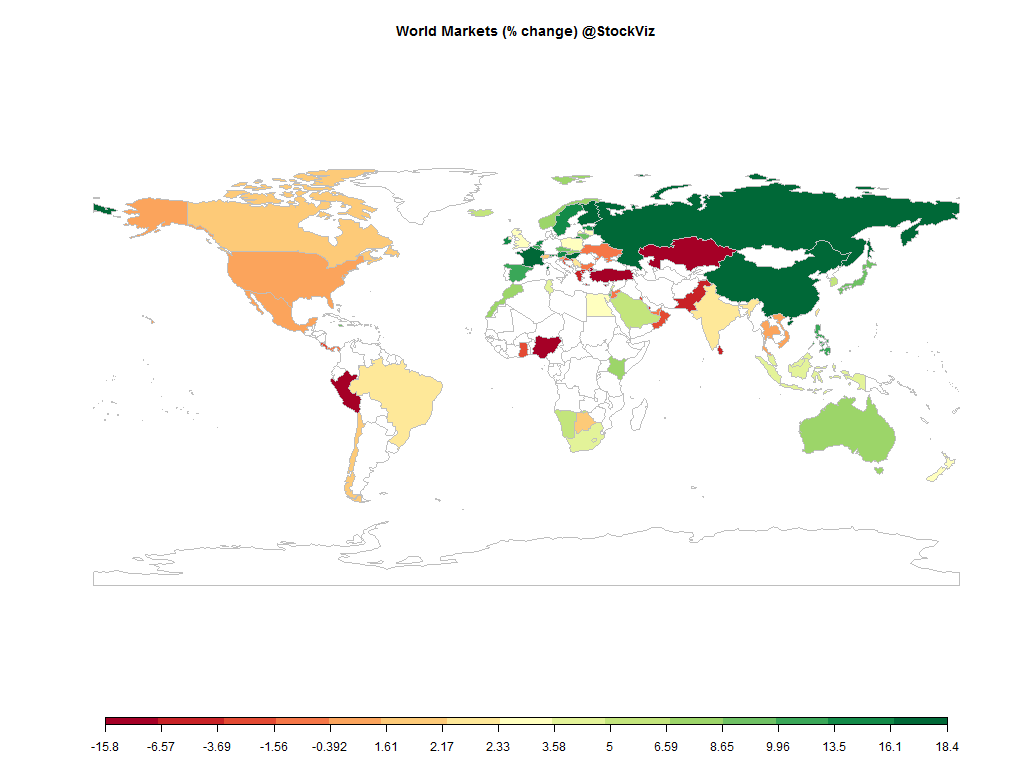
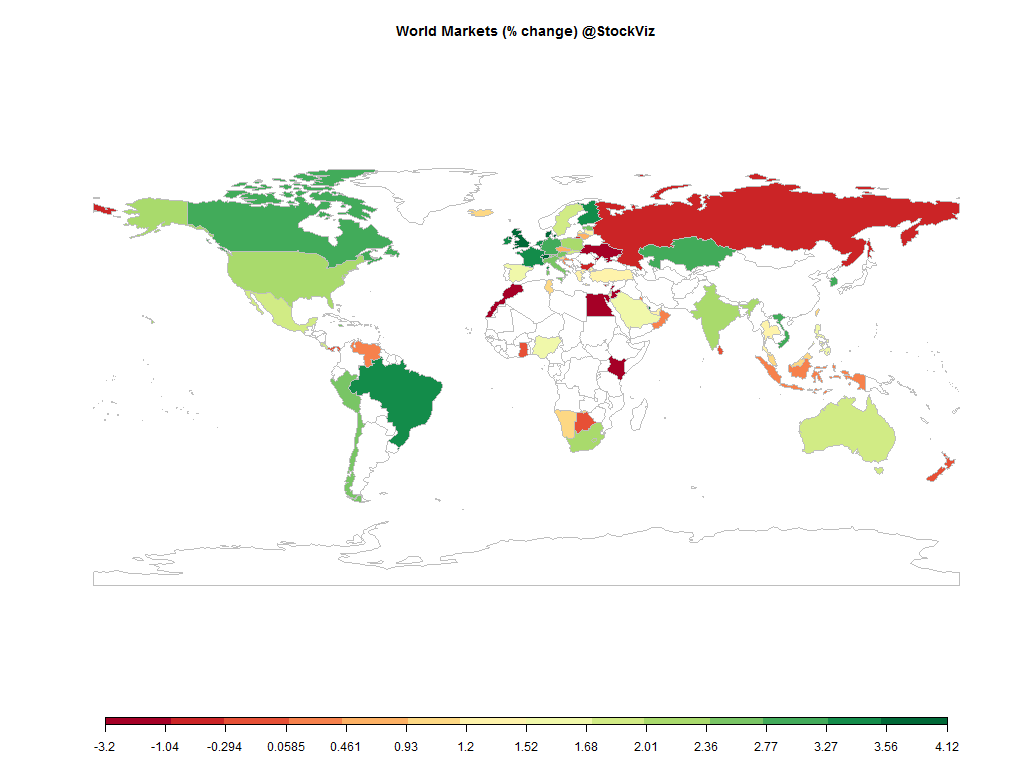
It was a good week for the equity markets. Ruble strength came as a surprise and credit gauges were bullish.
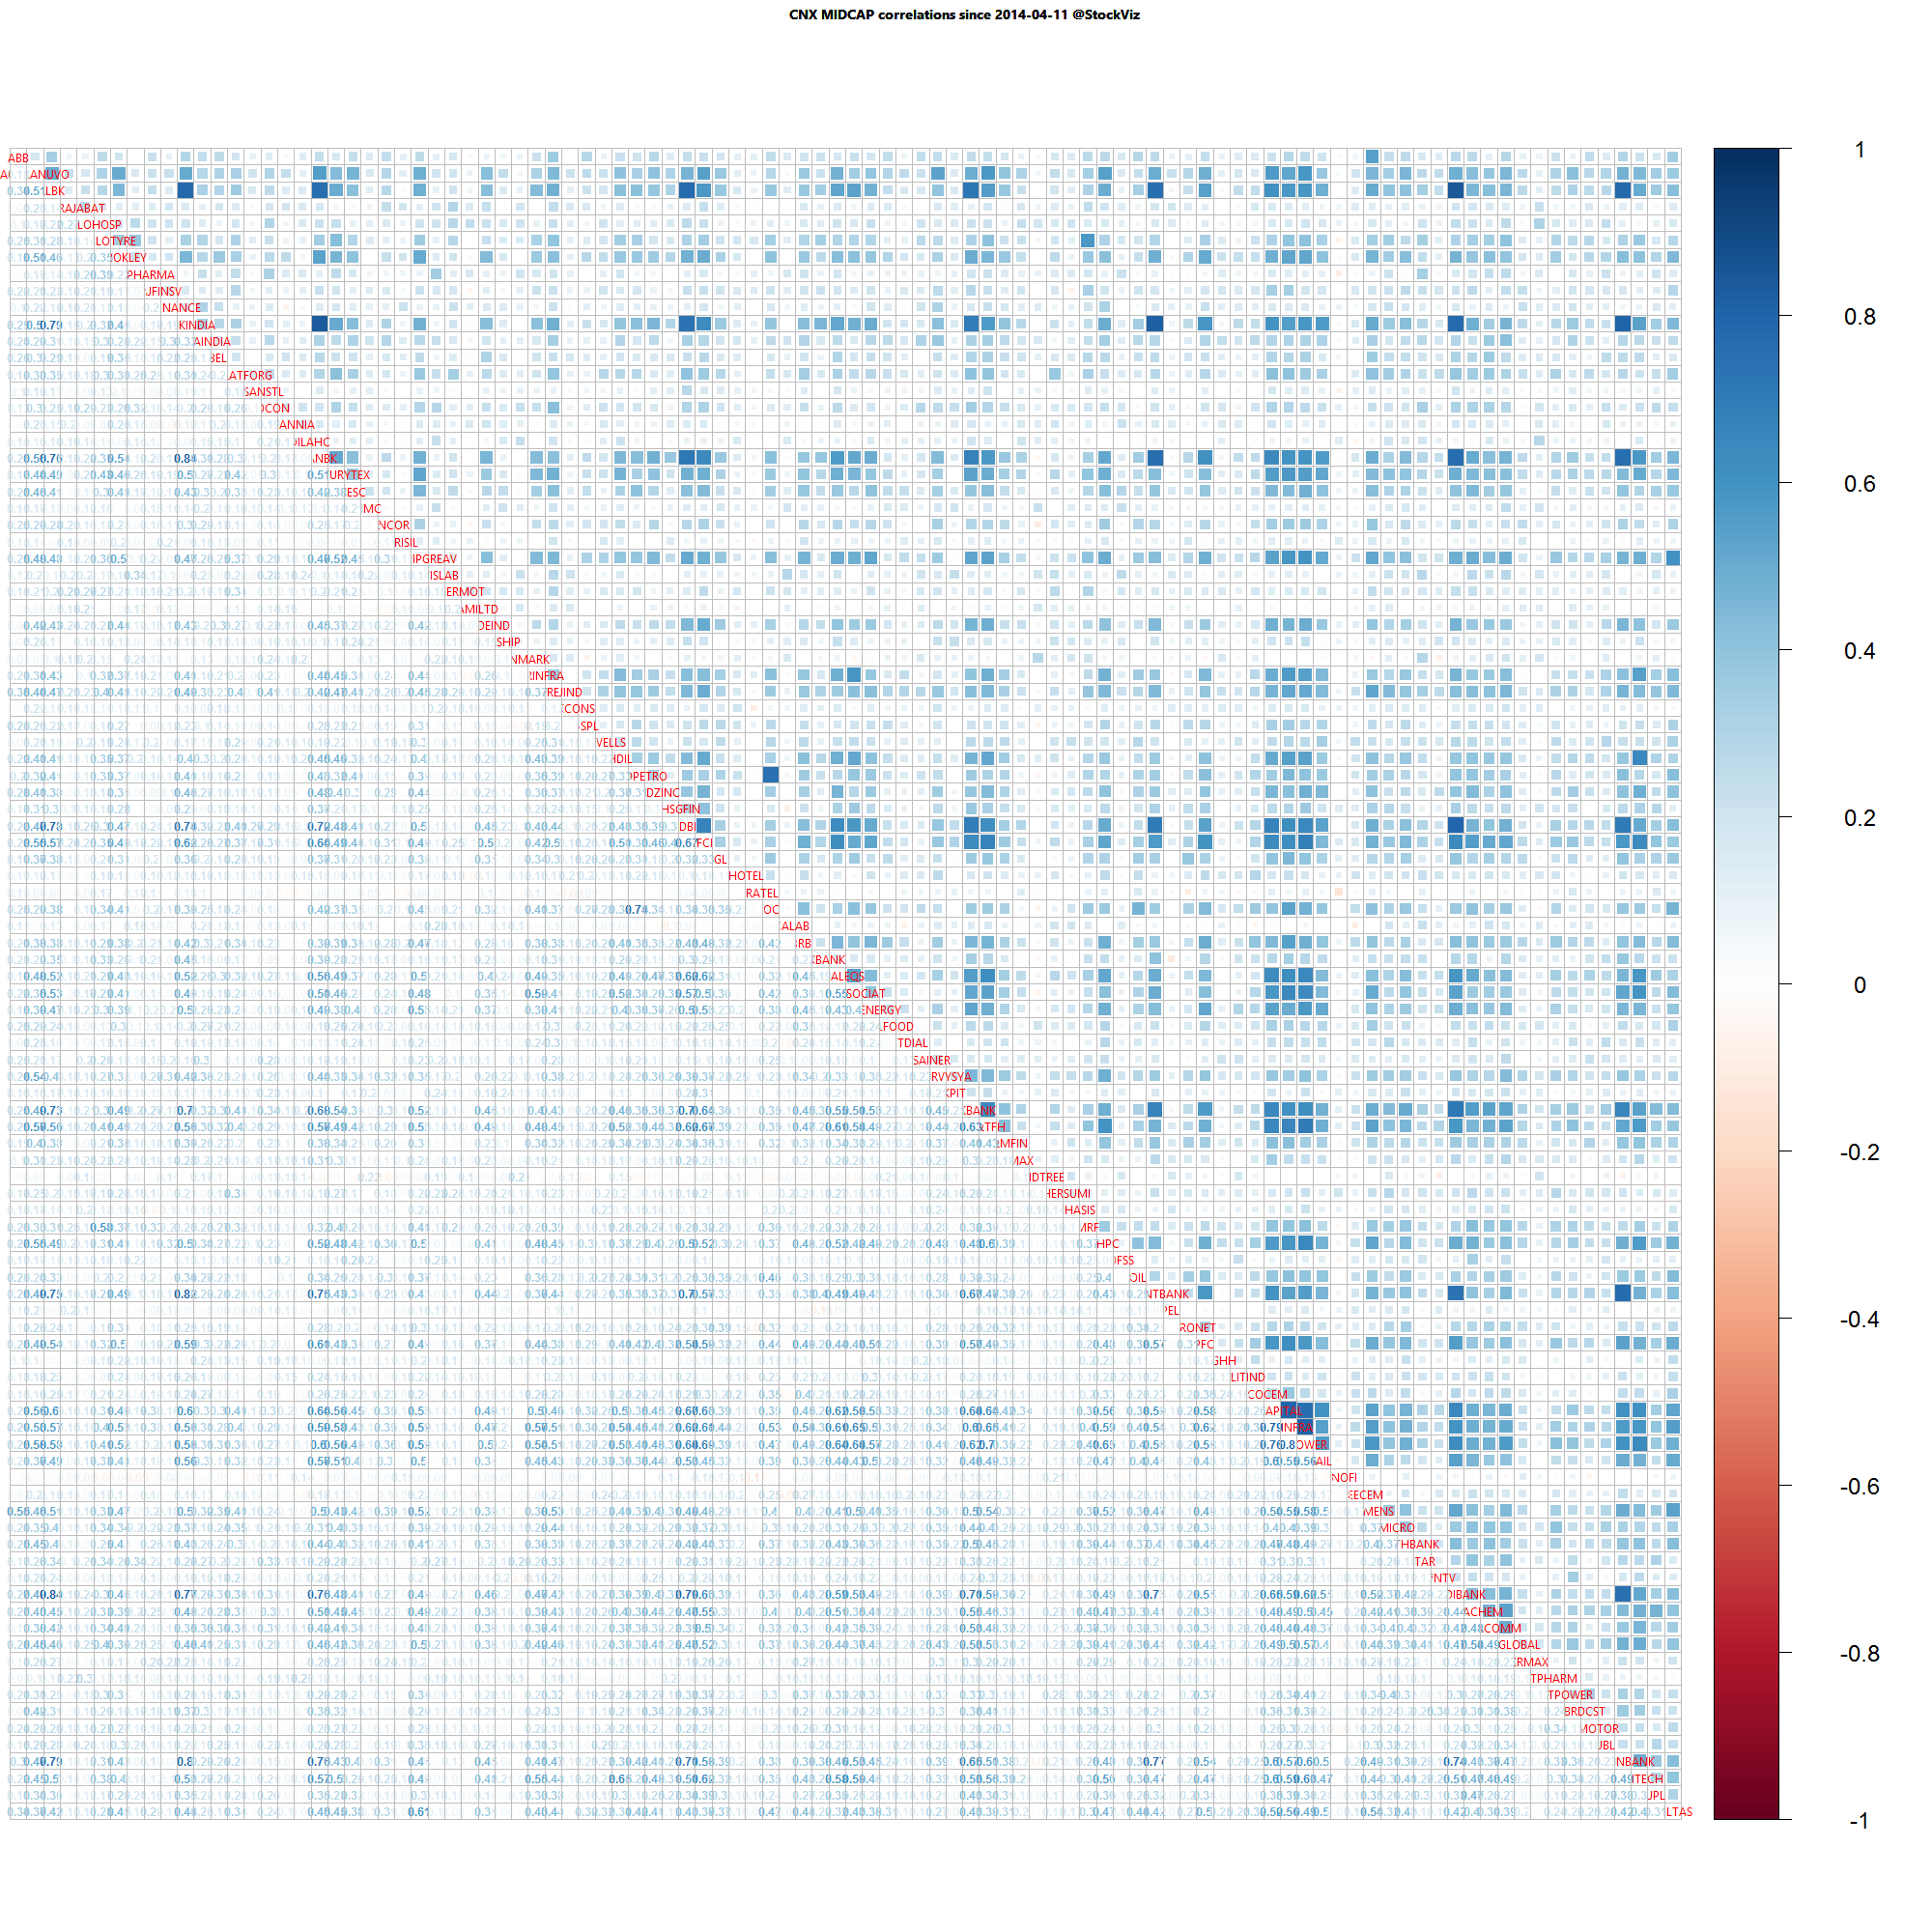
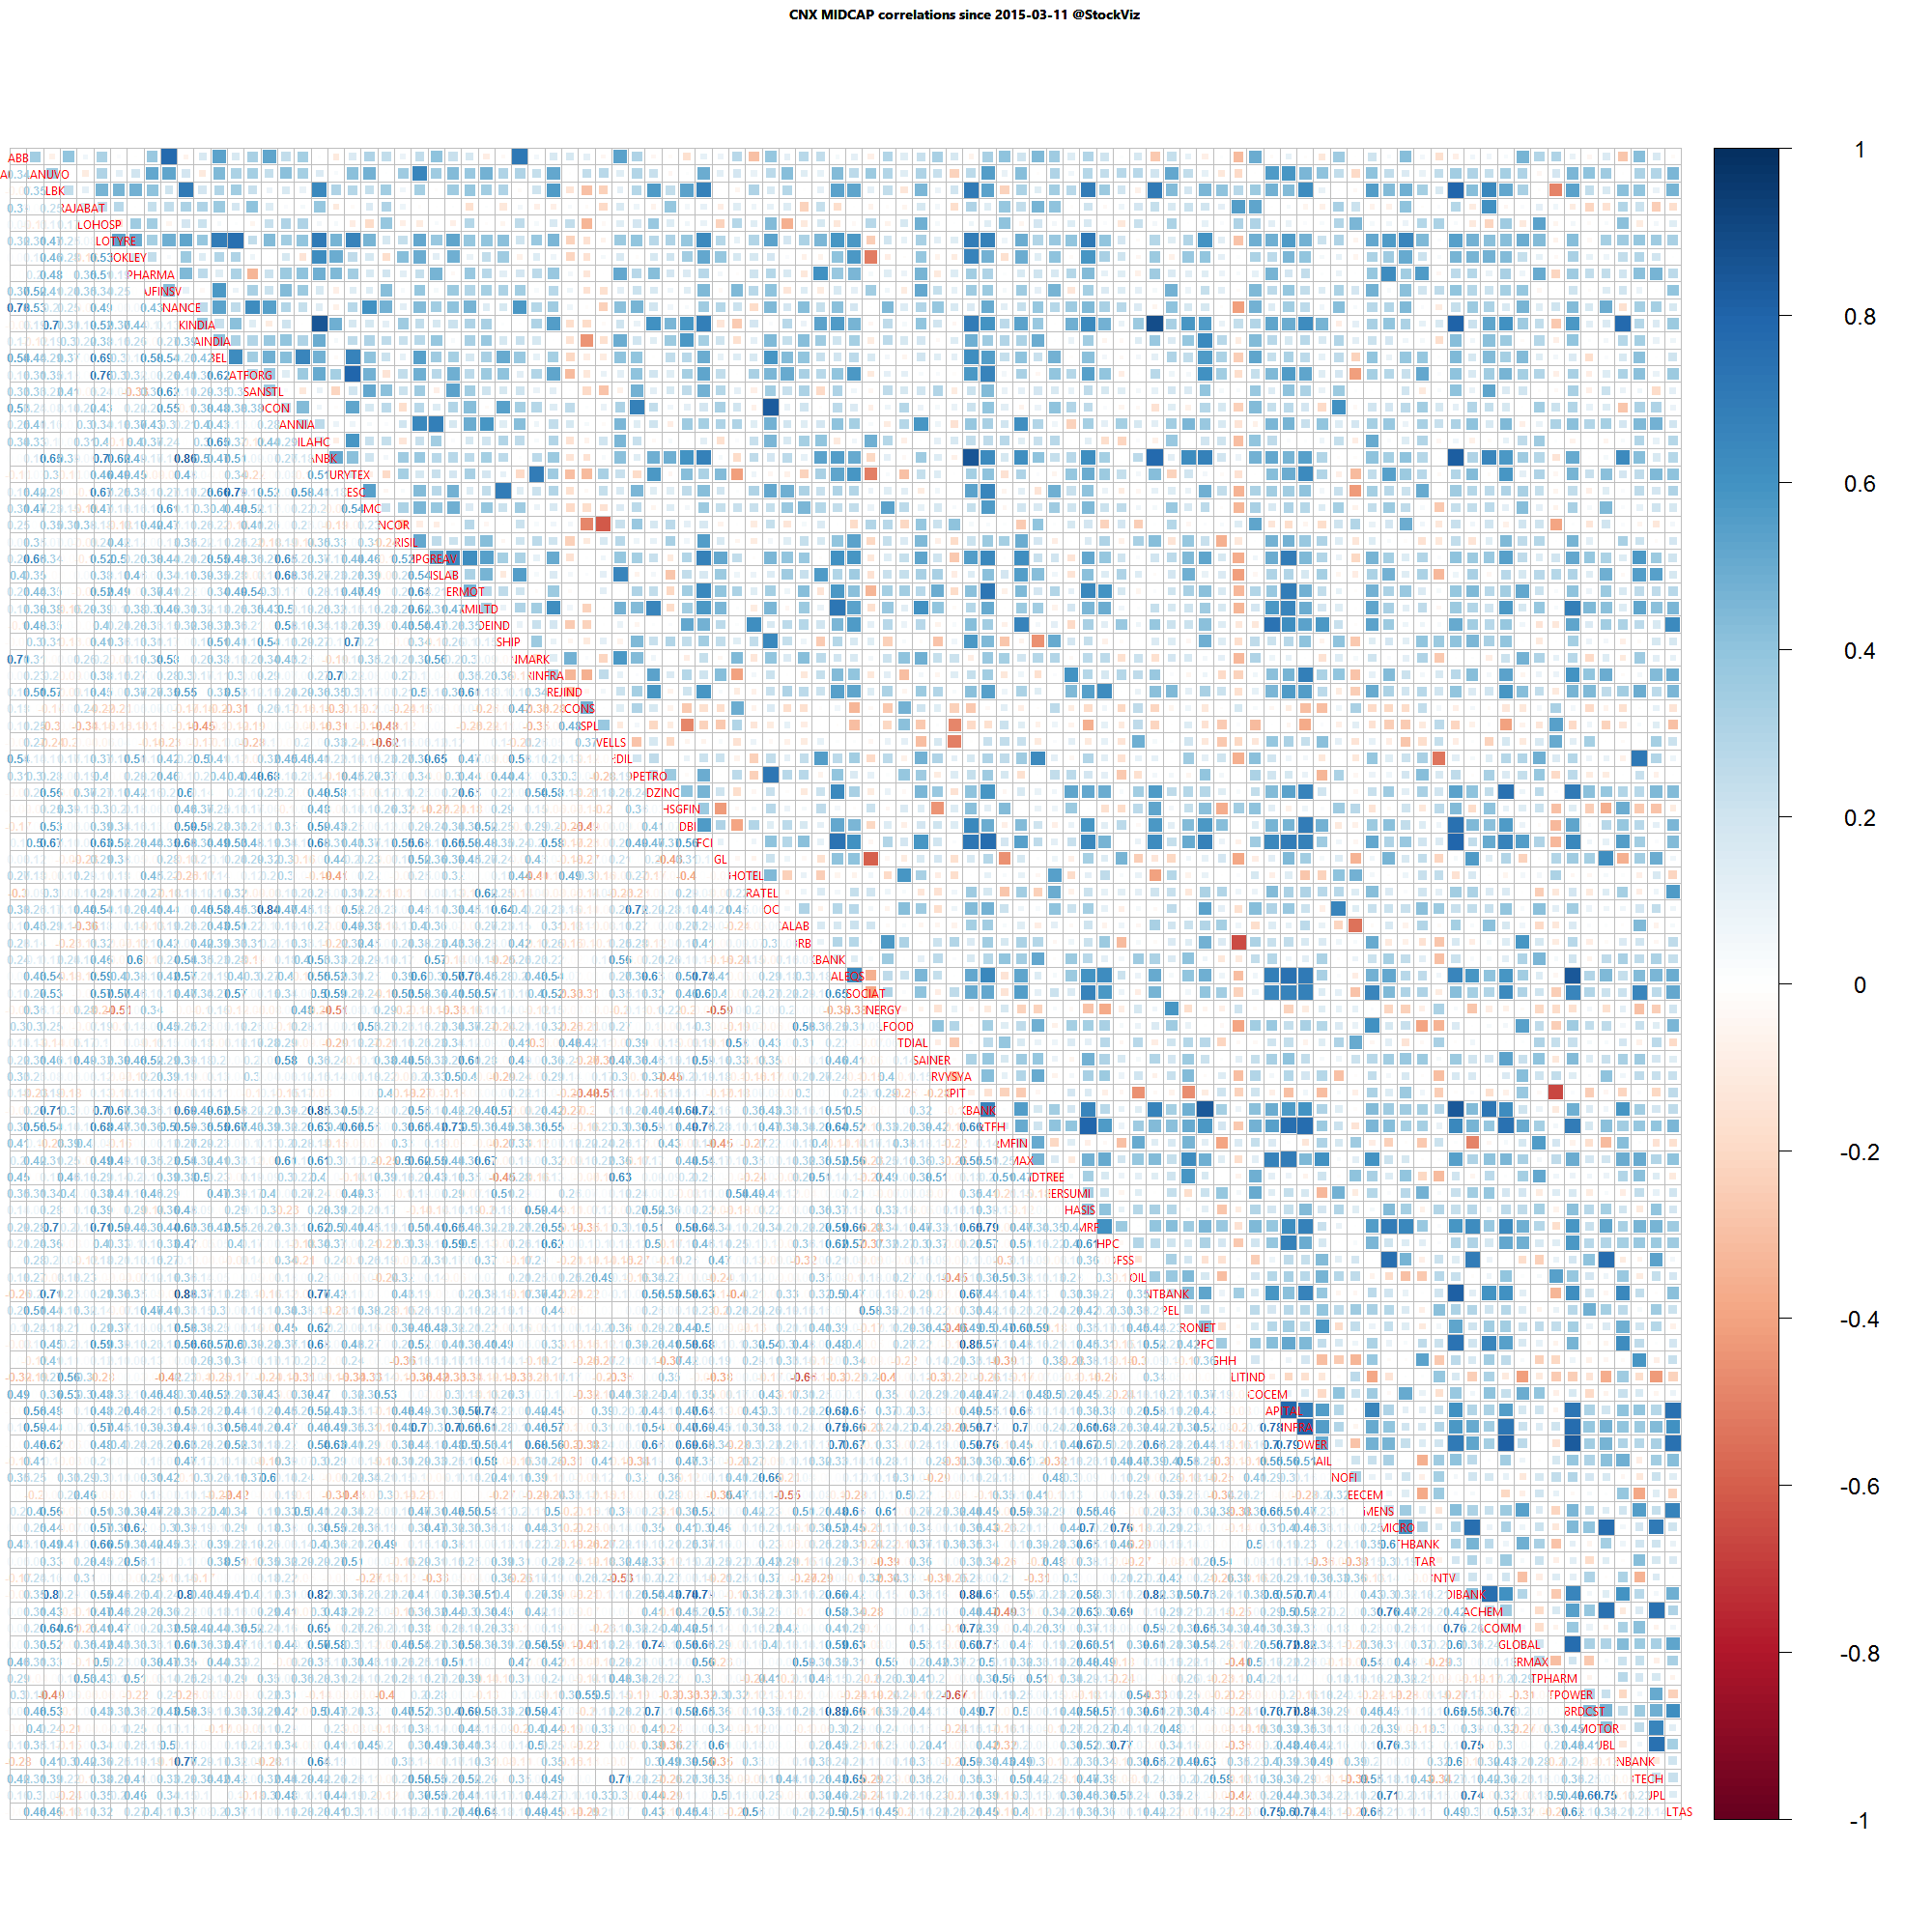
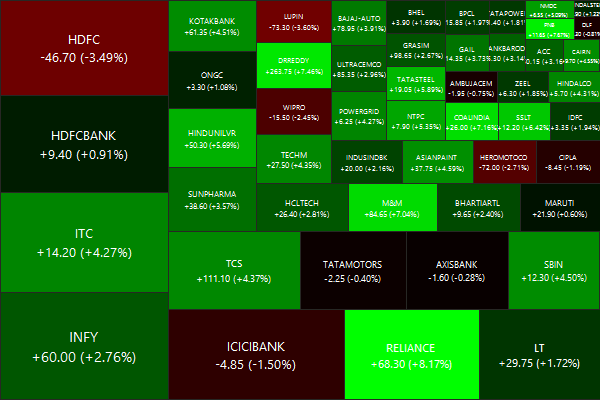
Nifty Heatmap
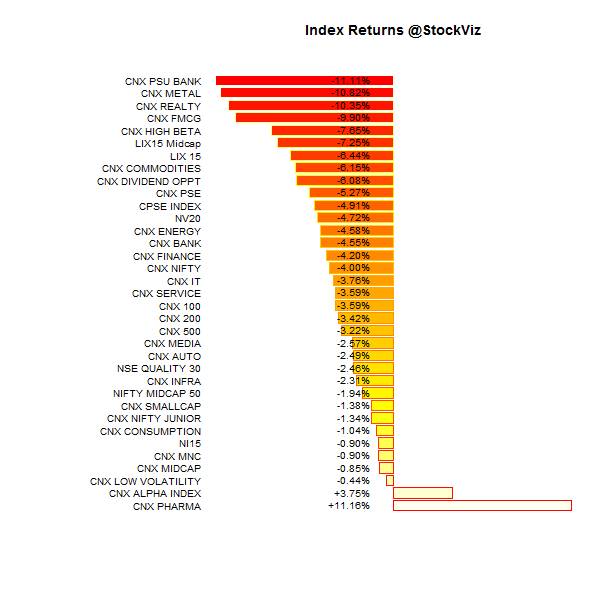
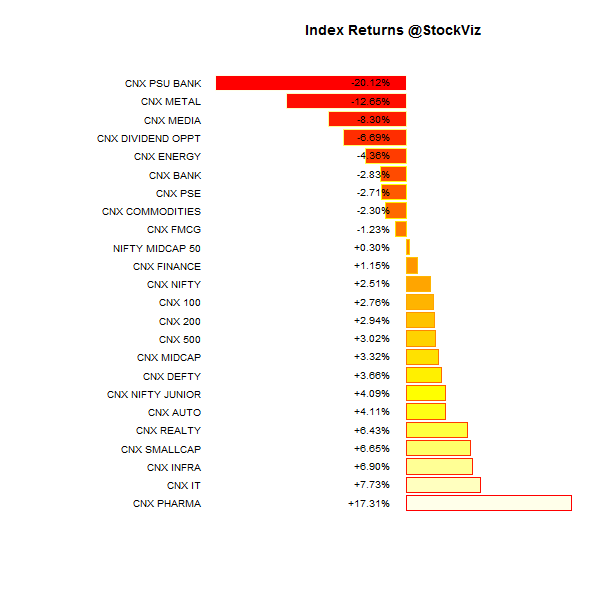
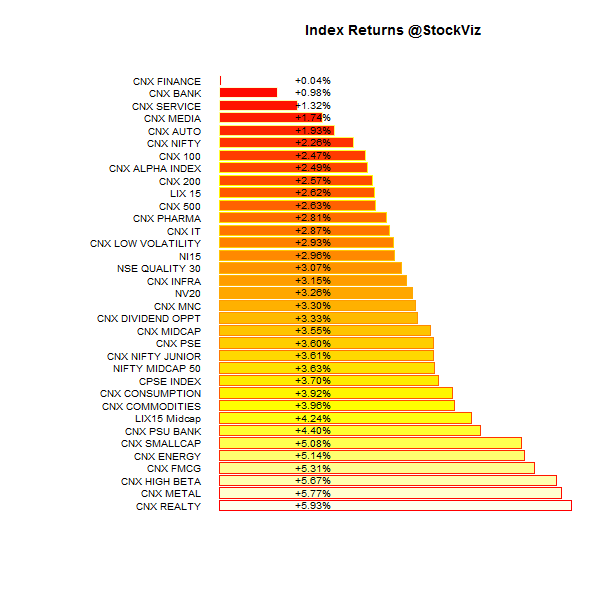
Index Returns
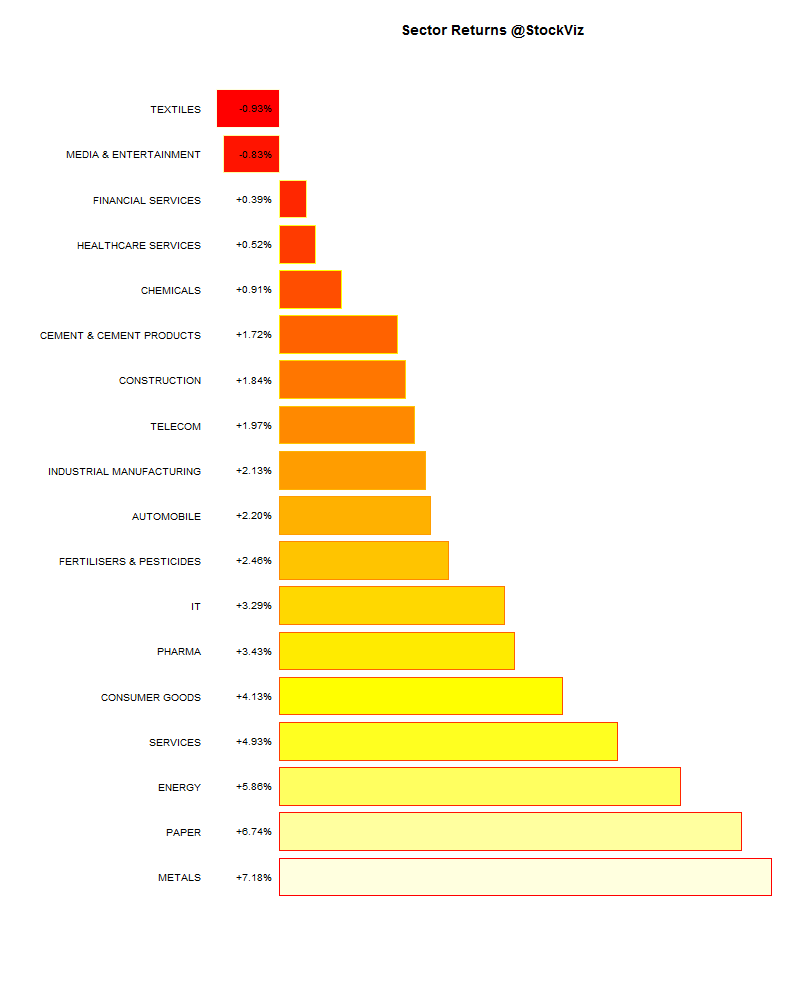
Sector Performance
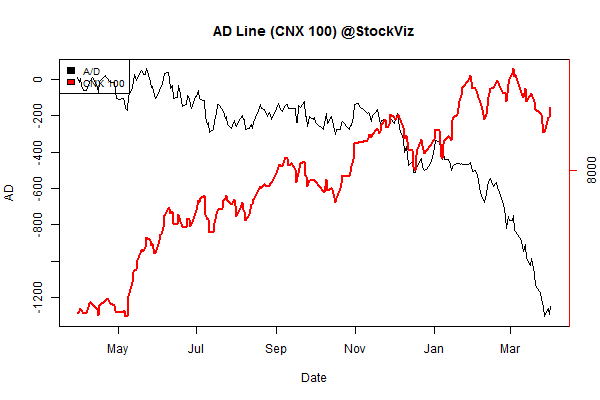
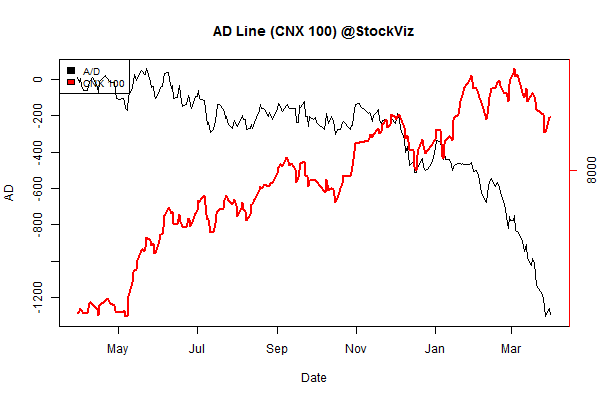
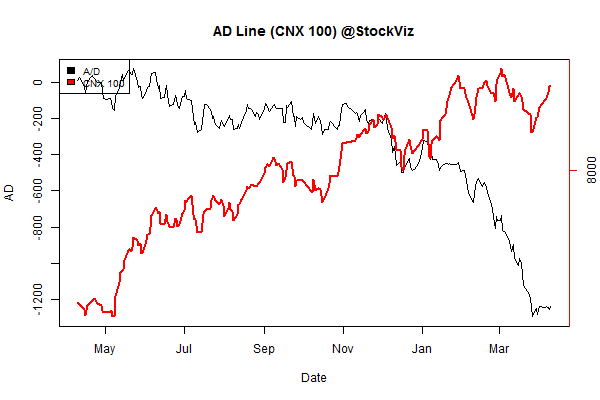
Advance Decline
Market Cap Decile Performance
| Decile | Mkt. Cap. | Adv/Decl |
|---|---|---|
| 1 (micro) | +10.90% | 78/53 |
| 2 | +11.87% | 85/46 |
| 3 | +12.22% | 86/45 |
| 4 | +11.65% | 83/47 |
| 5 | +9.90% | 86/45 |
| 6 | +8.36% | 79/52 |
| 7 | +8.67% | 78/52 |
| 8 | +5.18% | 73/58 |
| 9 | +4.27% | 70/61 |
| 10 (mega) | +3.25% | 71/60 |
A broad-based rally saw mid- and small-caps out-perform the large-caps.
Top Winners and Losers
Rally in RCOM seems a bit premature…
ETF Performance
| JUNIORBEES | +4.48% |
| CPSEETF | +3.62% |
| PSUBNKBEES | +3.57% |
| NIFTYBEES | +2.22% |
| BANKBEES | +1.07% |
| INFRABEES | +1.07% |
| GOLDBEES | +0.83% |
Green across the board, but gold under-performed equities…
Gold vs. Midcaps
You can send this to your mother-in-law. (http://svz.bz/1CCWifr)

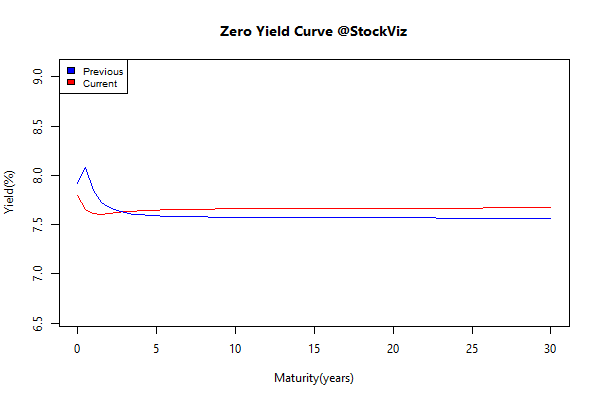
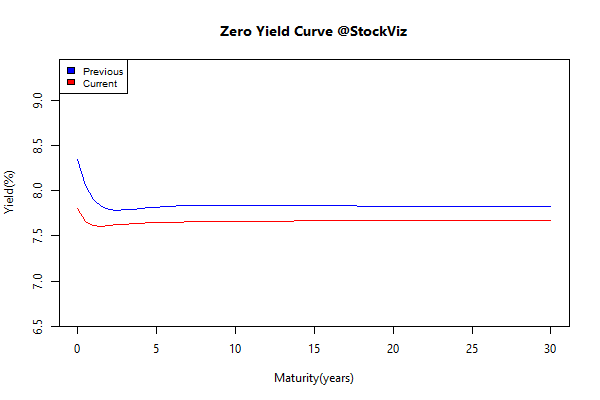
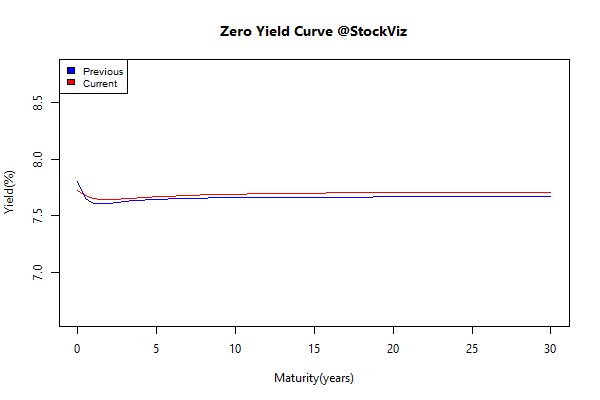
Yield Curve
Bond Indices
| Sub Index | Change in YTM | Total Return(%) |
|---|---|---|
| GSEC TB | +0.01 | +0.21% |
| GSEC SUB 1-3 | +0.14 | +0.19% |
| GSEC SUB 3-8 | +0.09 | -0.00% |
| GSEC SUB 8 | +0.11 | -0.48% |
Rates went up a smidgen. One would think that with the Moody’s change in outlook to “Positive”, we would have seen a rally in bonds…
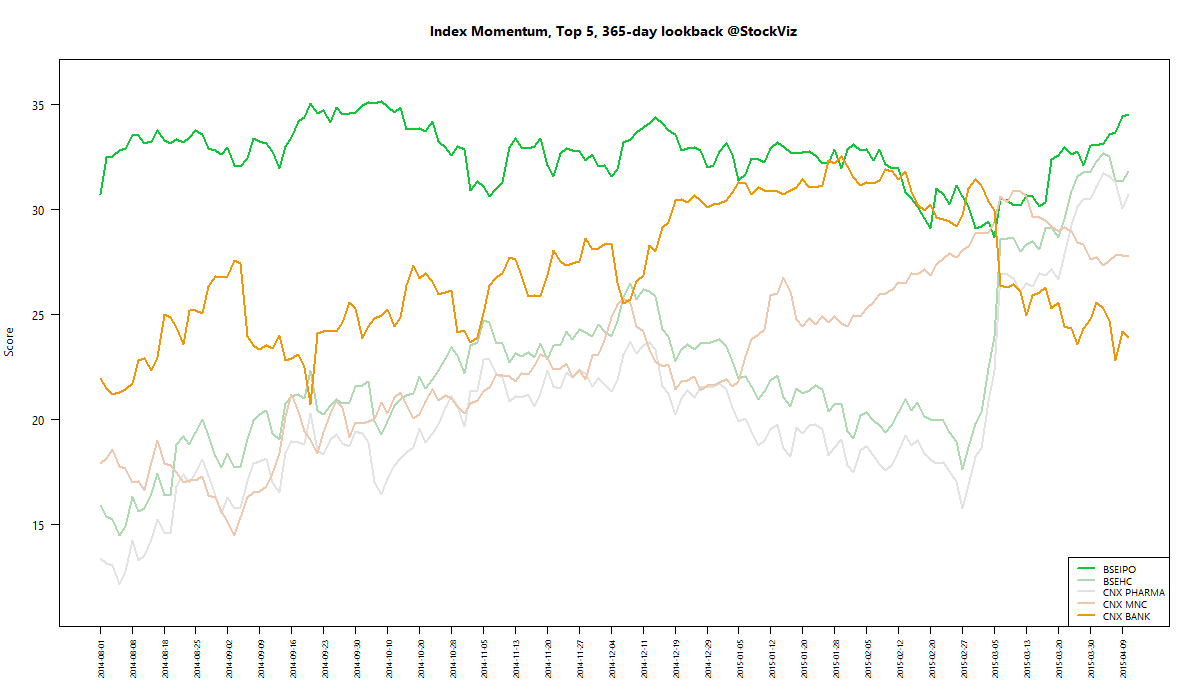
Investment Theme Performance
| Financial Strength Value | +11.00% |
| Momentum | +10.31% |
| Quality to Price | +10.22% |
| ADAG stocks | +10.04% |
| Textile, Metals, Chemicals, Paper and Energy Quality to Price | +6.96% |
| High Beta | +6.56% |
| Auto and Consumer Goods Quality to Price | +5.58% |
| Media, Health, IT, Telecom, Services, Pharma Quality To Price | +4.90% |
| Magic Formula | +4.84% |
| PPFAS Long Term Value | +4.68% |
| Tactical CNX 100 | +4.50% |
| Balance Sheet Strength | +4.33% |
| ASK Life | +4.32% |
| CNX 100 Enterprise Yield | +3.67% |
| Low Volatility | +3.05% |
| Next Trillion | +2.22% |
A week when all strategies kicked in…
Equity Mutual Funds
Bond Mutual Funds
Thought for the weekend
The market adjusts by the price mechanism. If the cost of something goes up, the price goes up to match. If demand falls, the price drops until the market clears. But prices themselves can’t adjust in response to events. This phenomenon is called “sticky prices.”
When prices are even a little sticky, bursts of technological progress actually hurt the economy for a short while, by causing a burst of deflation, before eventually boosting growth.