ETFs don’t trade in India
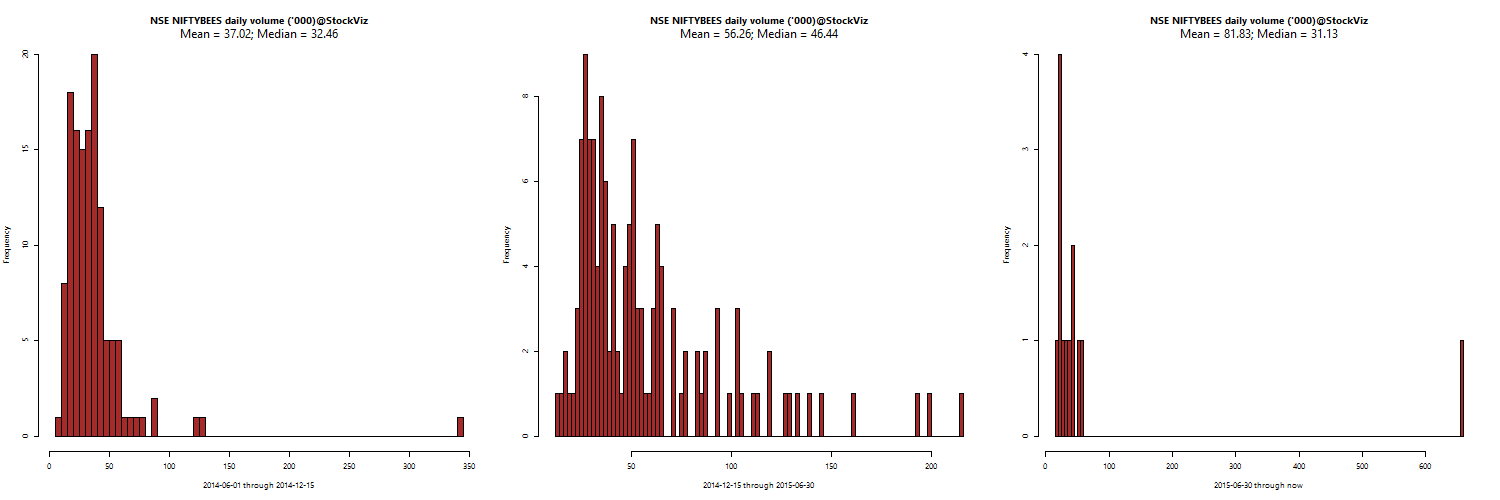
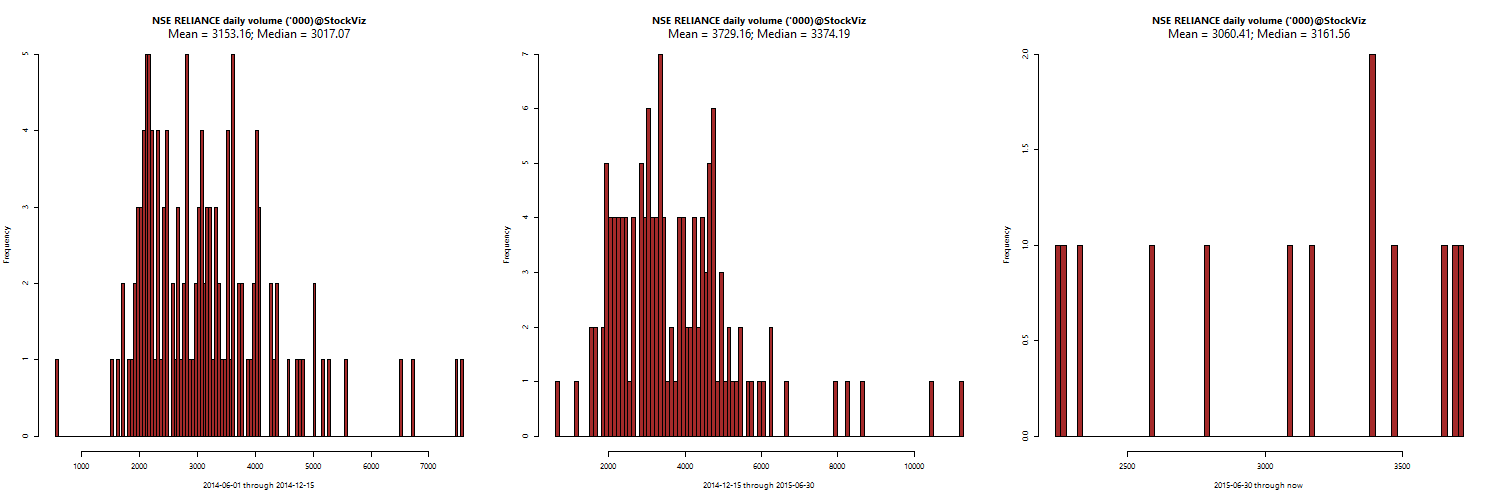
The NIFTYBEES ETF – an ETF that is indexed to the NIFTY – has less daily volume than RELIANCE. Median daily volumes of NIFTYBEES is around 31,000 whereas RELIANCE sees more than 3161,000.
NIFTYBEES:
RELIANCE:
In spite of paying dealers to provide liquidity
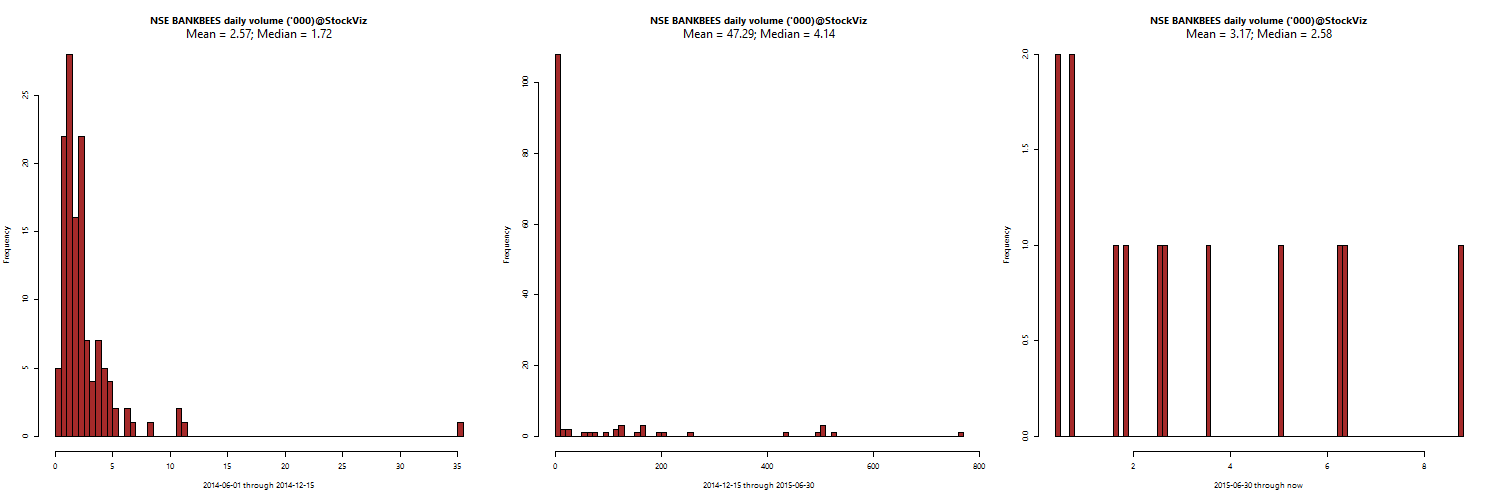
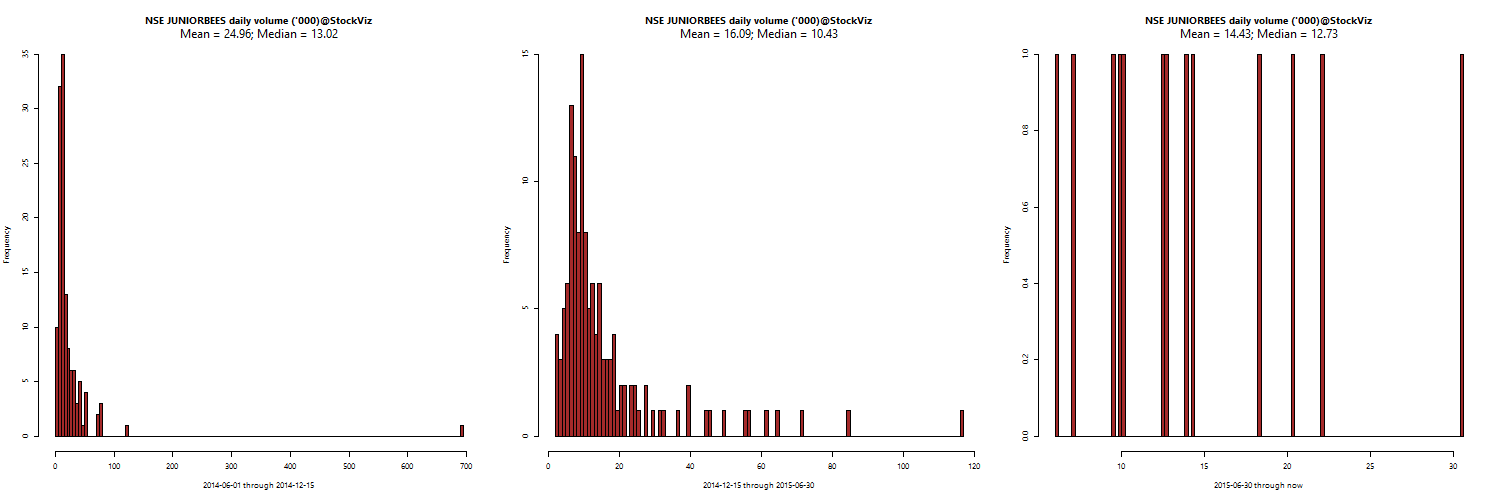
The NSE introduced a Liquidity enhancement scheme (LES) for market making in equity exchange traded funds (ETFs) effective from December 15, 2014 till February 28, 2015. It was then extended to June 30, 2015 (see appendix). The results have been mixed.
BANKBEES:
JUNIORBEES:
M100:
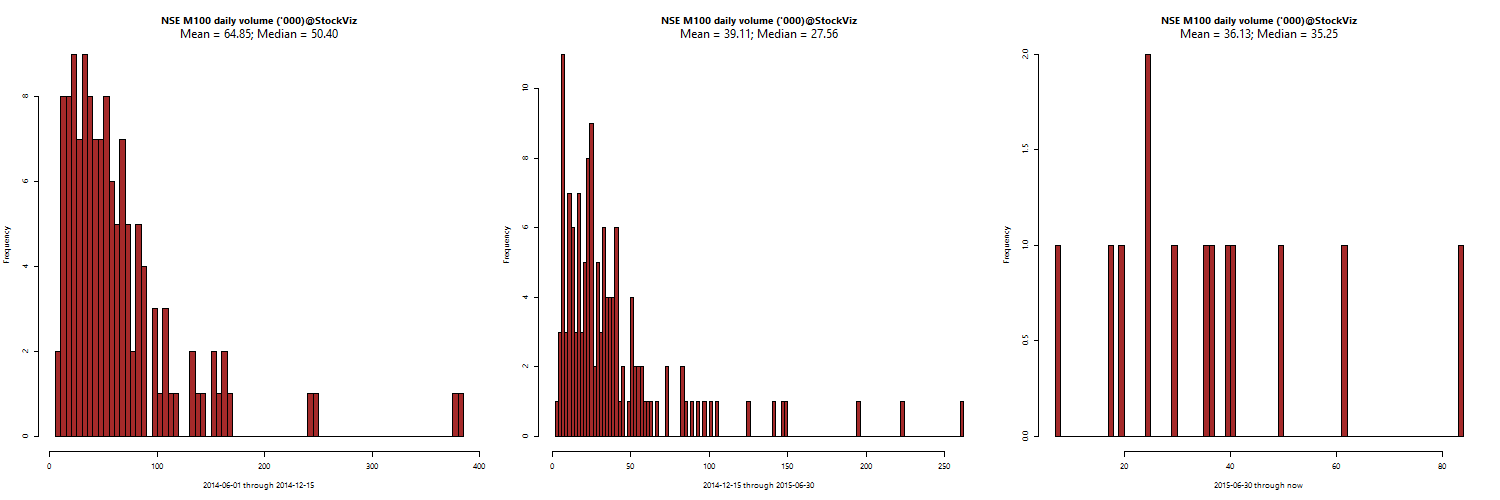
Daily volumes of M100 went down during the program. Here is the full list, volumes in ‘000s:
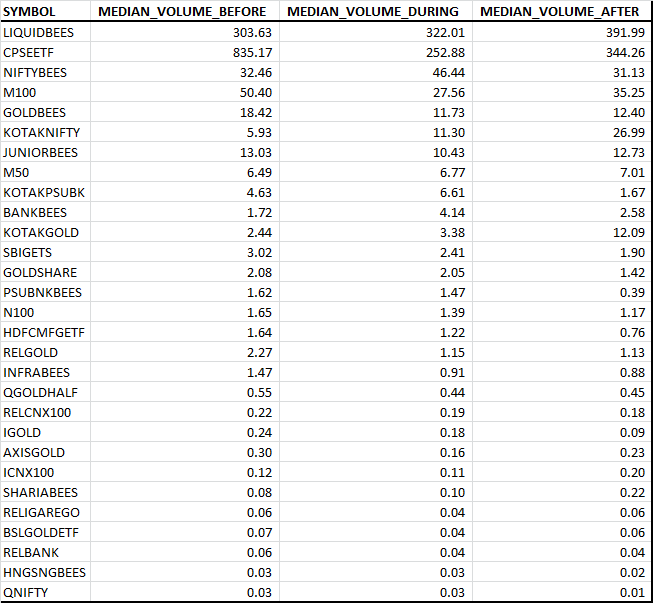
The program might have resulted in tighter bid-ask spreads but there was no surge in volumes. Retail investors remain disinterested in ETFs.
Appendix