Equities
| MINTs | |
|---|---|
| JCI(IDN) | -0.67% |
| INMEX(MEX) | +0.25% |
| NGSEINDX(NGA) | +4.18% |
| XU030(TUR) | -1.80% |
| BRICS | |
|---|---|
| IBOV(BRA) | -4.43% |
| SHCOMP(CHN) | +2.20% |
| NIFTY(IND) | +0.37% |
| INDEXCF(RUS) | +1.28% |
| TOP40(ZAF) | -0.27% |
Commodities
| Energy | |
|---|---|
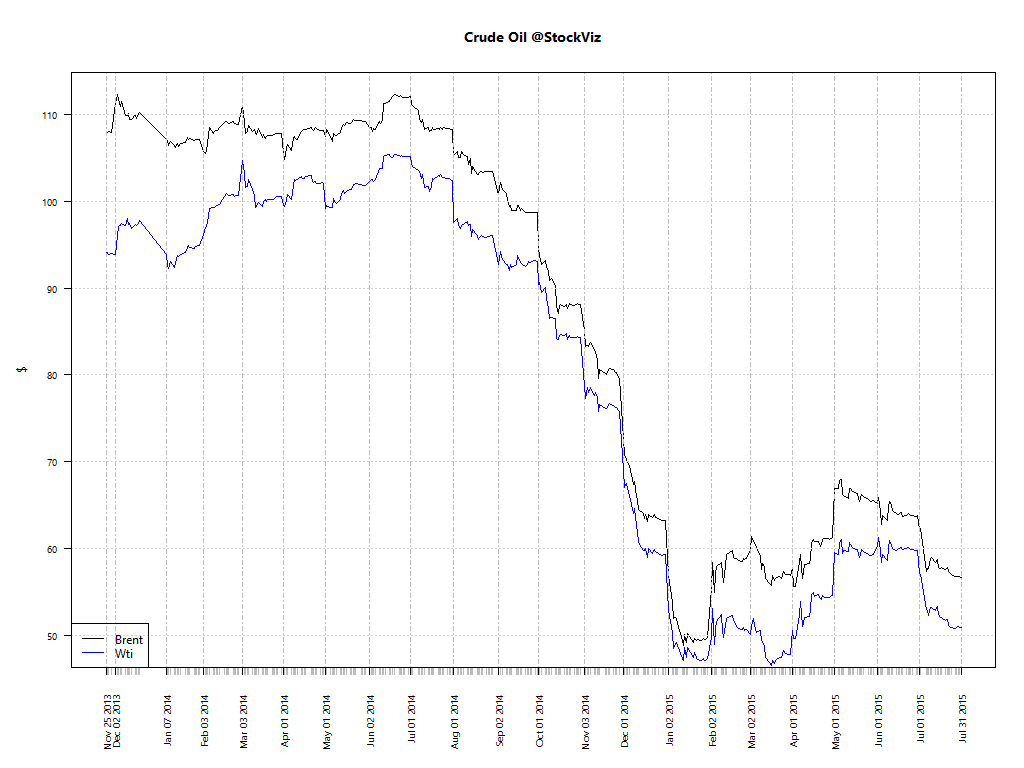
| Brent Crude Oil | -7.00% |
| Ethanol | -2.60% |
| Heating Oil | -2.62% |
| WTI Crude Oil | -7.78% |
| Natural Gas | +2.80% |
| RBOB Gasoline | -11.53% |
| Metals | |
|---|---|
| Silver 5000oz | -1.34% |
| Palladium | -2.32% |
| Platinum | -2.49% |
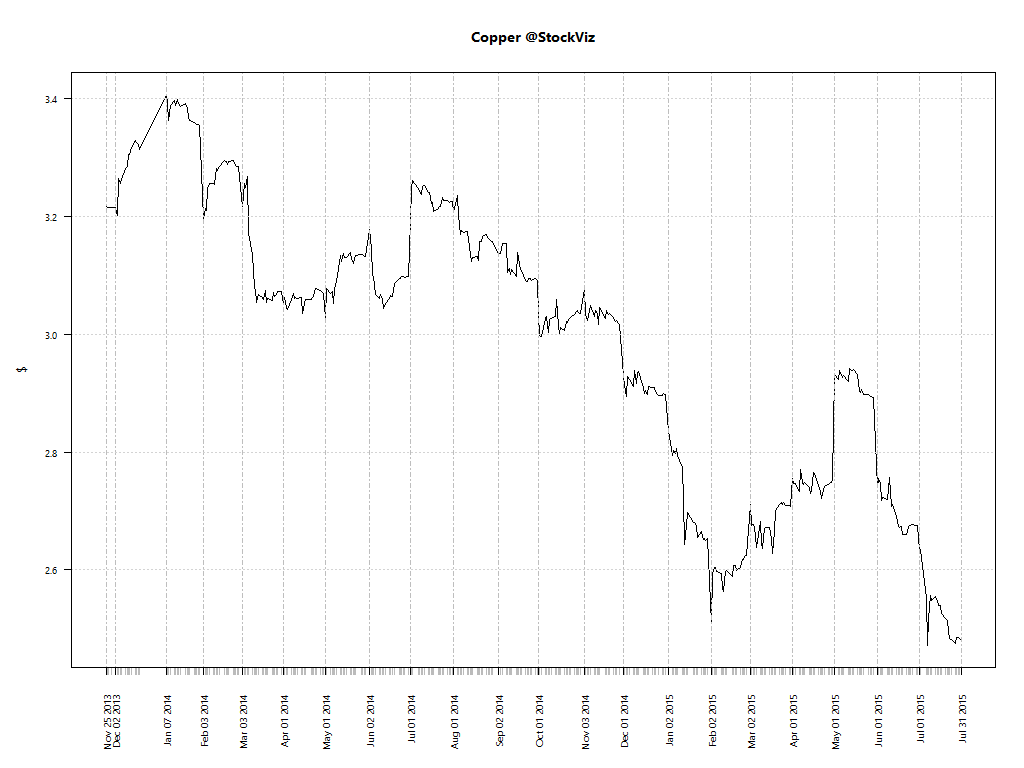
| Copper | -1.27% |
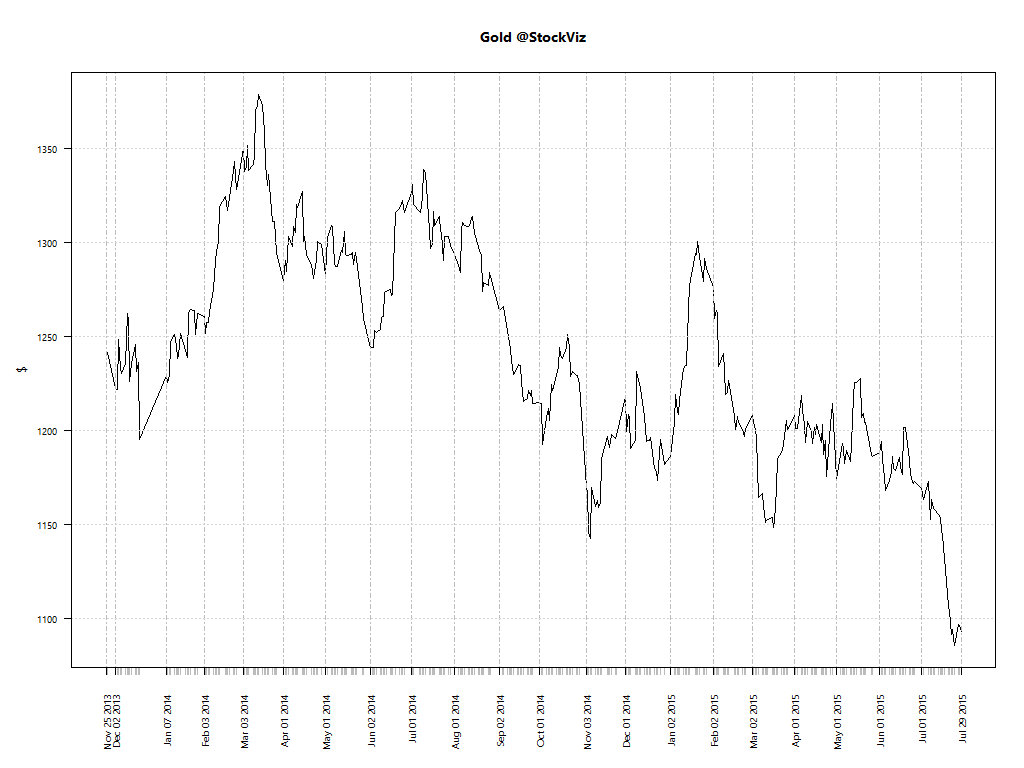
| Gold 100oz | -0.46% |
Currencies
| MINTs | |
|---|---|
| USDIDR(IDN) | +0.01% |
| USDMXN(MEX) | +0.24% |
| USDNGN(NGA) | +0.10% |
| USDTRY(TUR) | +0.31% |
| BRICS | |
|---|---|
| USDBRL(BRA) | +2.32% |
| USDCNY(CHN) | +0.00% |
| USDINR(IND) | -0.50% |
| USDRUB(RUS) | +4.30% |
| USDZAR(ZAF) | -0.40% |
| Agricultural | |
|---|---|
| Coffee (Arabica) | +0.95% |
| Coffee (Robusta) | -6.71% |
| Cattle | +2.50% |
| Corn | +0.47% |
| Cotton | -2.50% |
| Orange Juice | +7.82% |
| Sugar #11 | -4.39% |
| Lean Hogs | -1.34% |
| White Sugar | -1.26% |
| Cocoa | -2.49% |
| Feeder Cattle | +1.54% |
| Lumber | +3.33% |
| Soybean Meal | -0.76% |
| Soybeans | +3.17% |
| Wheat | +2.46% |
Credit Indices
| Index | Change |
|---|---|
| Markit CDX EM | -0.45% |
| Markit CDX NA HY | -0.03% |
| Markit CDX NA IG | +0.86% |
| Markit iTraxx Asia ex-Japan IG | +1.78% |
| Markit iTraxx Australia | +2.72% |
| Markit iTraxx Europe | -0.84% |
| Markit iTraxx Europe Crossover | +1.87% |
| Markit iTraxx Japan | +1.18% |
| Markit iTraxx SovX Western Europe | -1.67% |
| Markit LCDX (Loan CDS) | -0.04% |
| Markit MCDX (Municipal CDS) | -0.98% |
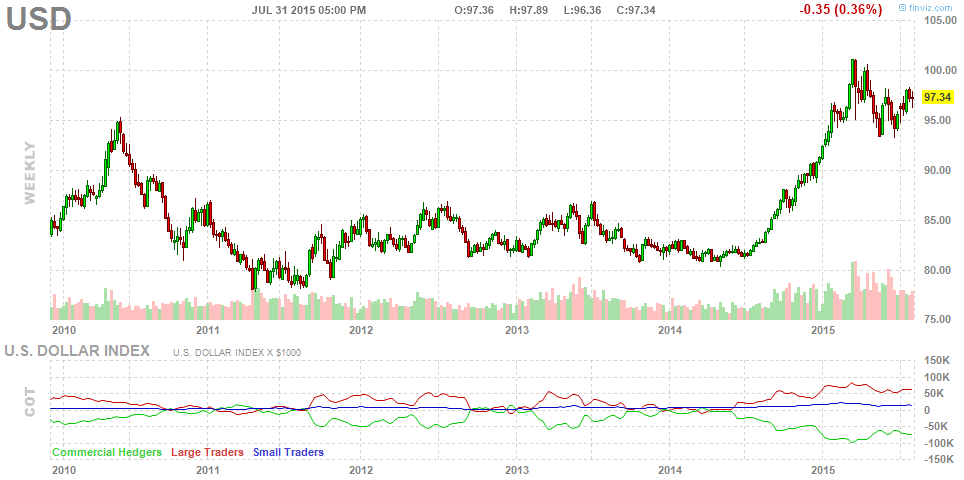
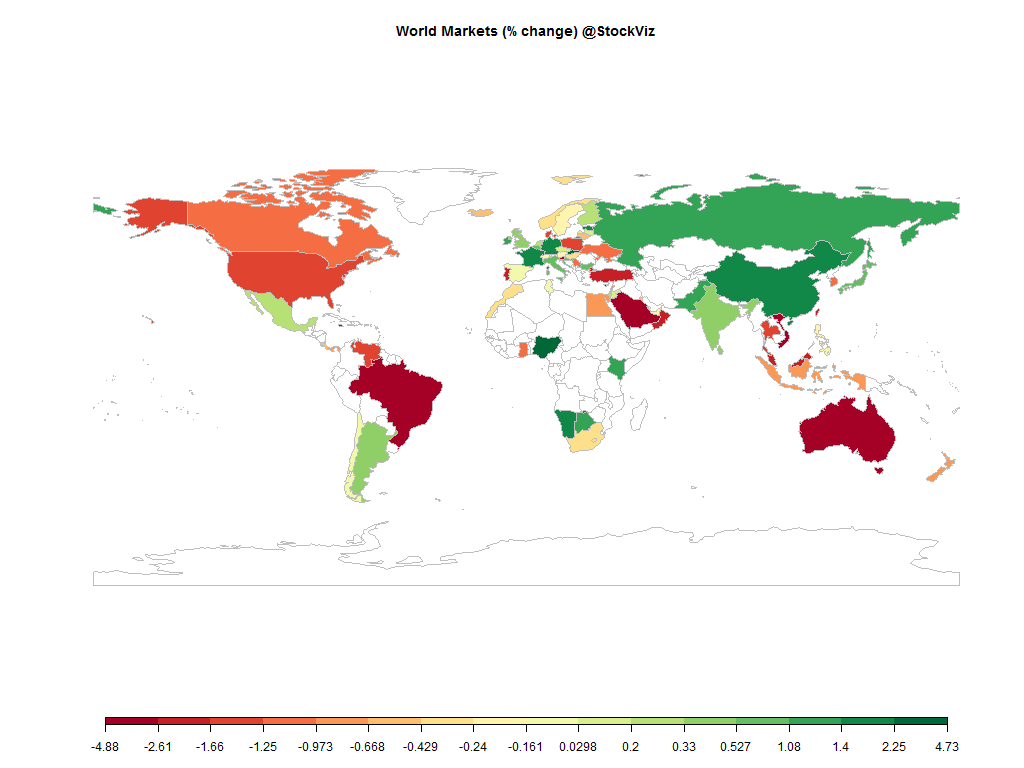
Another bad week for commodities with the S&P flirting with red for the year. The energy and precious metals complex resumed their collapse. The Nifty barely made it to the green. INR appreciated against the USD but the USD appreciated against other major currencies.
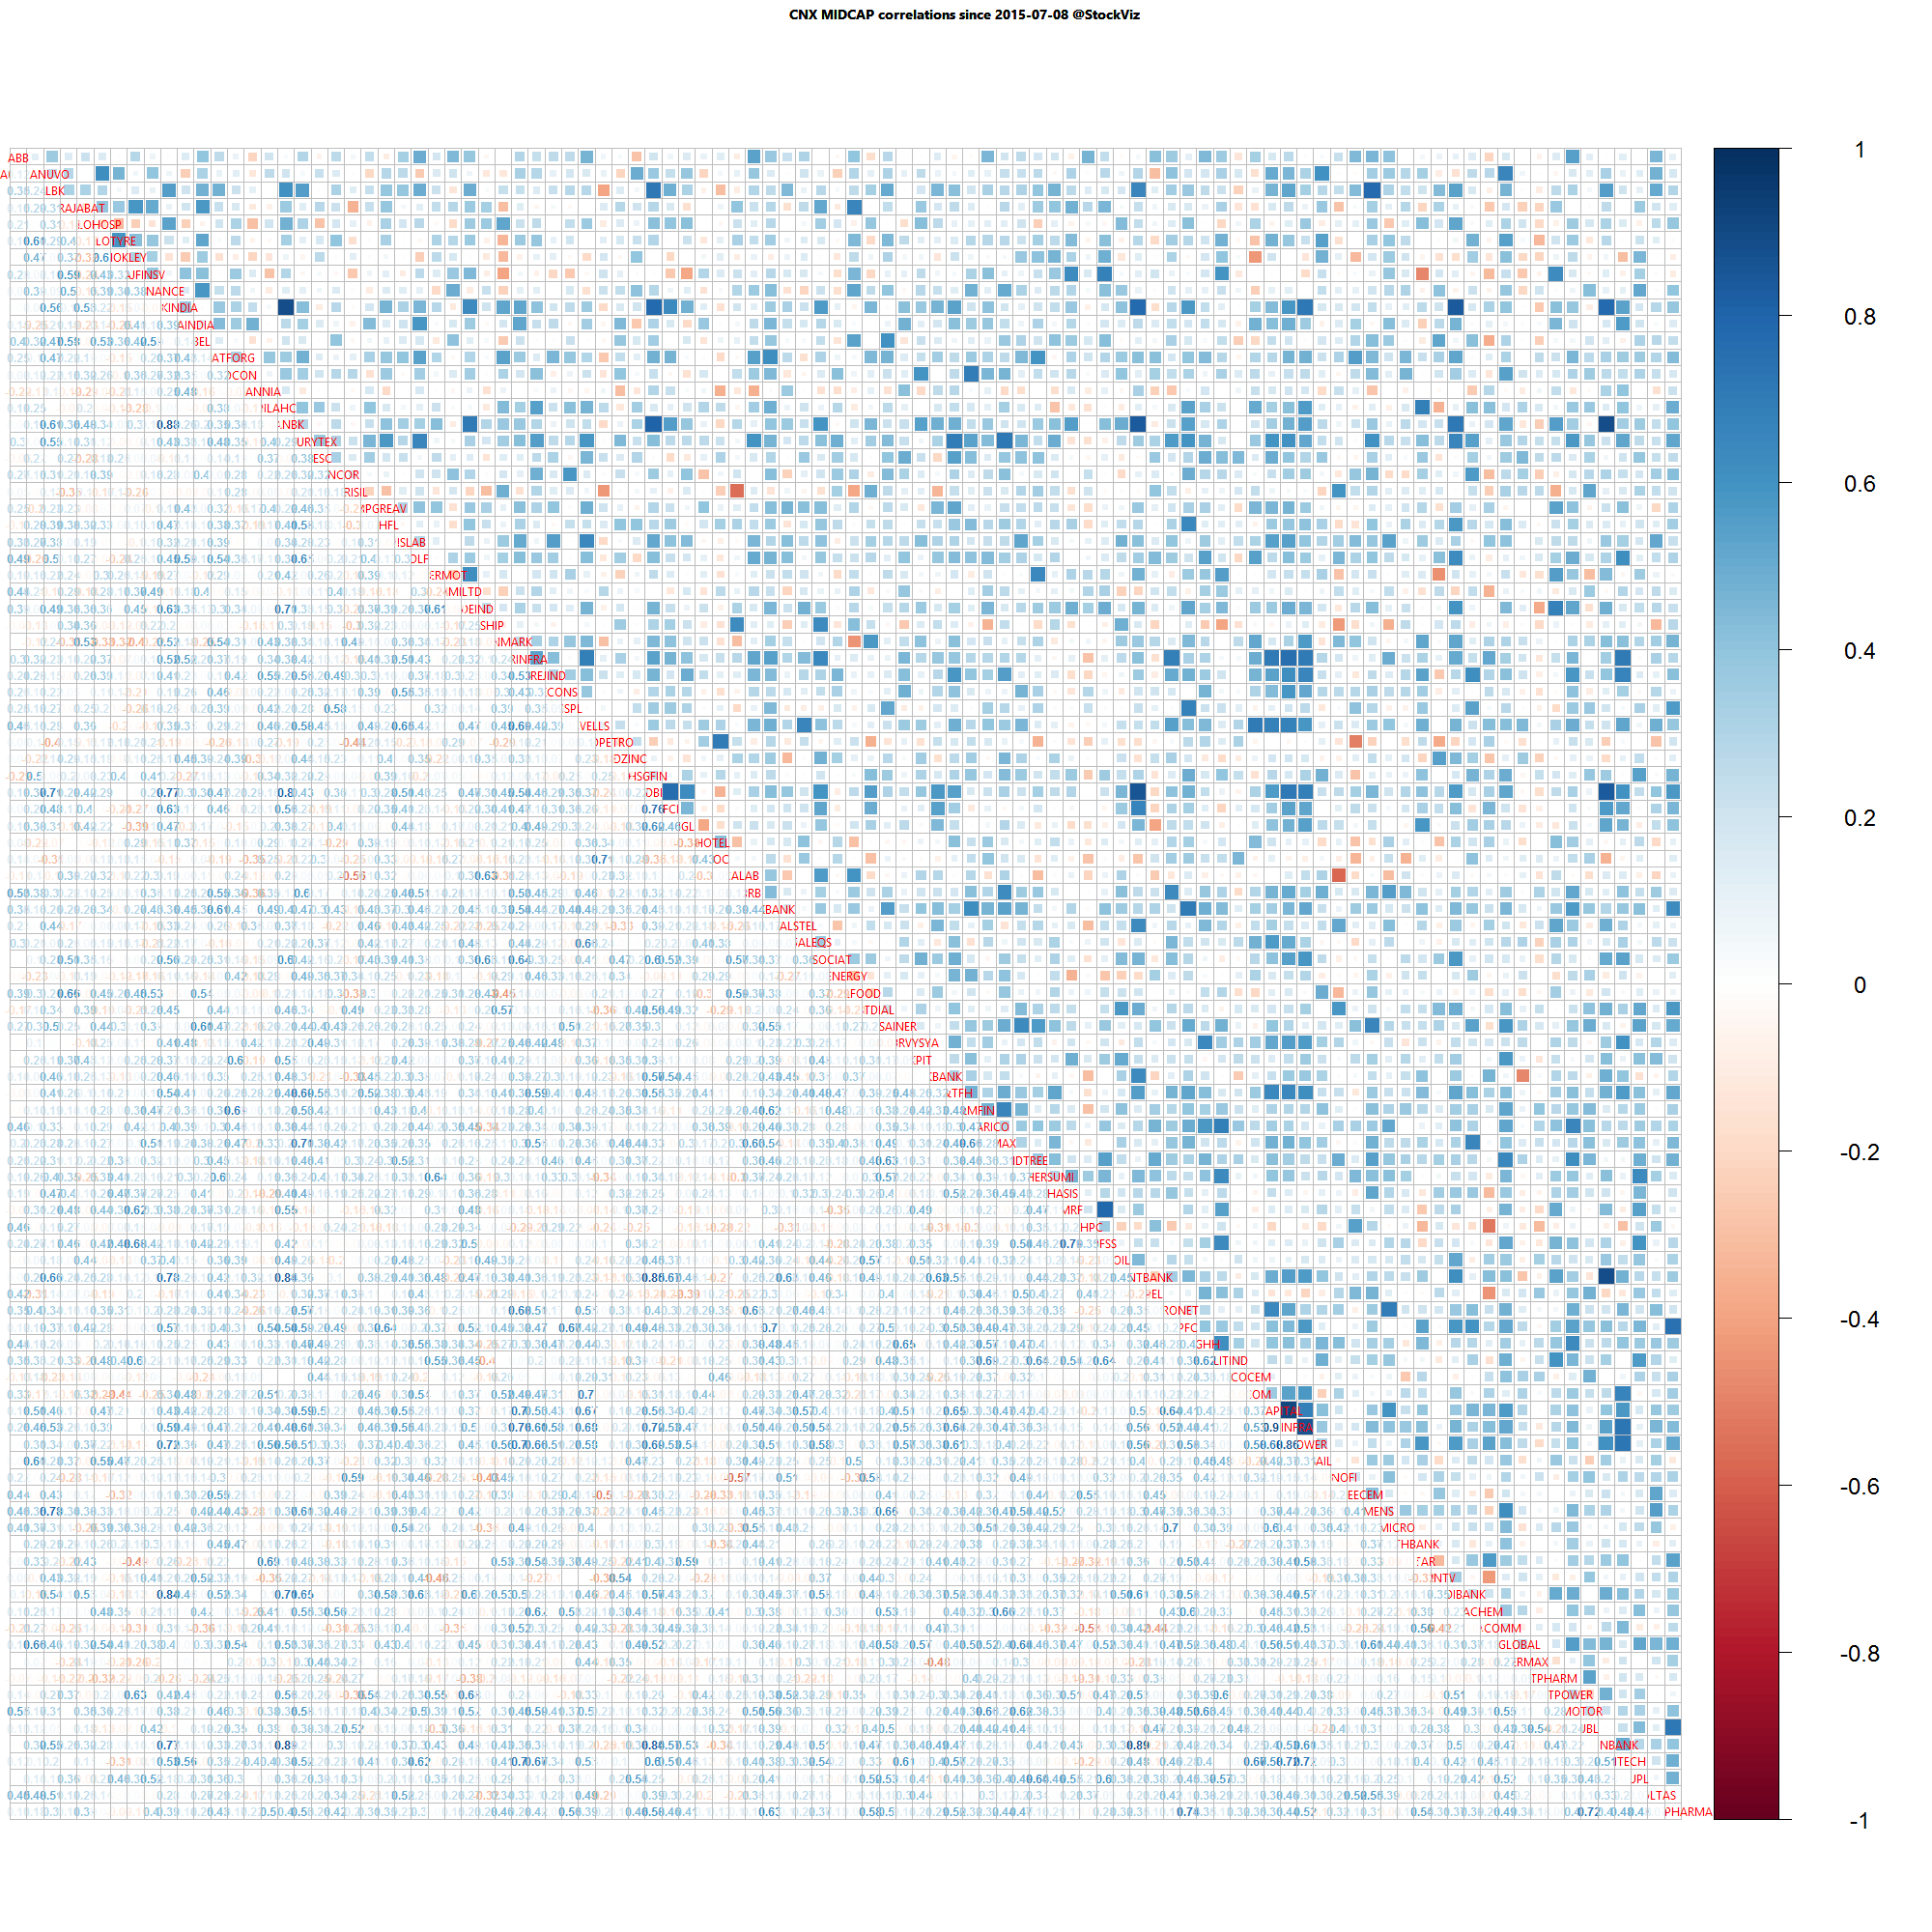
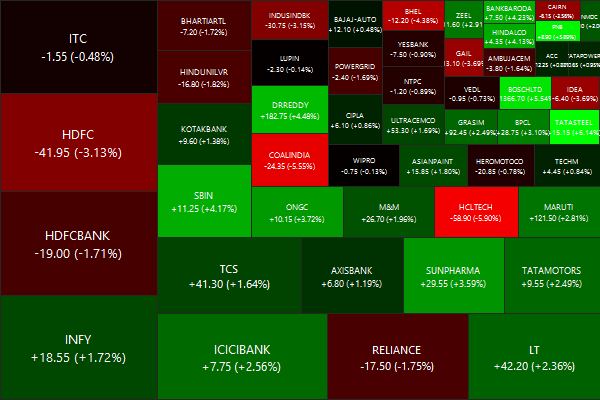
Nifty Heatmap
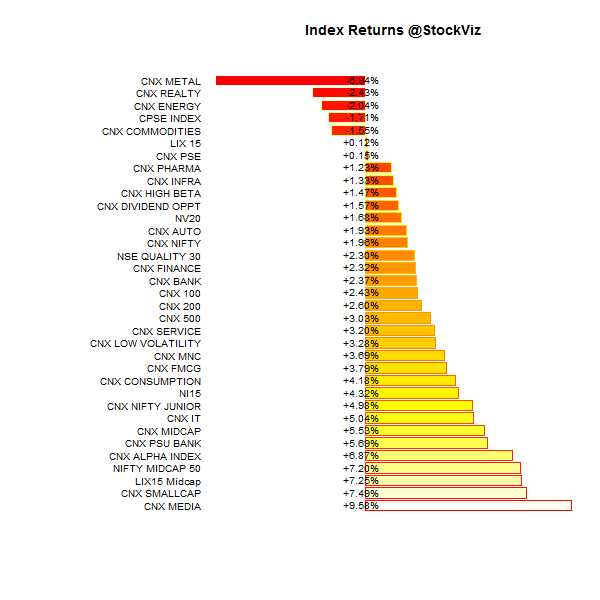
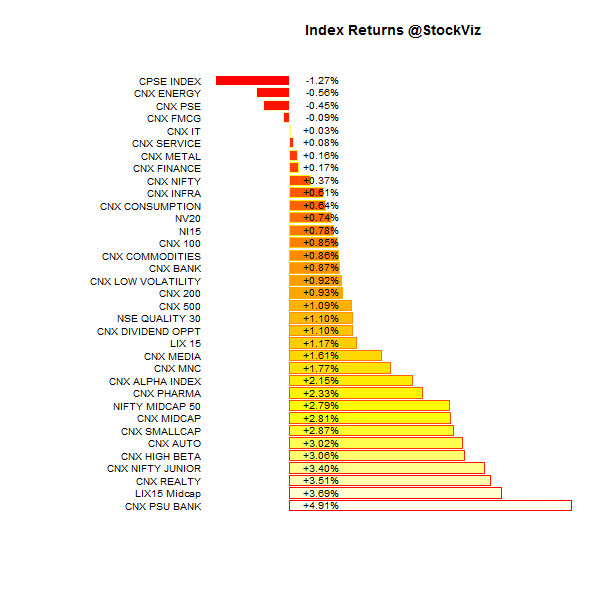
Index Returns
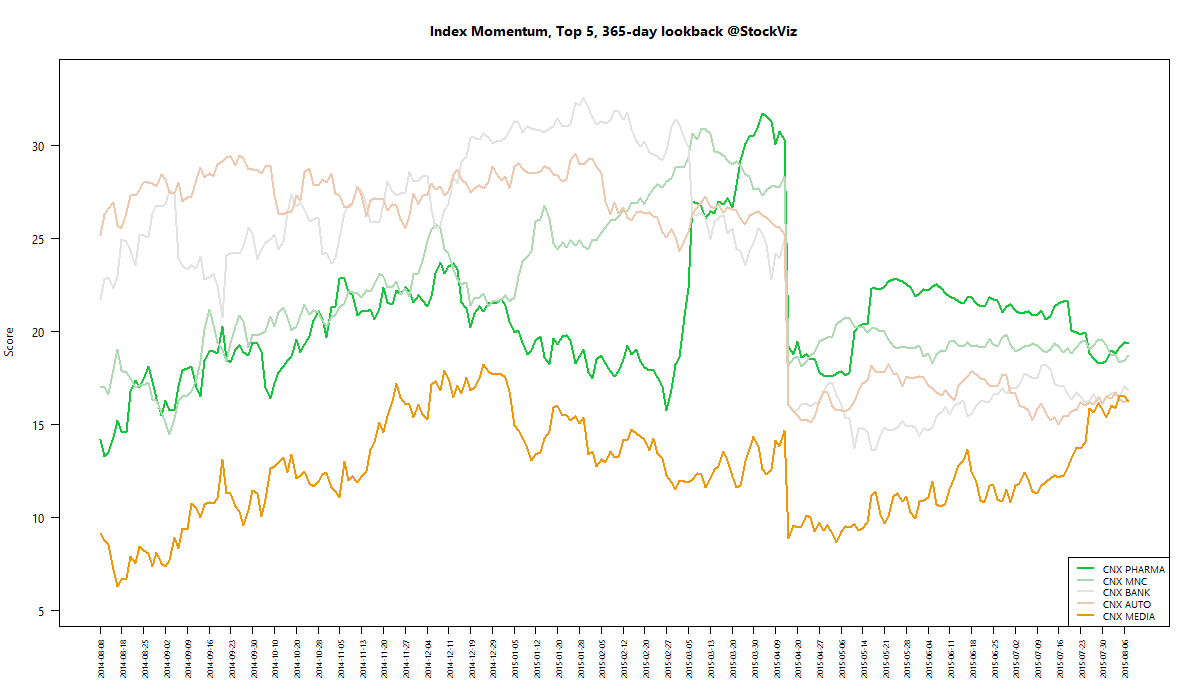
For a deeper dive into indices, check out our weekly Index Update.
Market Cap Decile Performance
| Decile | Mkt. Cap. | Adv/Decl |
|---|---|---|
| 1 (micro) | +8.49% | 79/58 |
| 2 | +4.50% | 77/58 |
| 3 | +5.13% | 71/66 |
| 4 | +5.36% | 74/62 |
| 5 | +4.19% | 76/60 |
| 6 | +4.87% | 76/60 |
| 7 | +4.28% | 77/59 |
| 8 | +3.92% | 78/59 |
| 9 | +3.89% | 75/61 |
| 10 (mega) | +2.36% | 73/64 |
Midcaps out-performed large caps…
Top Winners and Losers
After spending the longest time in the doldrums, Cummins jolted up after its Q1 results.
ETF Performance
| PSUBNKBEES | +5.28% |
| JUNIORBEES | +3.05% |
| INFRABEES | +0.52% |
| NIFTYBEES | +0.33% |
| BANKBEES | +0.33% |
| GOLDBEES | -0.38% |
| CPSEETF | -1.18% |
PSU banks continued to rally on the promise of free money.
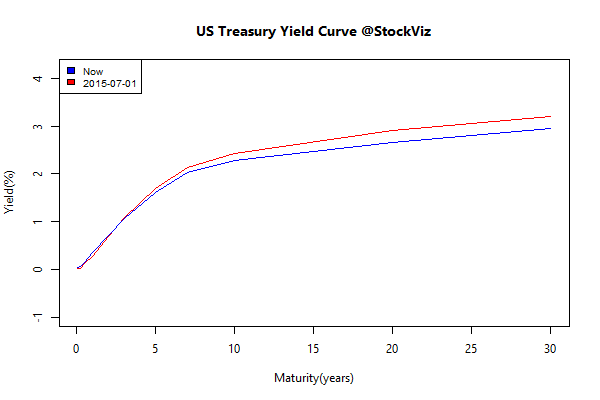
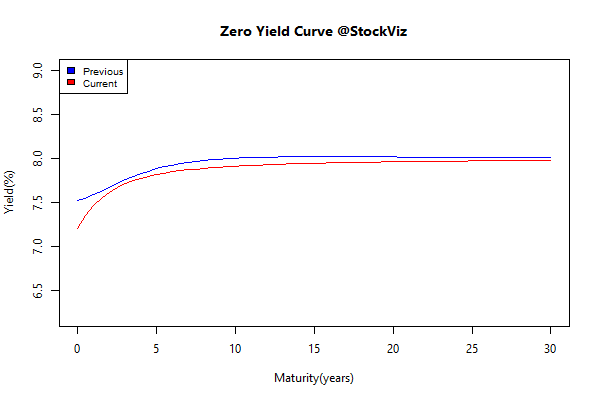
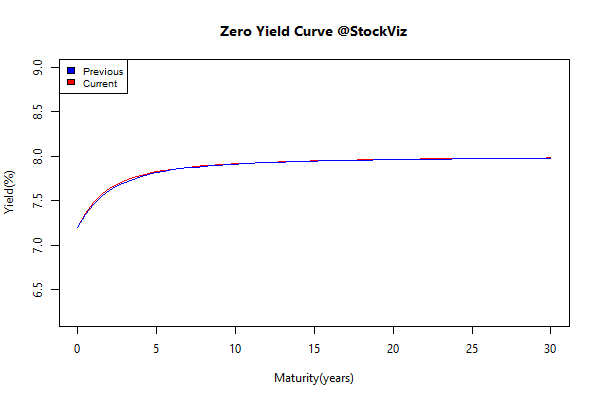
Yield Curve
Bond Indices
| Sub Index | Change in YTM | Total Return(%) |
|---|---|---|
| 0 5 | +0.03 | +0.11% |
| 5 10 | +0.01 | +0.08% |
| 10 15 | -0.03 | +0.33% |
| 15 20 | -0.02 | +0.33% |
| 20 30 | -0.02 | +0.30% |
The Gilt market ended flat…
Investment Theme Performance
| Next Trillion | +6.89% |
| Financial Strength Value | +6.74% |
| High Beta | +5.45% |
| Magic Formula | +5.26% |
| Quality to Price | +4.94% |
| Low Volatility | +2.85% |
| Balance Sheet Strength | +2.57% |
| PPFAS Long Term Value | +2.52% |
| ASK Life | +2.31% |
| Tactical CNX 100 | +1.72% |
| CNX 100 Enterprise Yield | +1.10% |
| The RBI Restricted List | +0.90% |
| ADAG stocks | +0.85% |
| Momentum | +0.66% |
Was a good week for most investment strategies…
Equity Mutual Funds
Bond Mutual Funds
Thought for the weekend
The benchmark tail wags the portfolio management dog. Benchmarks were supposed to be the foundation for understanding a portfolio manager’s performance after the fact. Instead the investment industry evolved so that benchmarks are now the navigational compass for investment managers before the fact.
Only way to remedy this is to earn AUM through performance, not marketing. A majority of an asset manager’s time should be spent on research, not giving presentations to third parties.
Source: Alpha Wounds: Benchmark Tail Wags the Portfolio Management Dog