Category: Your Money

Weekly Recap: Single-Variable Analysis

Equities

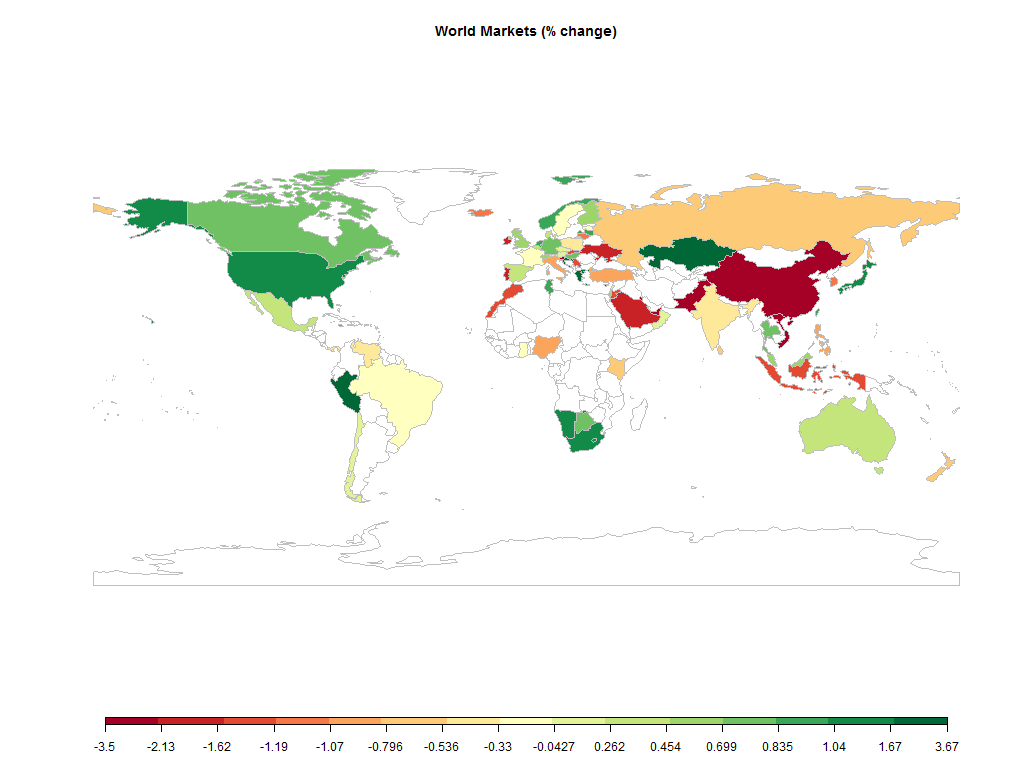
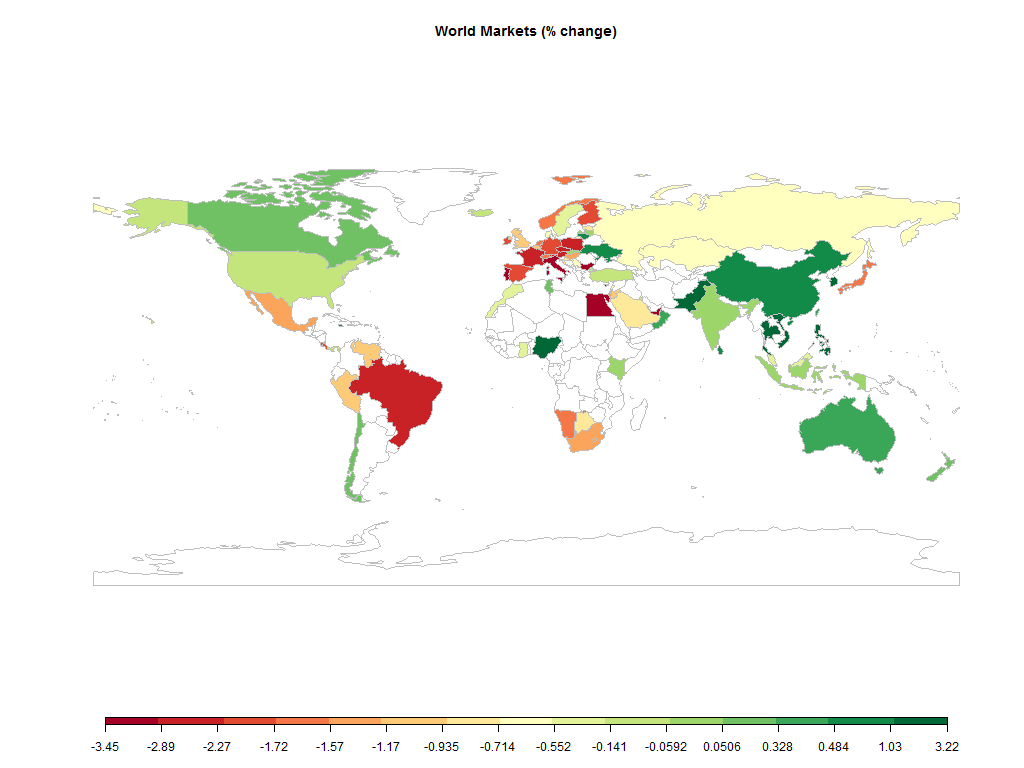
world.2014-06-20.2014-06-27

The Nifty ended flat for the week.

Major
DAX(DEU) -1.72%
CAC(FRA) -2.30%
UKX(GBR) -0.99%
NKY(JPN) -1.66%
SPX(USA) -0.07%
MINTs
JCI(IDN) -0.05%
INMEX(MEX) -1.19%
NGSEINDX(NGA) +2.57%
XU030(TUR) -0.10%
BRICS
IBOV(BRA) -2.82%
SHCOMP(CHN) +0.49%
NIFTY(IND) -0.04%
INDEXCF(RUS) -0.60%
TOP40(ZAF) -1.48%

Commodities

Energy
Brent Crude Oil -1.19%
Ethanol +1.34%
Heating Oil -1.65%
Natural Gas -2.05%
RBOB Gasoline -0.79%
WTI Crude Oil -1.44%
Metals
Copper +0.96%
Gold 100oz +0.05%
Palladium +2.27%
Platinum +1.59%
Silver 5000oz -0.48%

Currencies

USDEUR:-0.42% USDJPY:-0.71%

MINTs
USDIDR(IDN) +0.18%
USDMXN(MEX) -0.23%
USDNGN(NGA) -0.09%
USDTRY(TUR) -0.82%
BRICS
USDBRL(BRA) -1.78%
USDCNY(CHN) -0.12%
USDINR(IND) -0.17%
USDRUB(RUS) -2.16%
USDZAR(ZAF) -0.88%
Agricultural
Cattle +3.71%
Cocoa +1.17%
Coffee (Arabica) -2.02%
Coffee (Robusta) +1.76%
Corn -1.94%
Cotton -8.32%
Feeder Cattle +3.80%
Lean Hogs +2.27%
Lumber +3.05%
Orange Juice -9.38%
Soybean Meal +3.00%
Soybeans +1.71%
Sugar #11 -5.08%
Wheat -0.21%
White Sugar -2.30%

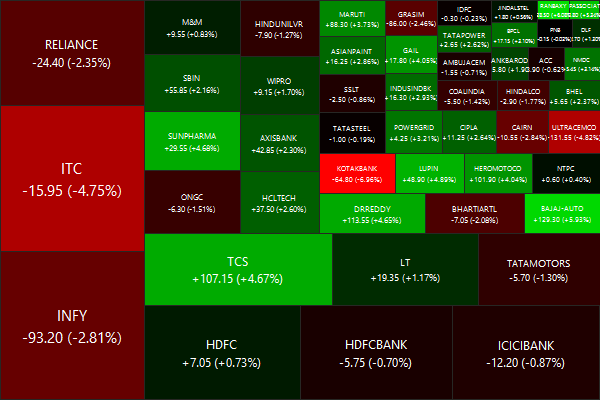
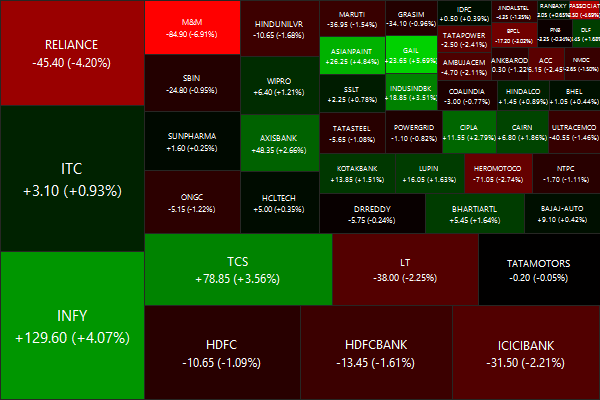
Nifty heatmap

CNX NIFTY.2014-06-20.2014-06-27

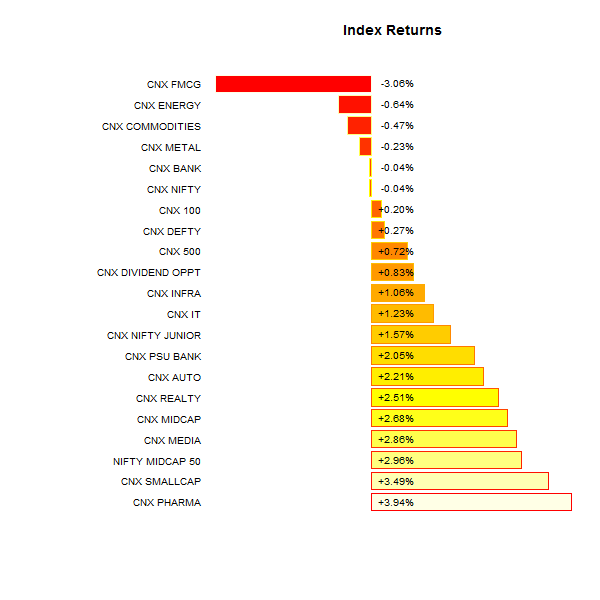
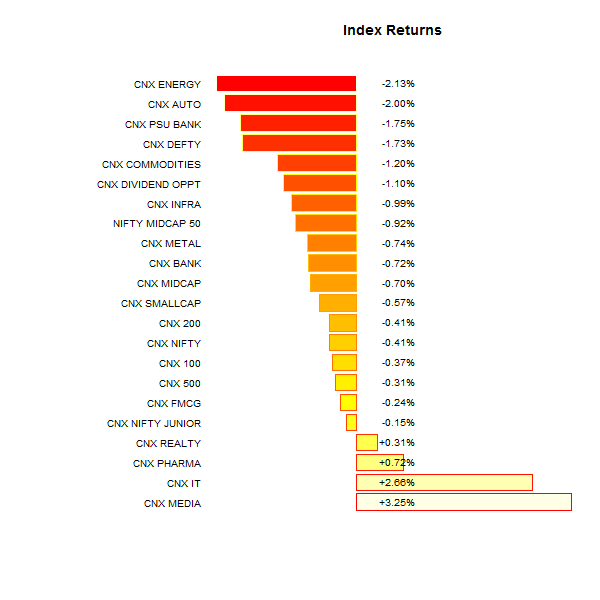
Index returns

indexperformance.2014-06-20.2014-06-27

Top winners and losers

FEDERALBNK +6.45%
DIVISLAB +8.55%
BOSCHLTD +9.92%
MCDOWELL-N -7.08%
KOTAKBANK -6.96%
IDEA -6.01%
A mixed bag, but Bosch was on fire this week!

ETFs

BANKBEES +2.90%
JUNIORBEES +1.34%
PSUBNKBEES +0.04%
NIFTYBEES -0.18%
GOLDBEES -0.33%
INFRABEES -4.78%
Banks got back on the saddle…

Investment Theme Performance

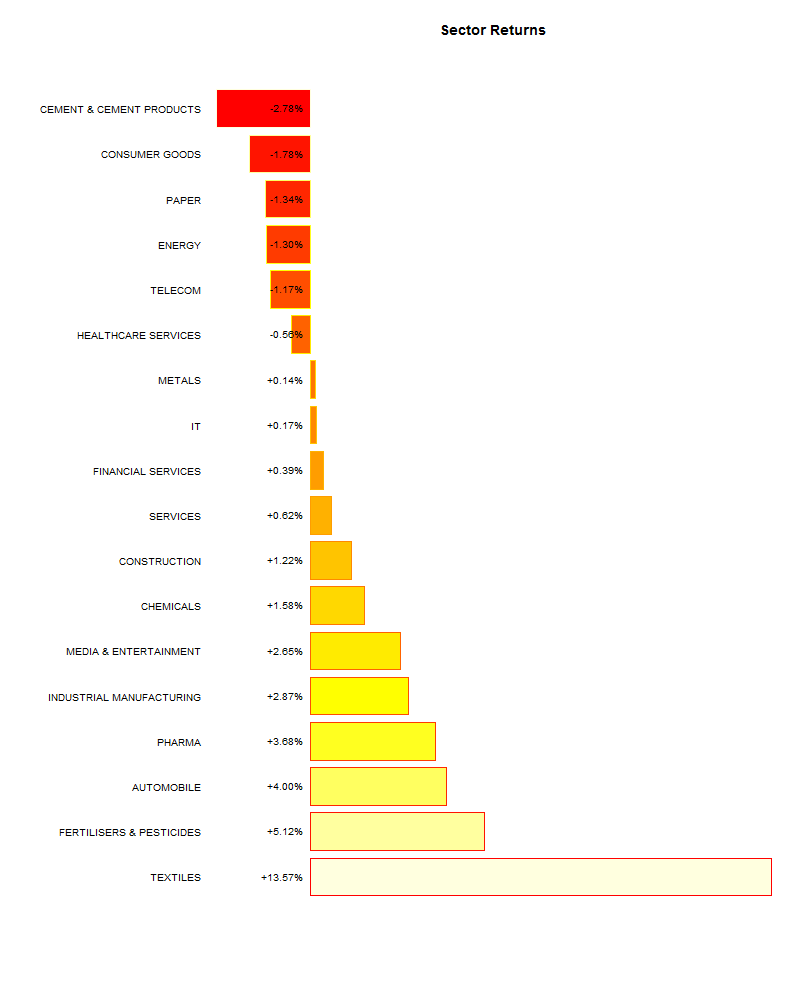
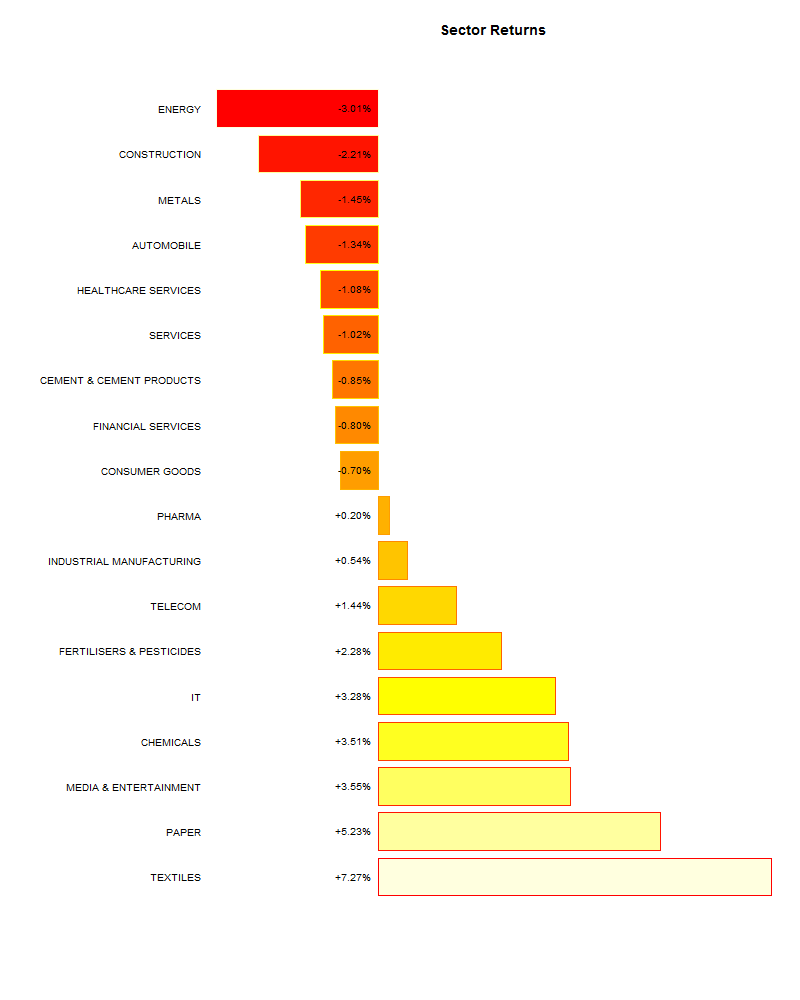
Sector Performance

sectorperformance.2014-06-20.2014-06-27

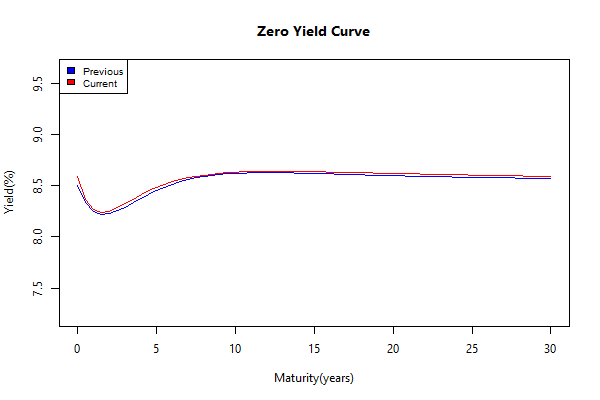
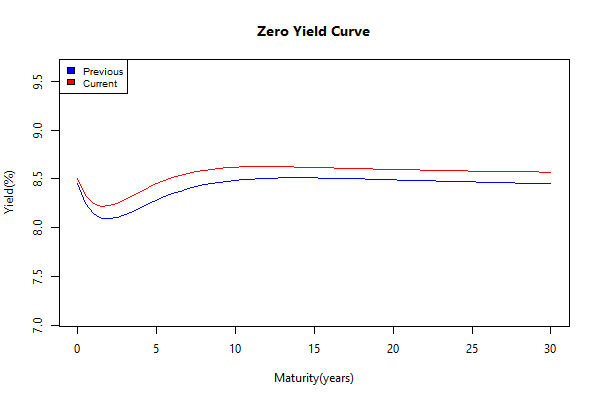
Yield Curve

yieldCurve.2014-06-20.2014-06-27

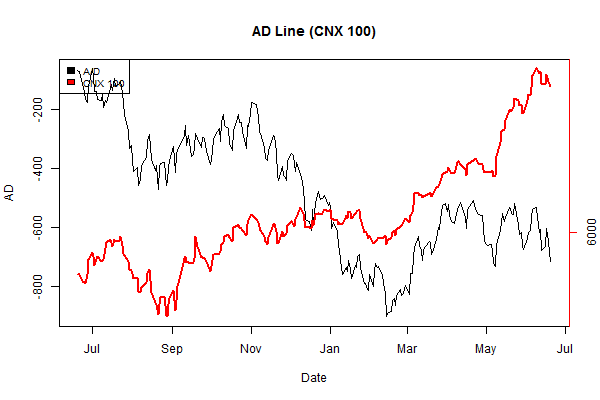
Advance Decline

advance.decline.line2.2014-06-20.2014-06-27

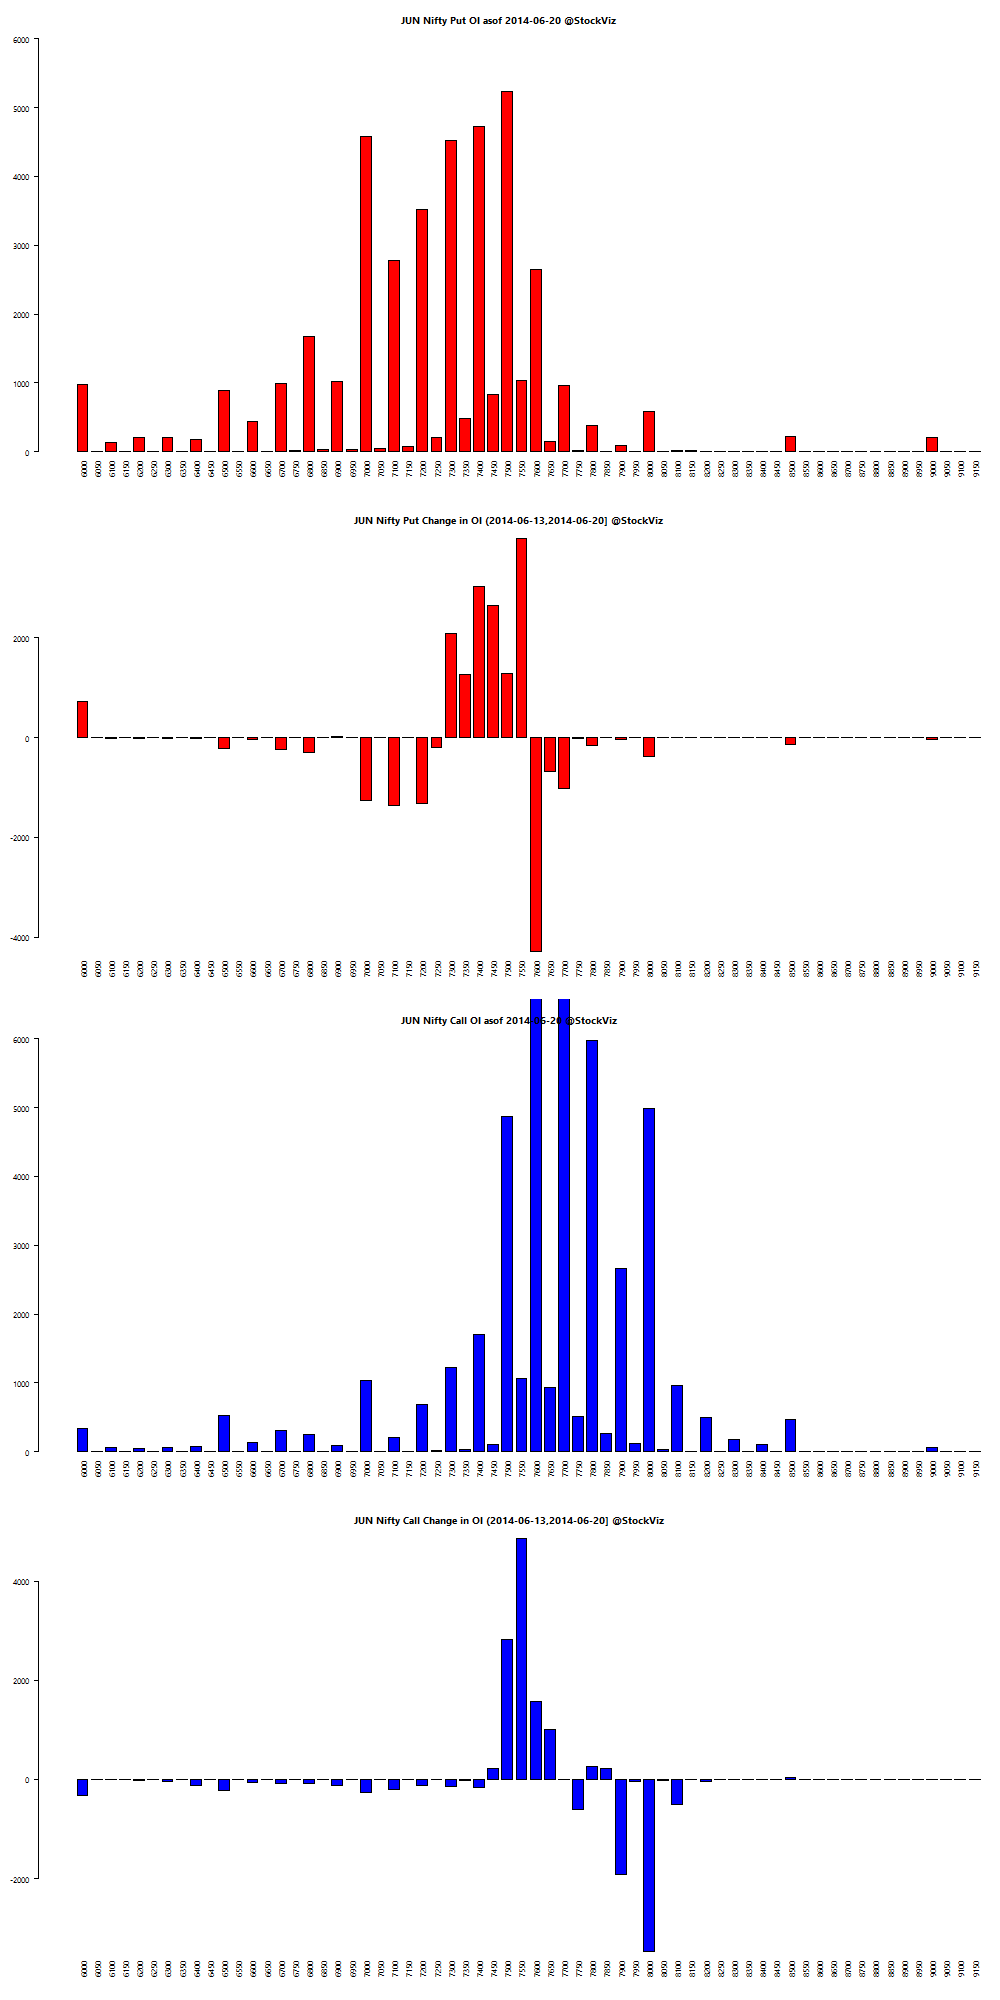
Nifty OI

nifty.puts.calls.JUL.2014-06-20.2014-06-27

Thought for the Weekend

The behavior of markets or economies simply can’t be explained by looking at just one thing. conomies and markets are extremely complex. They have a variety of different inputs, including earnings, interest rates, psychology, economic activity, fund flows, taxes, sentiment, momentum, geopolitics, etc. The relevant significance of all of these inputs varies over time.

Source: When Correlations Lie

Related: Musings on stock-market forecasts

Covered Call Strategy Cheat Sheet

Paper from the brain-trust at AQR Capital Management: Covered Calls and Their Unintended Reversal Bet is a must read for anybody trading options.

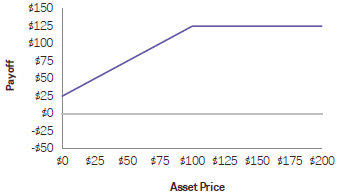
Simply put, a covered call is when you own the underlying stock and you sell a call on it. If the stock doesn’t go beyond the strike at which you sold the call, then you pocket the premium. Otherwise, your upside on owning the stock is capped at the strike.

The payoff diagram of a covered call looks like this:

covered call payoff

The authors claim that over a quarter of a covered call’s risk may be attributed to market timing and investors are ignoring its effect on returns.

Because a covered call option strategy reflects an underlying position in equity (delta = 1) and being short a call with changing delta, we get the following situation:

  1. Baseline situation: equity delta = 1.0 and short call position delta = -0.5; net 0.5 delta
  2. In a falling market environment: equity delta = 1.0 and short call position delta = -0.25; net 0.75 delta, or higher market exposure
  3. In a rising market environment: equity delta = 1.0 and short call position delta = -0.75; net 0.25 delta, or lower market exposure

The insight: a covered call strategy embeds elements of a reversal strategy, not a trend-following strategy.

The cheat sheet

  1. Bearish on volatility? Don’t do a covered call.
  2. Bearish on the market? Don’t do a covered call.
  3. Like trend-following? Don’t do a covered call.

Sources

  • Covered Calls and Their Unintended Reversal Bet (pdf)
  • Own the Stock and Sell Calls: Guaranteed Win, Right? (AlphaArchitect)

Themes and Smart Beta

From Research Affiliates’ Slugging It Out in the Equity Arena:

The Gap

There is a huge gap between reported mutual fund performance and the returns actually earned by the average investor. The gap — the difference between the fund’s total time-weighted return and the average investor’s money-weighted return — reflects the value added (or subtracted) by investors’ decisions to move cash into and out of funds. In other words, the gap is the return impact of investors’ market timing decisions.

Over the past 10 years, the average investor earned a return that was 2.5% worse than the return of the average fund they invested in!

Procyclical vs. Countercyclical

Smart beta strategies – Themes – are countercyclical, periodically rebalancing out of winning stocks and into losers. They may underperform for extended periods but they ultimately tend to prevail.

Investors’ procyclical behavior, selling recent losers and buying recent winners, pays for the long-term value added by Themes.

Source: Slugging It Out in the Equity Arena

To see how Themes have performed, follow the trail: http://stockviz.biz/tag/theme/
Weekly Recap: Hard Work ≠ Value

Equities

world equity markets 2014-06-13.2014-06-20

Major
DAX(DEU) +0.75%
CAC(FRA) -0.04%
UKX(GBR) +0.70%
NKY(JPN) +1.67%
SPX(USA) +1.46%
MINTs
JCI(IDN) -1.60%
INMEX(MEX) +0.42%
NGSEINDX(NGA) -0.93%
XU030(TUR) -0.91%
BRICS
IBOV(BRA) -0.27%
SHCOMP(CHN) -2.13%
NIFTY(IND) -0.41%
INDEXCF(RUS) -0.70%
TOP40(ZAF) +1.16%

Commodities

Energy
Brent Crude Oil +1.24%
Ethanol -3.01%
Heating Oil +2.02%
Natural Gas -3.72%
RBOB Gasoline +2.02%
WTI Crude Oil +0.36%
Metals
Copper +2.97%
Gold 100oz +3.15%
Palladium +0.90%
Platinum +1.54%
Silver 5000oz +7.18%

Currencies

USDEUR:-0.47% USDJPY:+0.05%

MINTs
USDIDR(IDN) +1.50%
USDMXN(MEX) -0.08%
USDNGN(NGA) -0.26%
USDTRY(TUR) +1.01%
BRICS
USDBRL(BRA) +0.01%
USDCNY(CHN) +0.24%
USDINR(IND) +0.69%
USDRUB(RUS) +0.18%
USDZAR(ZAF) -0.32%
Agricultural
Cattle +0.19%
Cocoa -0.41%
Coffee (Arabica) -0.54%
Coffee (Robusta) +0.30%
Corn +1.57%
Cotton +1.51%
Feeder Cattle -0.55%
Lean Hogs +10.36%
Lumber +6.89%
Orange Juice -3.87%
Soybean Meal -0.39%
Soybeans -0.60%
Sugar #11 +5.23%
Wheat +0.04%
White Sugar +5.72%

Nifty heatmap

CNX NIFTY.2014-06-13.2014-06-20

Index Returns

index performance.2014-06-13.2014-06-20

Top winners and losers

UPL +5.34%
GAIL +5.69%
ZEEL +6.92%
SRTRANSFIN -7.39%
M&M -6.91%
GODREJCP -6.39%
Churn, churn, churn…

ETFs

INFRABEES +6.21%
GOLDBEES +3.87%
JUNIORBEES -0.40%
BANKBEES -0.53%
NIFTYBEES -0.89%
PSUBNKBEES -2.01%
Gold finally caught a break…

Investment theme performance

Sector Performance

Textiles – the winning streak continued.

sector performance.2014-06-13.2014-06-20

Yield Curve

yield Curve.2014-06-13.2014-06-20

Advance Decline

advance.decline.line2.2014-06-13.2014-06-20

Nifty OI

nifty.puts.calls.2014-06-13.2014-06-20

Thought for the weekend

When we work hard for something, thereby “earning” it, we can ascribe a higher value to it than may be justified. A form of egotism affects how we value the “trophy.”

Source: Trophy Effect

Related: Ego: The Single Biggest Impediment to Successful Investing

Ego: The Single Biggest Impediment to Successful Investing

From Why Inexperienced Investors Do Not Learn: They Do Not Know Their Past Portfolio Performance (Glaser, Weber)

A necessary condition to learn is that investors actually know what happened in the past and that the views of the past are not biased. Investors are hardly able to give a correct estimate of their own past realized stock portfolio performance. People overrate themselves. On average, investors think, that they are better than others.

Here’s a telling chart on what investors “thought” they made vs what they actually made:

realized vs estimated returns

I loved the academic euphemism for “most investors are clueless”: The correlation coe±cient between return estimates and realized returns is not distinguishable from zero. And this gem: The correlation between self ratings and actual performance is also not distinguishable from zero.

Read the whole thing here (pdf) and open a StockViz account and start tracking your portfolio now!