Category: Your Money

Weekly Recap: Is e-commerce a head-fake?

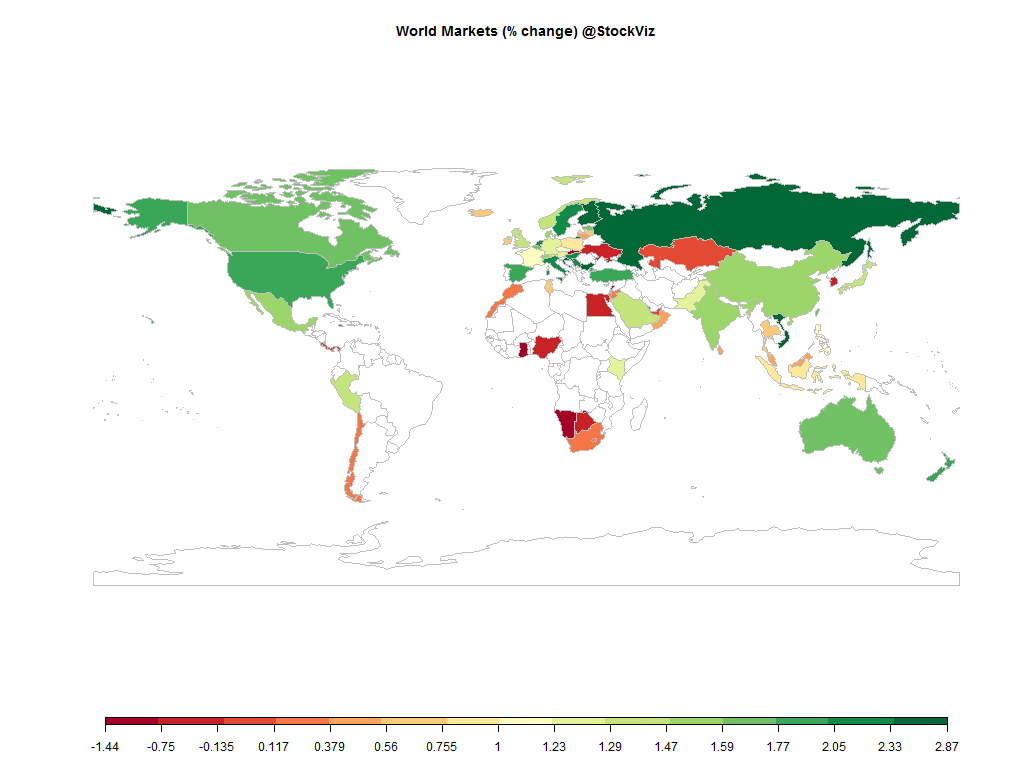
world equity markets 2014-08-14.2014-08-22

Equities

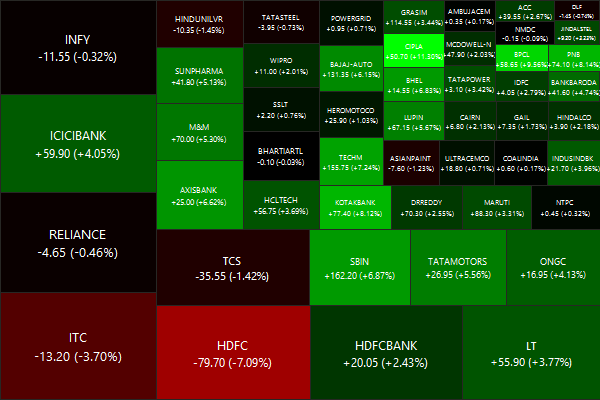
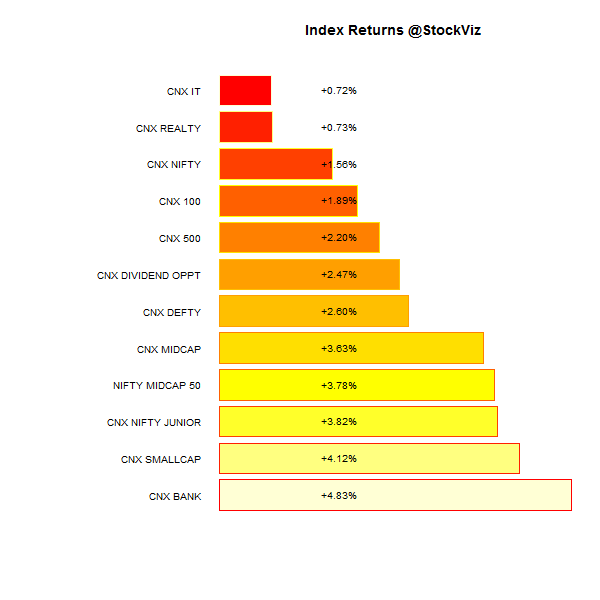
The Nifty ended the week +1.56% (+2.60% in USD terms.)

Major
DAX(DEU) +1.24%
CAC(FRA) +1.13%
UKX(GBR) +1.35%
NKY(JPN) +1.47%
SPX(USA) +1.83%
MINTs
JCI(IDN) +0.84%
INMEX(MEX) +1.55%
NGSEINDX(NGA) -0.45%
XU030(TUR) +1.79%
BRICS
IBOV(BRA) +4.95%
SHCOMP(CHN) +1.56%
NIFTY(IND) +1.56%
INDEXCF(RUS) +2.50%
TOP40(ZAF) +0.14%

Commodities

Energy
Brent Crude Oil +0.25%
Ethanol -0.74%
Heating Oil +0.36%
Natural Gas -1.71%
RBOB Gasoline +2.71%
WTI Crude Oil -2.23%
Metals
Copper +3.90%
Gold 100oz -2.44%
Palladium +0.54%
Platinum -3.10%
Silver 5000oz -2.02%

Currencies

USDEUR:+0.92% USDJPY:+1.42%

MINTs
USDIDR(IDN) -0.05%
USDMXN(MEX) +0.38%
USDNGN(NGA) -0.25%
USDTRY(TUR) +1.08%
BRICS
USDBRL(BRA) +0.47%
USDCNY(CHN) -0.00%
USDINR(IND) -0.49%
USDRUB(RUS) +0.48%
USDZAR(ZAF) +1.35%
Agricultural
Cattle +1.57%
Cocoa -0.77%
Coffee (Arabica) -1.41%
Coffee (Robusta) +2.16%
Corn +0.62%
Cotton +5.75%
Feeder Cattle +0.71%
Lean Hogs -18.68%
Lumber +2.62%
Orange Juice -2.15%
Soybean Meal -3.84%
Soybeans -8.63%
Sugar #11 -2.01%
Wheat +2.38%
White Sugar -1.00%

Credit Indices

Index Change
Markit CDX EM +0.16%
Markit CDX NA HY +0.31%
Markit CDX NA IG -2.67%
Markit CDX NA IG HVOL -5.81%
Markit iTraxx Asia ex-Japan IG -3.49%
Markit iTraxx Australia -2.86%
Markit iTraxx Europe -5.03%
Markit iTraxx Europe Crossover -19.04%
Markit iTraxx Japan -2.98%
Markit iTraxx SovX Western Europe -3.37%
Markit LCDX (Loan CDS) +0.06%
Markit MCDX (Municipal CDS) -2.40%
It was a good week for the markets. Both equities and credit did well. Longs ended strong!

Nifty Heatmap

CNX NIFTY.2014-08-14.2014-08-22

Index Returns

index performance.2014-08-14.2014-08-22

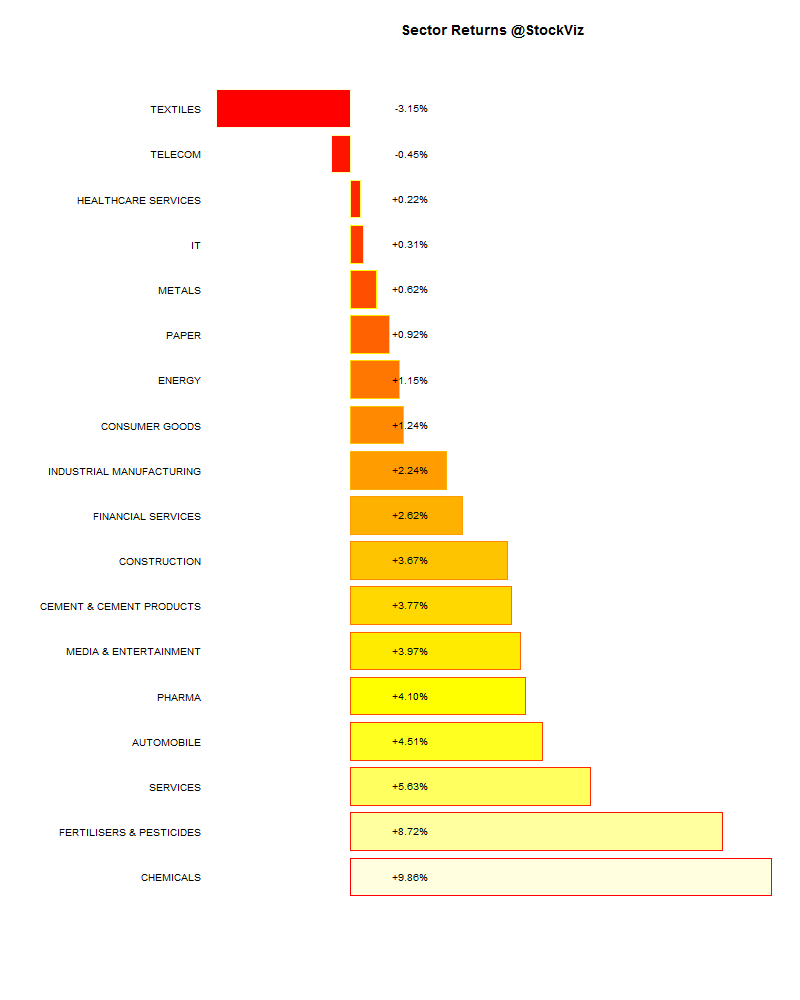
Sector Performance

sector performance.2014-08-14.2014-08-22

Advance Decline

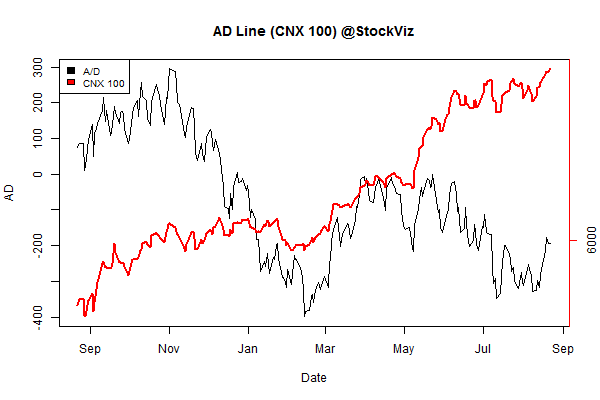
advance.decline.line2.2014-08-14.2014-08-22

Market cap decile performance

Decile Mkt. Cap. Adv/Decl
1 +2.25% 69/66
2 +6.22% 78/57
3 +4.32% 77/56
4 +5.44% 79/57
5 +6.02% 77/57
6 +5.75% 77/58
7 +4.54% 74/61
8 +4.98% 73/61
9 +3.68% 77/58
10 +1.97% 69/66
An across the board rally is quite a sight!

Top Winners and Losers

HINDPETRO +10.63%
CIPLA +11.30%
UNIONBANK +14.86%
HDFC -7.09%
INFRATEL -4.65%
ITC -3.70%
Banks and pharma did well this week…

ETFs

PSUBNKBEES +5.21%
BANKBEES +4.66%
JUNIORBEES +3.60%
NIFTYBEES +1.57%
INFRABEES +0.91%
GOLDBEES -2.05%
PSU Banks finally put in an up week…

Investment Theme Performance

All strategies in the green. Confirms what the market decile performance scan showed…

Yield curve

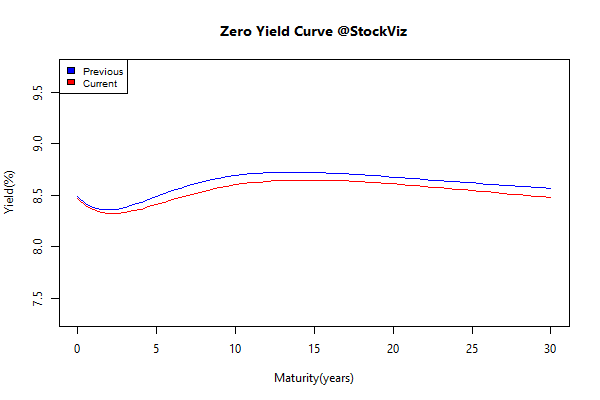
yield Curve.2014-08-14.2014-08-22

Bond Indices

Sub Index Change in YTM Total Return(%)
GSEC TB -0.05 +0.20%
GSEC SUB 1-3 -0.14 -0.01%
GSEC SUB 3-8 -0.05 +0.20%
GSEC SUB 8 -0.03 -0.27%
This is interesting: Franklin Templeton bought a record Rs 16,000-crore government securities in a day. (ET)

August Nifty OI

nifty.puts.calls.AUG.2014-08-14.2014-08-22

August BankNifty OI

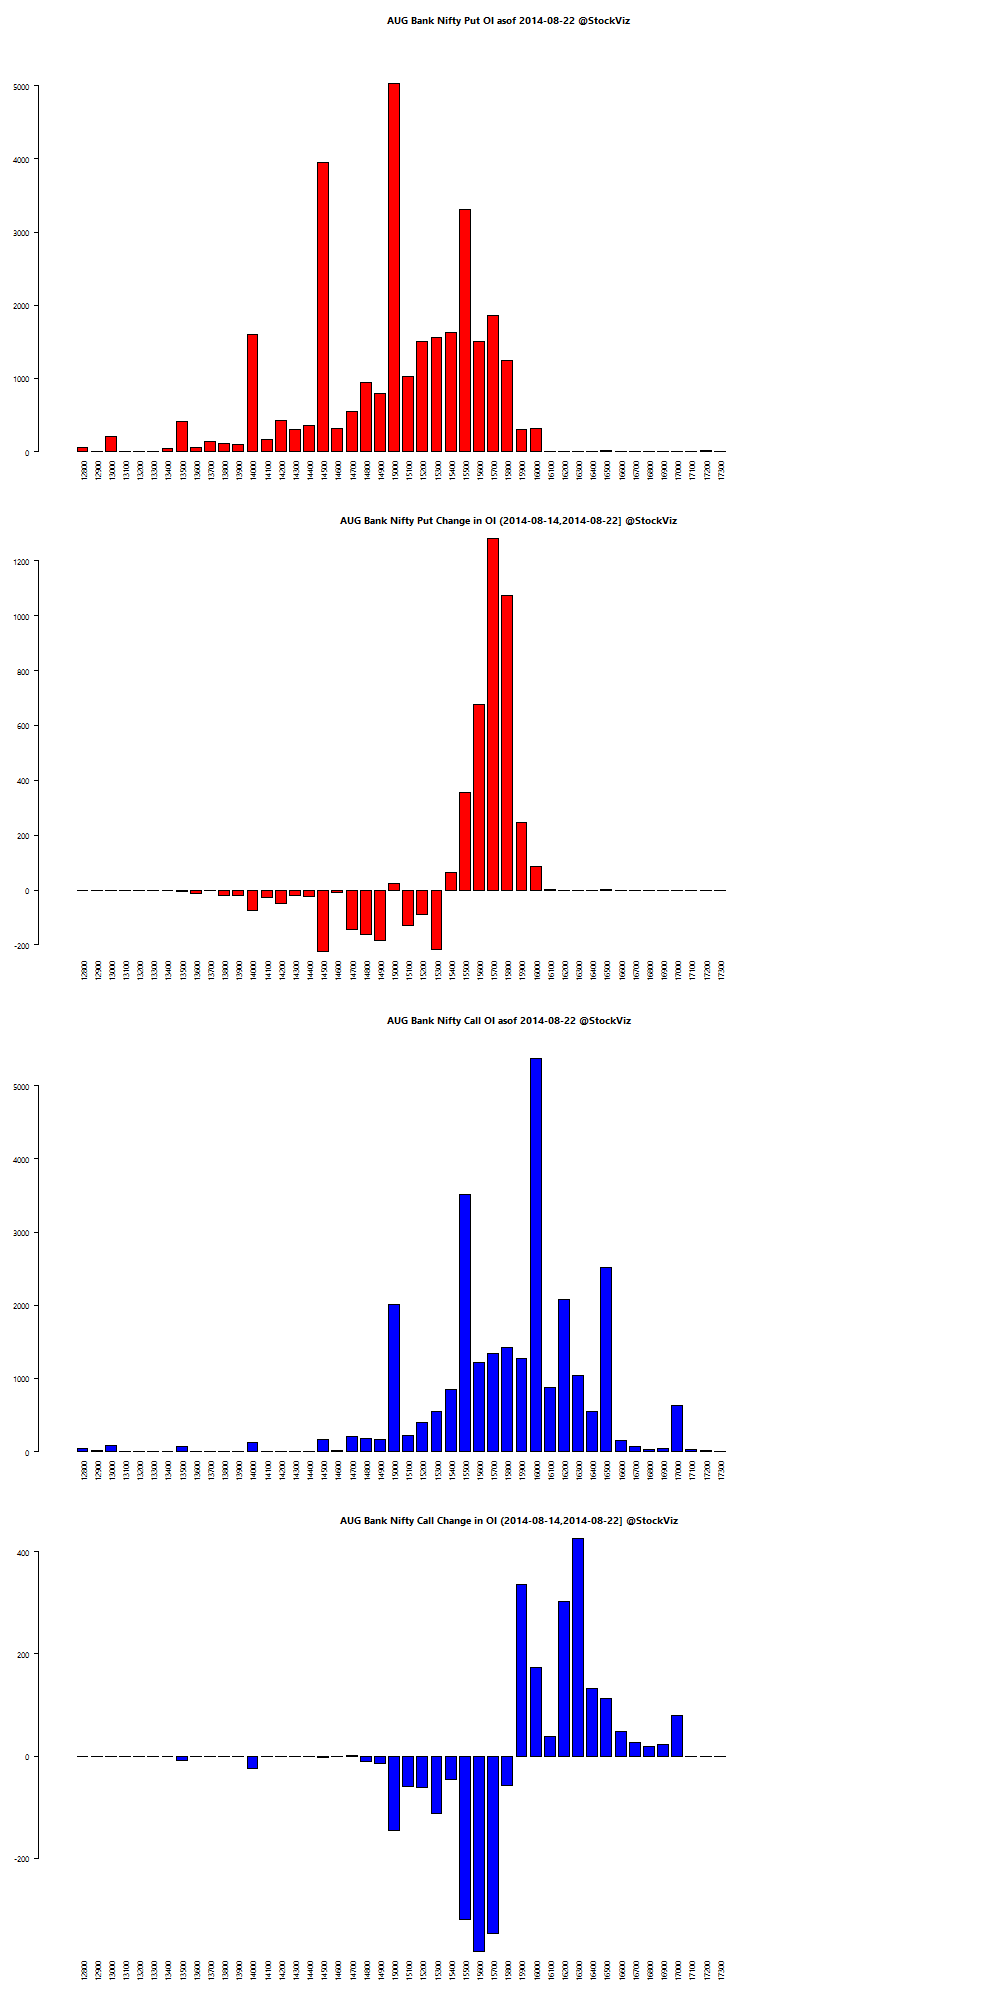
bank-nifty.puts.calls.AUG.2014-08-14.2014-08-22

Thought for the weekend

E-commerce operations aren’t as cheap to run as most people think. Their economics greatly resemble those of mail order catalogs and they aren’t all favorable. E-commerce companies ship to customers from large, expensive, highly productive fulfillment centers. A state-of-the-art center can cost $250 million or more to build, or about 10 times as much as a big box store. And competition is growing while growth is slowing.

US E-Commerce Growth

Source: Online Shopping Isn’t as Profitable as You Think (HBR)

Do Superstitious Traders Lose Money?

Found an interesting paper (scribd embed below) where the authors hypothesize that superstition may be a symptom of a general cognitive disability in making financial decisions.

The authors constructed a “superstition index” and bucketed traders based on their trading activity in the Taiwan Futures Exchange. They found that the superstitious individuals (the top-quintile of the superstition index) under-perform their non-superstitious counterparts (the bottom-quintile of the superstition index) by 1.6 basis points within a trading day. The under-performance widens to 2.4 basis points for one day and 6.3 basis points for five days after the transactions.

Here’s an odd titbit: Did you know that India’s Independence Day falls a day after Pakistan’s because astrologers in India insisted that August 14, 1947, was an inauspicious day to become independent?

IPOs: A Performance Update

We are not big fans of IPOs at StockViz (here, here). As an asset class, they are a bit like playing chutes-and-ladders. Even if you manage to roll into a few ladders, there are plenty of chutes that can take you down to zero.

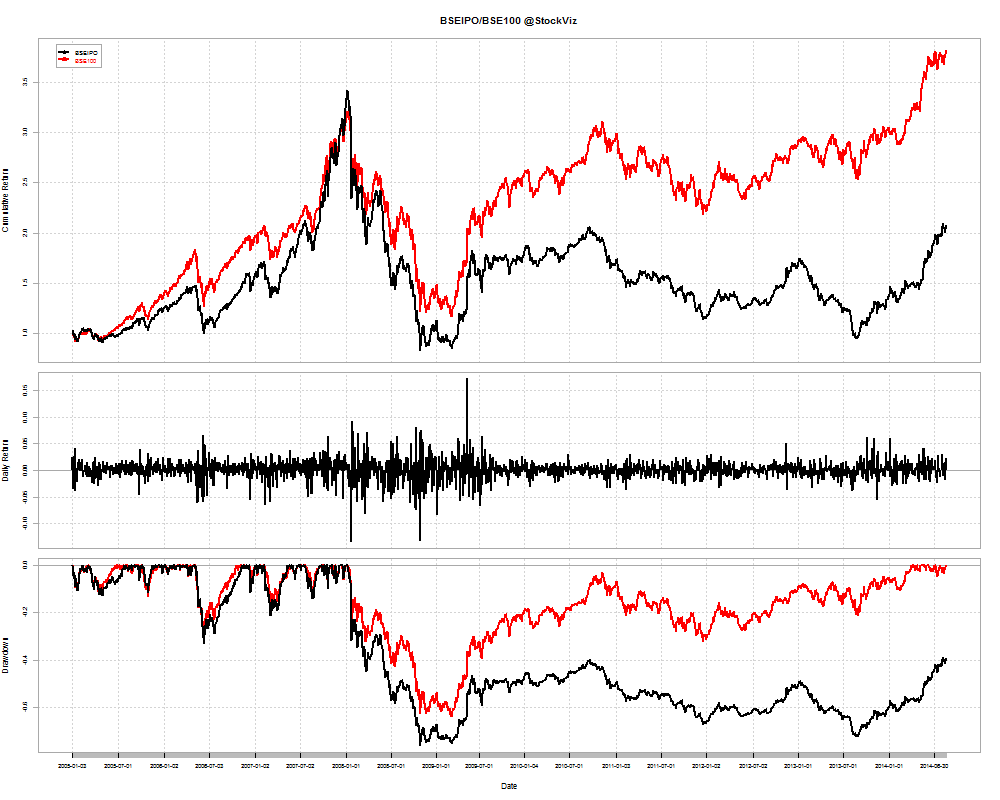
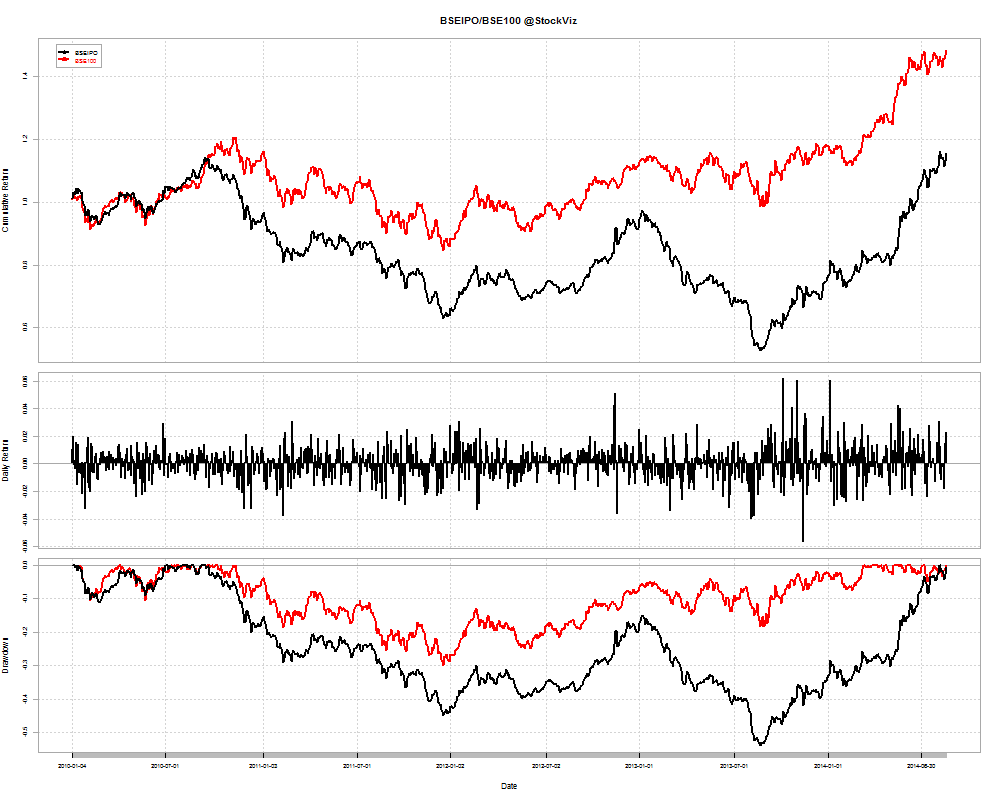
To see if IPOs make sense as an investment, you should compare their returns to a broader index. On one hand, we have the S&P BSE IPO index that tracks the value of companies for two years after listing. And on the other, we have the BSE 100 index that tracks the top 100 stocks my market value. By comparing the returns of the two indices, we can get a fair idea of what we are getting into.

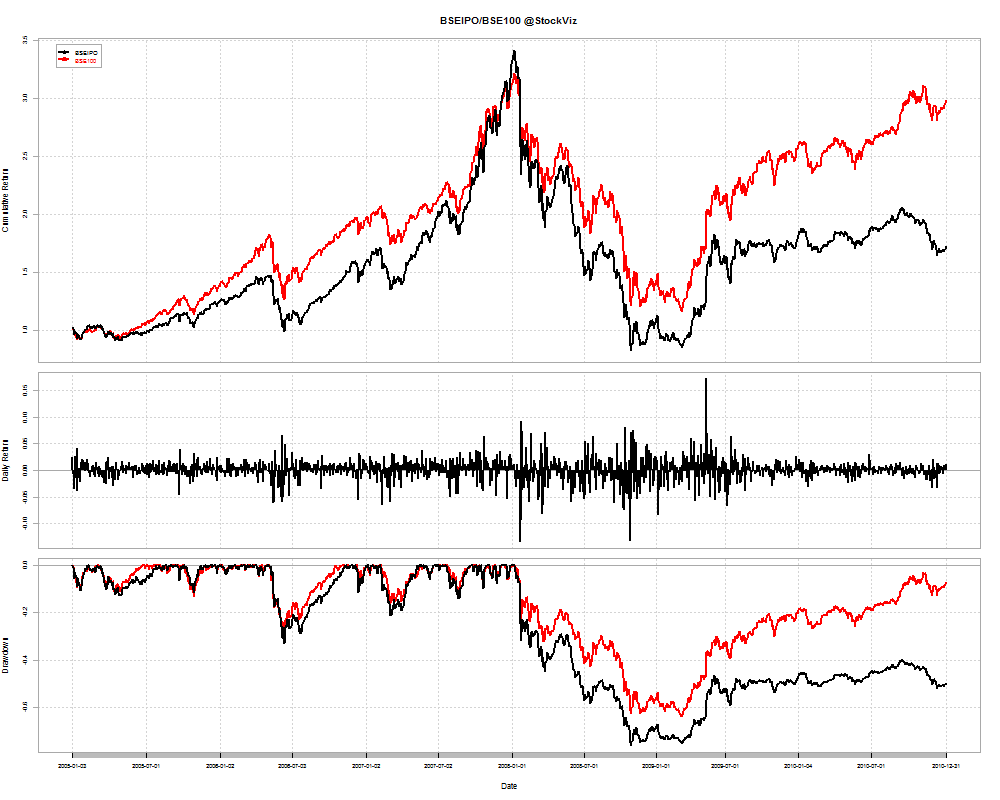
BSE IPO Index 2005-today

A buy-and-hold investor in the index at the beginning of 2005 would still be underwater after the bust of 2008. And to make matters worse, the BSE 100 index has trounced the IPO index.

BSEIPO-returns-c

BSE IPO Index 2005-2010

BSEIPO-returns-a

BSE IPO Index 2010-today

BSEIPO-returns-b

IPOs on NSE since 2013

8KMILES
2014-01-29
+130.05%
AGARIND
2014-05-26
-45.53%
AGRITECH
2014-01-28
-79.37%
ANKITMETAL
2013-03-14
-65.29%
ARCOTECH
2014-04-16
+109.74%
ATULAUTO
2013-06-26
+277.10%
BUTTERFLY
2014-04-28
-12.57%
CAPLIPOINT
2014-06-23
+123.21%
CASTROLIND
2014-03-14
+19.52%
CEREBRAINT
2013-06-26
-61.25%
CNOVAPETRO
2014-01-01
-9.73%
DUNCANSLTD
2013-07-05
+16.70%
FCEL
2013-07-04
+38.17%
FLFL
2013-10-01
-35.45%
GSCLCEMENT
2013-05-15
+71.76%
GULFCORP
2014-06-26
-13.61%
GULFOILLUB
2014-07-31
+17.04%
HATSUN
2014-06-20
+10.28%
IBULHSGFIN
2013-07-23
+38.09%
INTEGRA
2013-08-20
-64.66%
JPOLYINVST
2013-11-11
+40.20%
JUSTDIAL
2013-06-05
+183.46%
LYPSAGEMS
2013-11-05
+1.31%
MAKE
2014-06-30
+72.51%
MMWL
2014-03-26
+56.67%
MOHITIND
2013-03-14
-38.16%
NAKODA
2013-03-14
-58.05%
NATHBIOGEN
2014-01-28
+632.86%
NGCT
2013-11-12
-32.08%
NIBL
2013-04-09
+214.95%
ORBTEXP
2013-11-05
+112.96%
ORIENTCEM
2013-07-12
+105.70%
PFRL
2013-07-17
-33.22%
PILIND
2013-10-07
+230.77%
REPCOHOME
2013-04-01
+172.19%
SDBL
2014-03-18
-13.60%
SFCL
2013-10-24
+72.90%
SREEL
2014-01-01
-11.07%
SUJANATWR
2013-09-11
+103.87%
VIMALOIL
2013-05-21
+75.39%
VIVIDHA
2013-05-21
-3.51%
VMART
2013-02-20
+91.39%
WELENTRP
2014-07-11
+221.25%
WONDERLA
2014-05-09
+80.04%
The NSE does not have an IPO index. So we had a look at all the stocks listed since January 2013.

There have been twice as many winners as losers since 2013 and the chatter around the ‘IPO market heating up’ has been getting louder. However, investors would do well to keep the big picture in mind before jumping into that hot new IPO that their brokers are selling.

You can track the latest IPO news here.

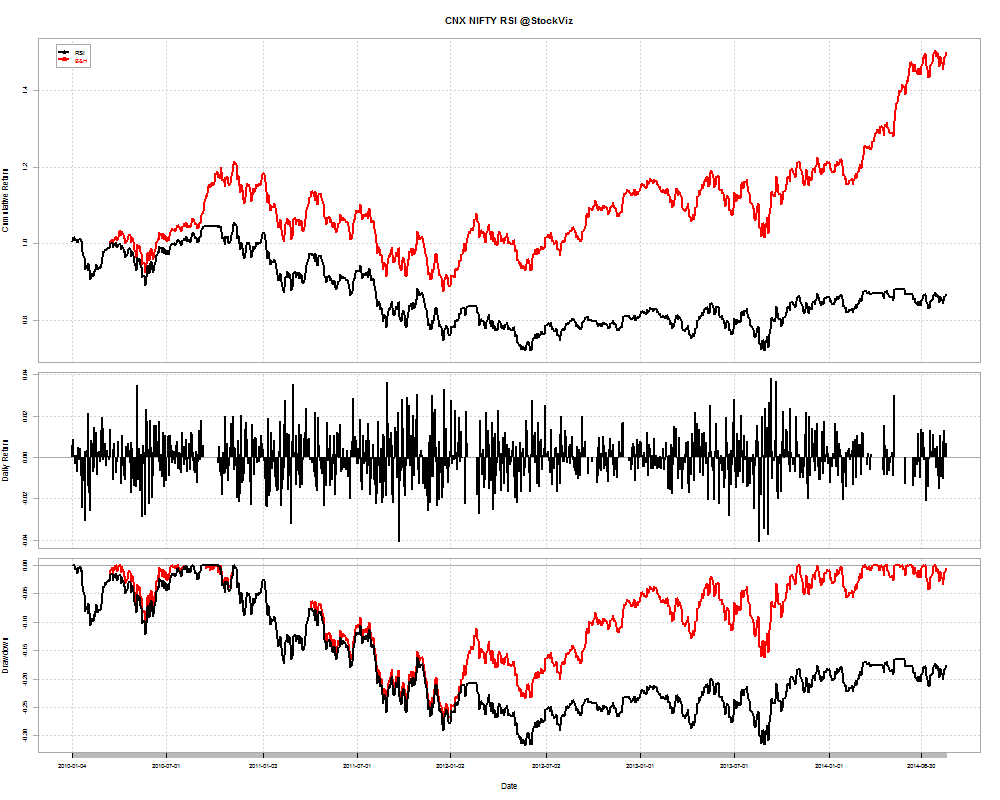
Two Relative Strength Index (RSI) Strategies that Do Not Work

Definition from StockCharts:

RSI oscillates between zero and 100. Traditionally, and according to Wilder, RSI is considered overbought when above 70 and oversold when below 30.

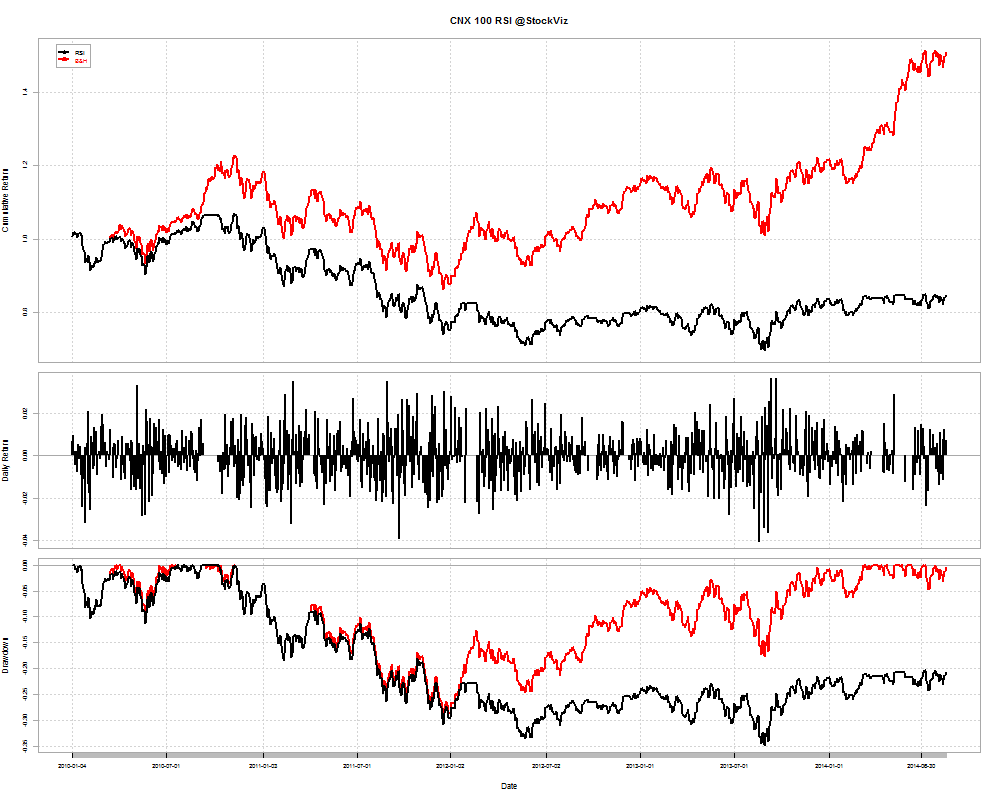
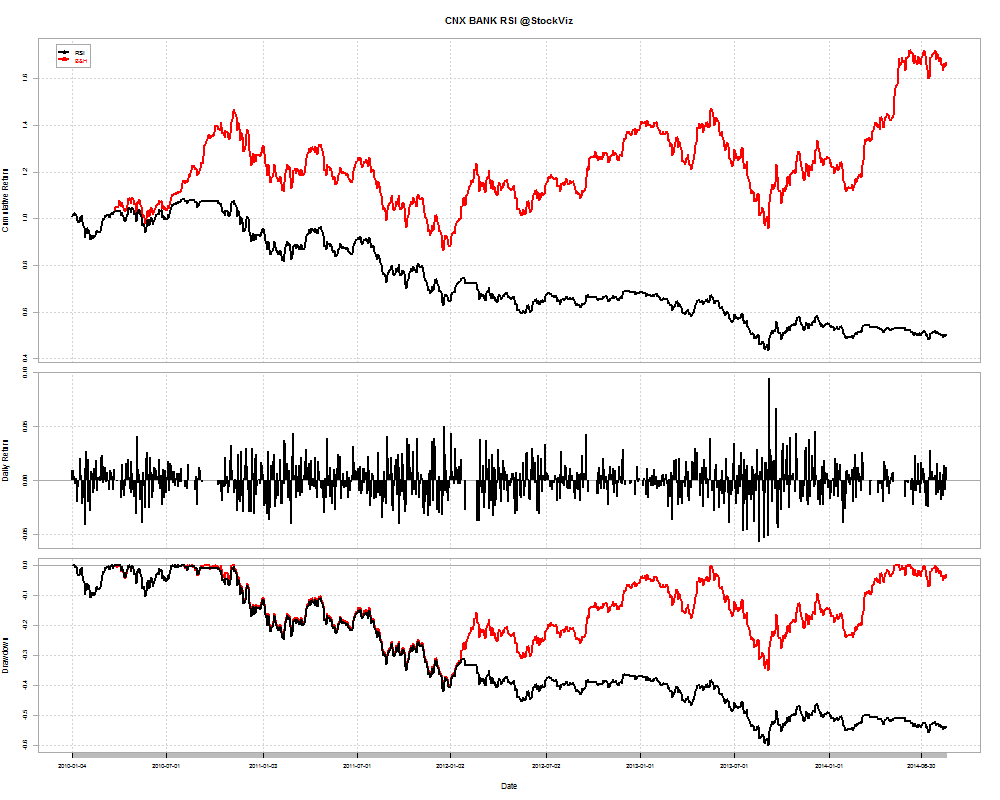
A naive implementation of it would be exit when RSI > 70. Lets see how it worked out vs. a simple buy-and-hold.

CNX 100-RSI-returns-2010

A simple B&H strategy was miles ahead of one that exited the market whenever RSI indicated “overbought.”

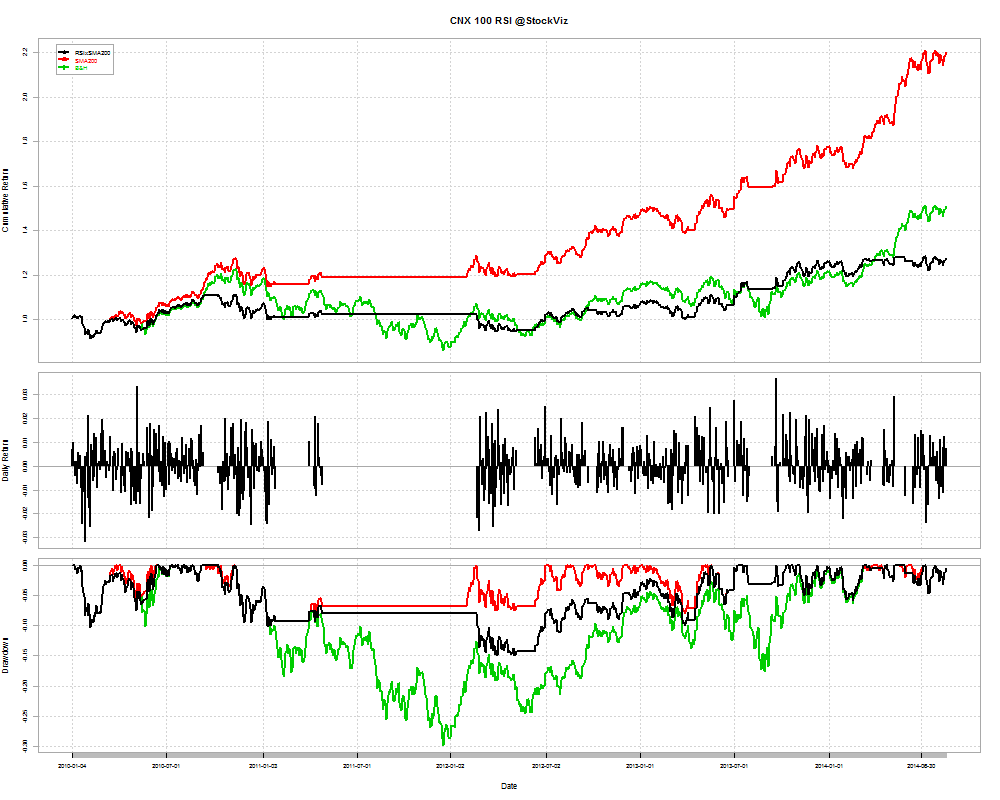
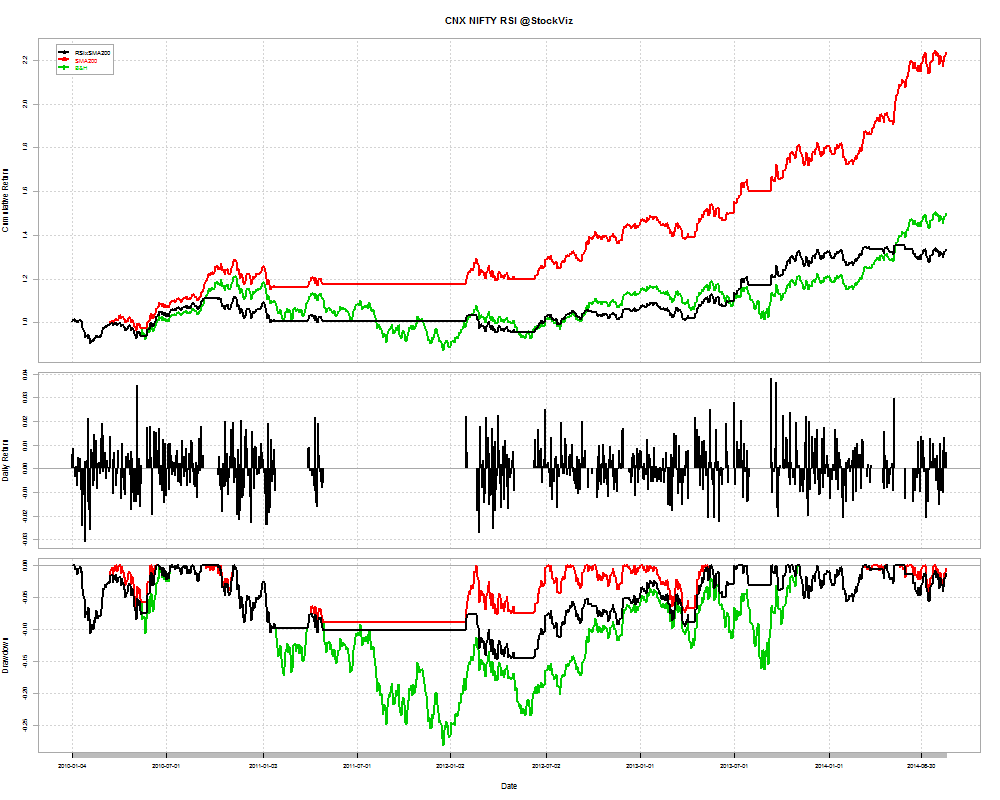
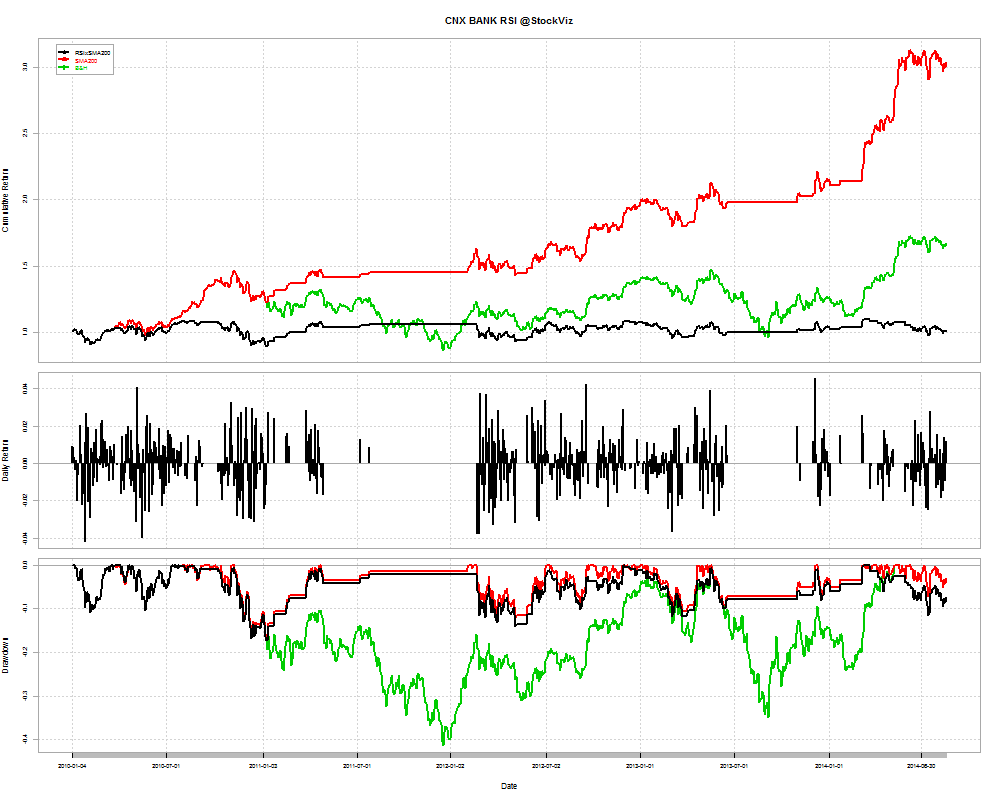
How about being long only when the index is an uptrend (> 200-day SMA) and RSI is not ‘overbought’ (< 70)?

CNX 100-RSIxSMA-returns-2010

Using RSI was a net negative – it under-performed both a buy-and-hold and a SMA-200 strategy.

Would it work on other indices?

NIFTY: NO

CNX NIFTY-RSI-returns-2010

CNX NIFTY-RSIxSMA-returns-2010

CNX BANK: NO

CNX BANK-RSI-returns-2010

CNX BANK-RSIxSMA-returns-2010

Conclusion

The naive RSI strategies described above are money losers. The gains are nowhere near enough to compensate for the losses. A simple buy-and-hold strategy ends up outperforming the RSI.

Weekly Recap: The 2% Mindset

world.2014-08-08.2014-08-14

The Nifty ended the week +2.95% (+3.79% in USD terms.)

Equities

Major
DAX(DEU) +0.92%
CAC(FRA) +0.64%
UKX(GBR) +1.85%
NKY(JPN) +3.65%
SPX(USA) +1.48%
MINTs
JCI(IDN) +1.88%
INMEX(MEX) +1.51%
NGSEINDX(NGA) -2.86%
XU030(TUR) -3.83%
BRICS
IBOV(BRA) +2.39%
SHCOMP(CHN) +1.47%
NIFTY(IND) +2.95%
INDEXCF(RUS) +5.27%
TOP40(ZAF) +1.21%

Commodities

Energy
Brent Crude Oil -1.13%
Ethanol +6.41%
Heating Oil -0.97%
Natural Gas -4.59%
RBOB Gasoline -1.68%
WTI Crude Oil -0.31%
Metals
Copper -2.21%
Gold 100oz -0.35%
Palladium +3.60%
Platinum -1.31%
Silver 5000oz -2.01%

Currencies

USDEUR:+0.07% USDJPY:+0.28%

MINTs
USDIDR(IDN) -0.86%
USDMXN(MEX) -1.25%
USDNGN(NGA) -0.36%
USDTRY(TUR) +1.02%
BRICS
USDBRL(BRA) -1.07%
USDCNY(CHN) -0.15%
USDINR(IND) -0.61%
USDRUB(RUS) +0.00%
USDZAR(ZAF) -0.62%
Agricultural
Cattle -1.08%
Cocoa +2.47%
Coffee (Arabica) +4.01%
Coffee (Robusta) +0.10%
Corn +3.91%
Cotton -0.81%
Feeder Cattle +1.05%
Lean Hogs -16.80%
Lumber +0.03%
Orange Juice +4.40%
Soybean Meal -2.39%
Soybeans -14.24%
Sugar #11 -1.30%
Wheat +0.82%
White Sugar -0.65%

Credit Indices

Index Change
Markit CDX EM +0.62%
Markit CDX NA HY +0.94%
Markit CDX NA IG -4.44%
Markit CDX NA IG HVOL -4.23%
Markit iTraxx Asia ex-Japan IG -5.10%
Markit iTraxx Australia -1.06%
Markit iTraxx Europe -3.07%
Markit iTraxx Europe Crossover -11.24%
Markit iTraxx Japan +1.25%
Markit iTraxx SovX Western Europe -1.44%
Markit LCDX (Loan CDS) -0.06%
Markit MCDX (Municipal CDS) -2.73%
It was definitely a “risk on” week that saw credit spreads narrow and almost all equity markets end in the green. However, Friday saw the US markets give up most of their gains on the news that Ukraine destroyed Russian military vehicles crossing border (Russia denied the report.) Something that the markets will be fixated on when they open on Monday.

Nifty Heatmap

CNX NIFTY.2014-08-08.2014-08-14

Index Returns

index performance.2014-08-08.2014-08-14

Sector Performance

sector performance.2014-08-08.2014-08-14

Advance Decline

advance.decline.line2.2014-08-08.2014-08-14

Market cap decile performance

Decile Mkt. Cap. Adv/Decl
1 (small) -4.44% 73/61
2 -4.14% 60/74
3 +0.07% 64/69
4 -0.04% 65/69
5 +0.03% 64/68
6 -0.93% 63/72
7 -0.34% 68/65
8 +0.13% 66/67
9 +0.67% 65/69
10 (mega) +2.85% 65/69
Large caps out-performance continued.

Top winners and losers

JSWSTEEL +10.32%
APOLLOHOSP +11.29%
TATAMOTORS +11.94%
RCOM -4.69%
BHEL -3.60%
HEROMOTOCO -3.13%
Tata Motors’ strategy of driving JLR mid/down market is working for now…

ETFs

NIFTYBEES +2.64%
BANKBEES +2.22%
INFRABEES +0.45%
JUNIORBEES -0.50%
GOLDBEES -0.76%
PSUBNKBEES -2.31%
PSU banks – when will the tide turn for them?

Investment Theme Performance

Flat, range-bound, large-cap market hasn’t been kind to investment strategies overweight midcaps…

Yield Curve

yield Curve.2014-08-08.2014-08-14

Bond Indices

Sub Index Change in YTM Total Return(%)
GSEC TB +0.21 +0.08%
GSEC SUB 1-3 -0.02 +0.32%
GSEC SUB 3-8 -0.29 +1.44%
GSEC SUB 8 -0.27 +1.95%
The curve’s inversion continued to steepen. Long bond yields continued to compress. With Rajan ruling out rate cuts anytime soon, is the bond market warning us of a slowdown in growth or is it projecting lower long-term inflation?

August Nifty OI

Both 7800 puts and 7900 calls were added.

nifty.puts.calls.AUG.2014-08-08.2014-08-14

August Bank Nifty OI

bank-nifty.puts.calls.AUG.2014-08-08.2014-08-14

Thought for the weekend

how the 2% think