Category: Your Money

The Golden Straitjacket

One of Thomas Friedman‘s theses states that individual countries must sacrifice some degree of economic sovereignty to global institutions, a situation he has termed the “golden straitjacket.”

From his book, The Lexus and the Olive Tree:

To fit into the Golden Straitjacket a country must either adopt, or be seen as moving toward, the following golden rules:

  1. making the private sector the primary engine of its economic growth,
  2. maintaining a low rate of inflation and price stability,
  3. shrinking the size of its state bureaucracy,
  4. maintaining as close to a balanced budget as possible, if not a surplus,
  5. eliminating and lowering tariffs on imported goods,
  6. removing restrictions on foreign investment,
  7. getting rid of quotas and domestic monopolies,
  8. increasing exports,
  9. privatizing state-owned industries and utilities,
  10. deregulating capital markets,
  11. making its currency convertible,
  12. opening its industries, stock and bond markets to direct foreign ownership and investment,
  13. deregulating its economy to promote as much domestic competition as possible,
  14. eliminating government corruption, subsidies and kickbacks as much as possible,
  15. opening its banking and telecommunications systems to private ownership and competition, and
  16. allowing its citizens to choose from an array of competing pension options and foreign-run pension and mutual funds.

When you stitch all of these pieces together you have the Golden Straitjacket.

As your country puts on the Golden Straitjacket, two things tend to happen: your economy grows and your politics shrinks. That is, on the economic front the Golden Straitjacket usually fosters more growth and higher average incomes — through more trade, foreign investment, privatization and more efficient use of resources under the pressure of global competition. But on the political front, the Golden Straitjacket narrows the political and economic policy choices of those in power to relatively tight parameters. Governments — be they led by Democrats or Republicans, Conservatives or Labourites, Gaullists or Socialists, Christian Democrats or Social Democrats — that deviate too far from the core rules will see their investors stampede away, interest rates rise and stock market valuations fall.

Will the Modi-Jaitley duo make this budget the budget of the Golden Straitjacket? Or are they going to stick to the UPA/Congress playbook of rent extraction? Fingers crossed…
Weekly Recap: Surge!

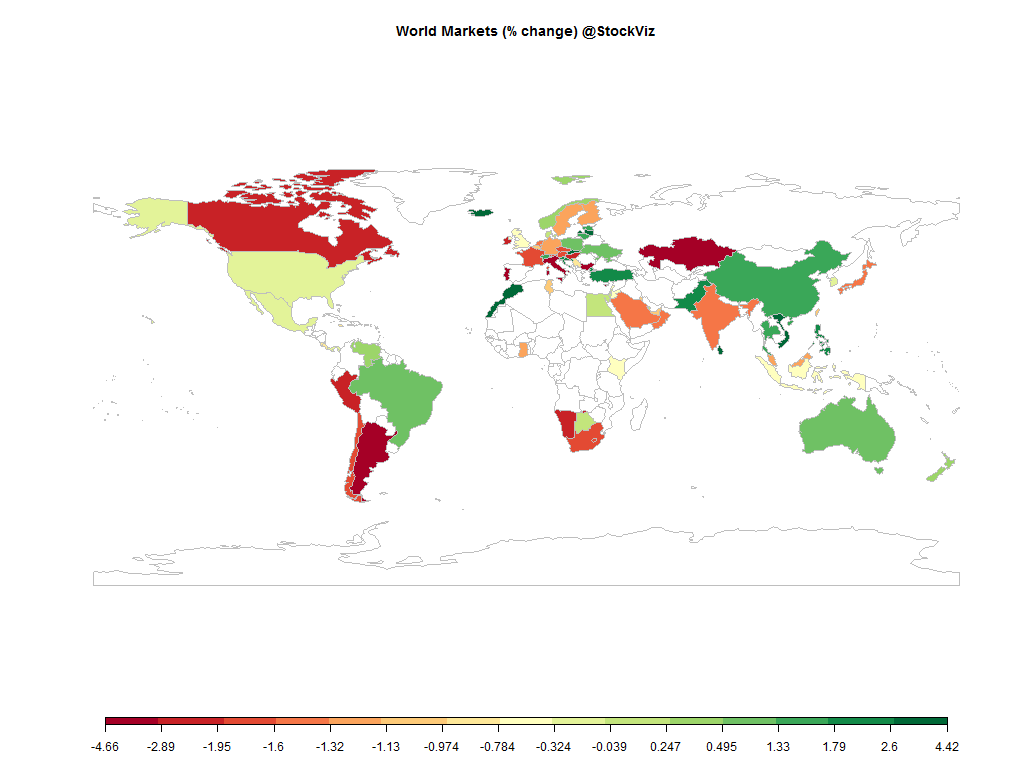
world.2015-01-2.2015-01-09

Equities

Major
DAX(DEU) -1.19%
CAC(FRA) -1.72%
UKX(GBR) -0.71%
NKY(JPN) -1.45%
SPX(USA) -0.31%
MINTs
JCI(IDN) -0.50%
INMEX(MEX) -0.15%
NGSEINDX(NGA) -13.03%
XU030(TUR) +2.55%
BRICS
IBOV(BRA) +0.73%
SHCOMP(CHN) +1.57%
NIFTY(IND) -1.32%
INDEXCF(RUS) +8.50%
TOP40(ZAF) -1.61%

Commodities

Energy
Ethanol -8.70%
Brent Crude Oil -11.76%
Heating Oil -6.41%
Natural Gas -3.70%
RBOB Gasoline -8.49%
WTI Crude Oil -9.43%
Metals
Platinum +2.32%
Gold 100oz +2.78%
Silver 5000oz +5.81%
Copper -1.76%
Palladium +1.02%

Currencies

USDEUR:+1.44% USDJPY:-1.50%

MINTs
USDIDR(IDN) +0.81%
USDMXN(MEX) -1.40%
USDNGN(NGA) -2.29%
USDTRY(TUR) -2.00%
BRICS
USDBRL(BRA) -2.19%
USDCNY(CHN) +0.02%
USDINR(IND) -1.53%
USDRUB(RUS) +4.93%
USDZAR(ZAF) -1.79%
Agricultural
Cattle -2.98%
Corn +1.98%
Orange Juice -2.50%
Soybean Meal +2.07%
Soybeans +4.65%
Cotton +1.86%
Lean Hogs -3.52%
Sugar #11 +4.77%
Feeder Cattle -1.12%
Lumber -2.61%
Wheat -1.99%
Cocoa +2.41%
Coffee (Arabica) +13.60%
Coffee (Robusta) +7.25%
White Sugar +3.45%

Credit Indices

Index Change
Markit CDX EM -1.72%
Markit CDX NA HY -0.96%
Markit CDX NA IG +3.91%
Markit iTraxx Asia ex-Japan IG +12.78%
Markit iTraxx Australia +7.50%
Markit iTraxx Europe +1.52%
Markit iTraxx Europe Crossover +8.23%
Markit iTraxx Japan +5.72%
Markit iTraxx SovX Western Europe +1.50%
Markit LCDX (Loan CDS) +0.06%
Markit MCDX (Municipal CDS) +1.54%
Precious metals found a bid, the dollar rally took a pause for the cause, energy continued to tumble, credit widened and Nigeria got ground to dust.

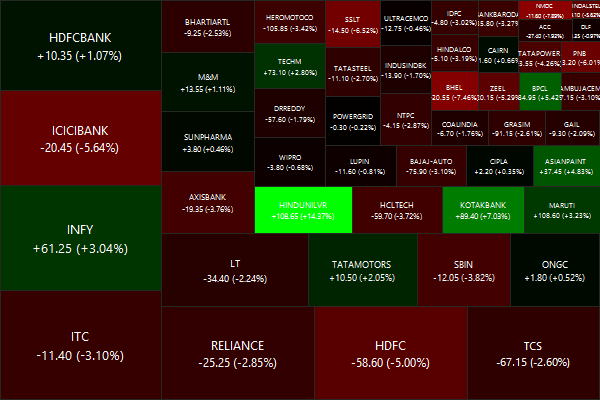
Nifty Heatmap

CNX NIFTY.2015-01-2.2015-01-09

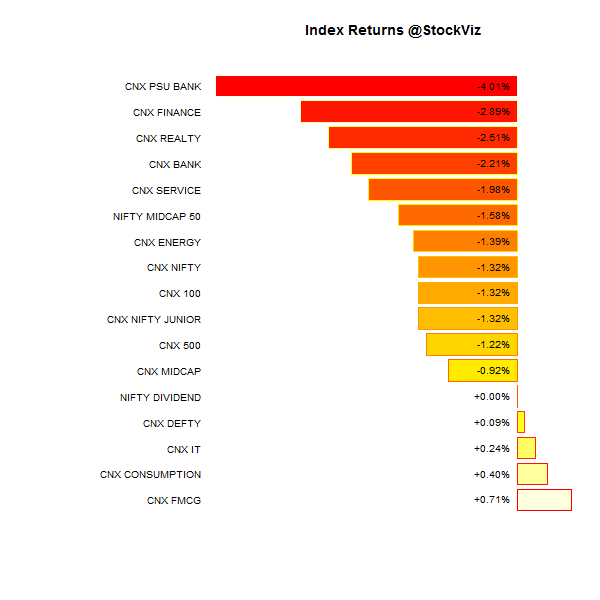
Index Returns

index performance.2015-01-2.2015-01-09

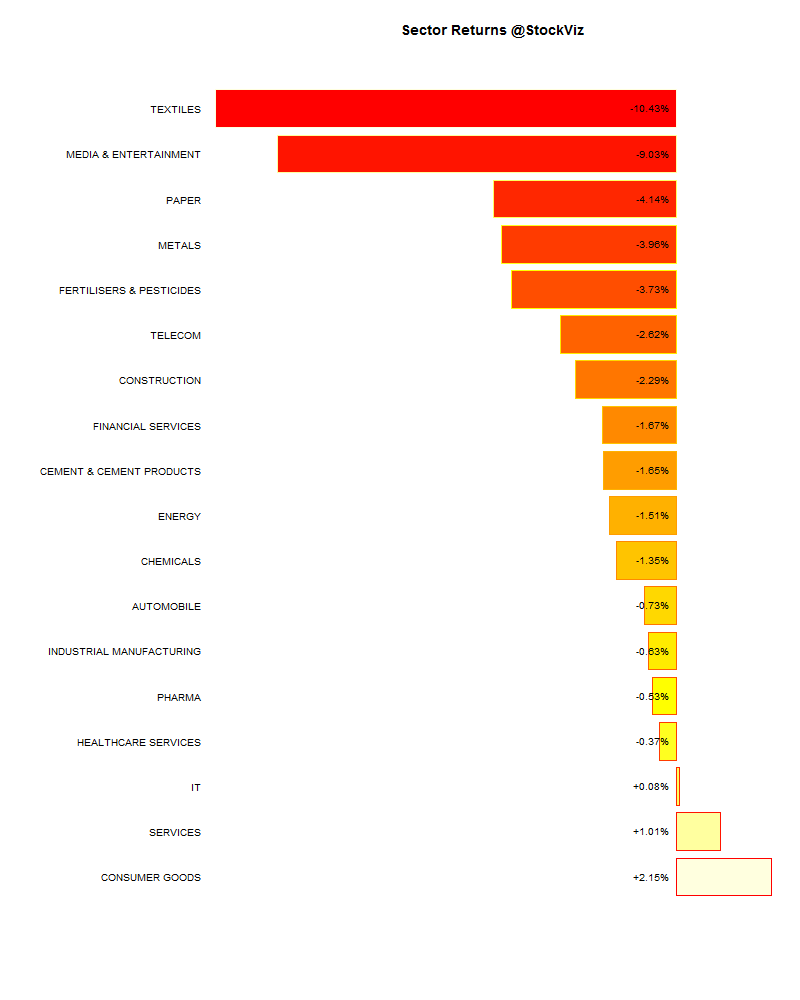
Sector Performance

sector performance.2015-01-2.2015-01-09

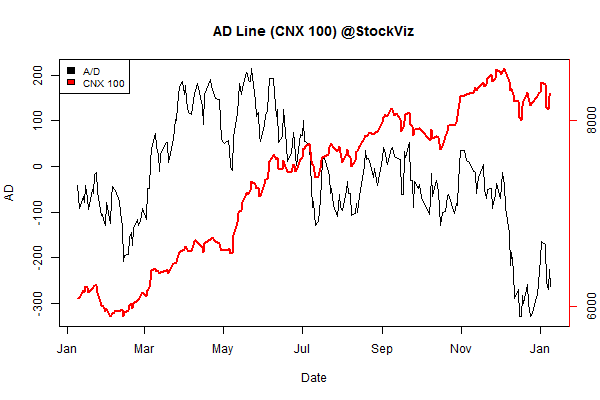
Advance Decline

advance.decline.line2.2015-01-2.2015-01-09

Market Cap Decile Performance

Decile Mkt. Cap. Adv/Decl
1 (micro) +2.17% 66/70
2 +1.39% 70/66
3 +0.62% 73/63
4 +3.15% 74/63
5 +0.78% 74/62
6 -0.28% 64/72
7 +0.29% 68/69
8 +0.01% 66/70
9 -0.54% 59/77
10 (mega) -0.44% 66/71
Mid-caps were a sight for sore eyes…

Top Winners and Losers

HINDPETRO +7.84%
UBL +8.18%
HINDUNILVR +14.37%
PFC -8.51%
NMDC -7.89%
IDEA -7.69%
Who would’ve thunk that Unilever can post double digit returns in a week?

ETF Performance

GOLDBEES +0.21%
INFRABEES -1.09%
NIFTYBEES -1.30%
CPSEETF -1.47%
BANKBEES -2.62%
JUNIORBEES -2.87%
PSUBNKBEES -4.84%
After “gyan sangam” comes the hangover. Decades of mismanagement, vested interests and perverse incentives cannot be wished away…

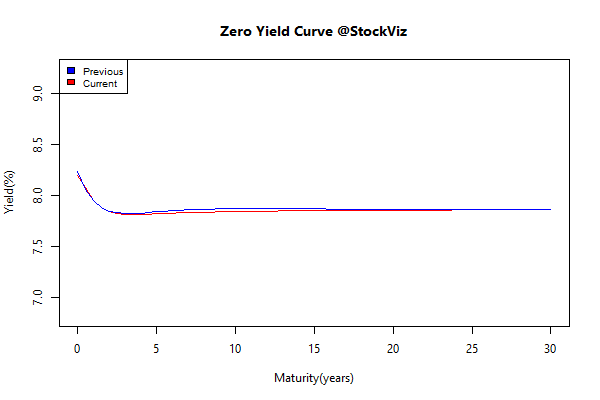
Yield Curve

yield Curve.2015-01-2.2015-01-09

Bond Indices

Sub Index Change in YTM Total Return(%)
GSEC TB -0.27 +0.23%
GSEC SUB 1-3 -0.63 +0.31%
GSEC SUB 3-8 -0.03 +0.46%
GSEC SUB 8 +0.03 -0.05%
Rate cuts factored in and some more…

Investment Theme Performance

Thought for the weekend

If your hairdresser or auto mechanic is busy, you get penciled in for next week. She doesn’t tell you she’ll fit you in tomorrow at double her usual rate.

Source: Surge!

Correlation Update 10.01.2015

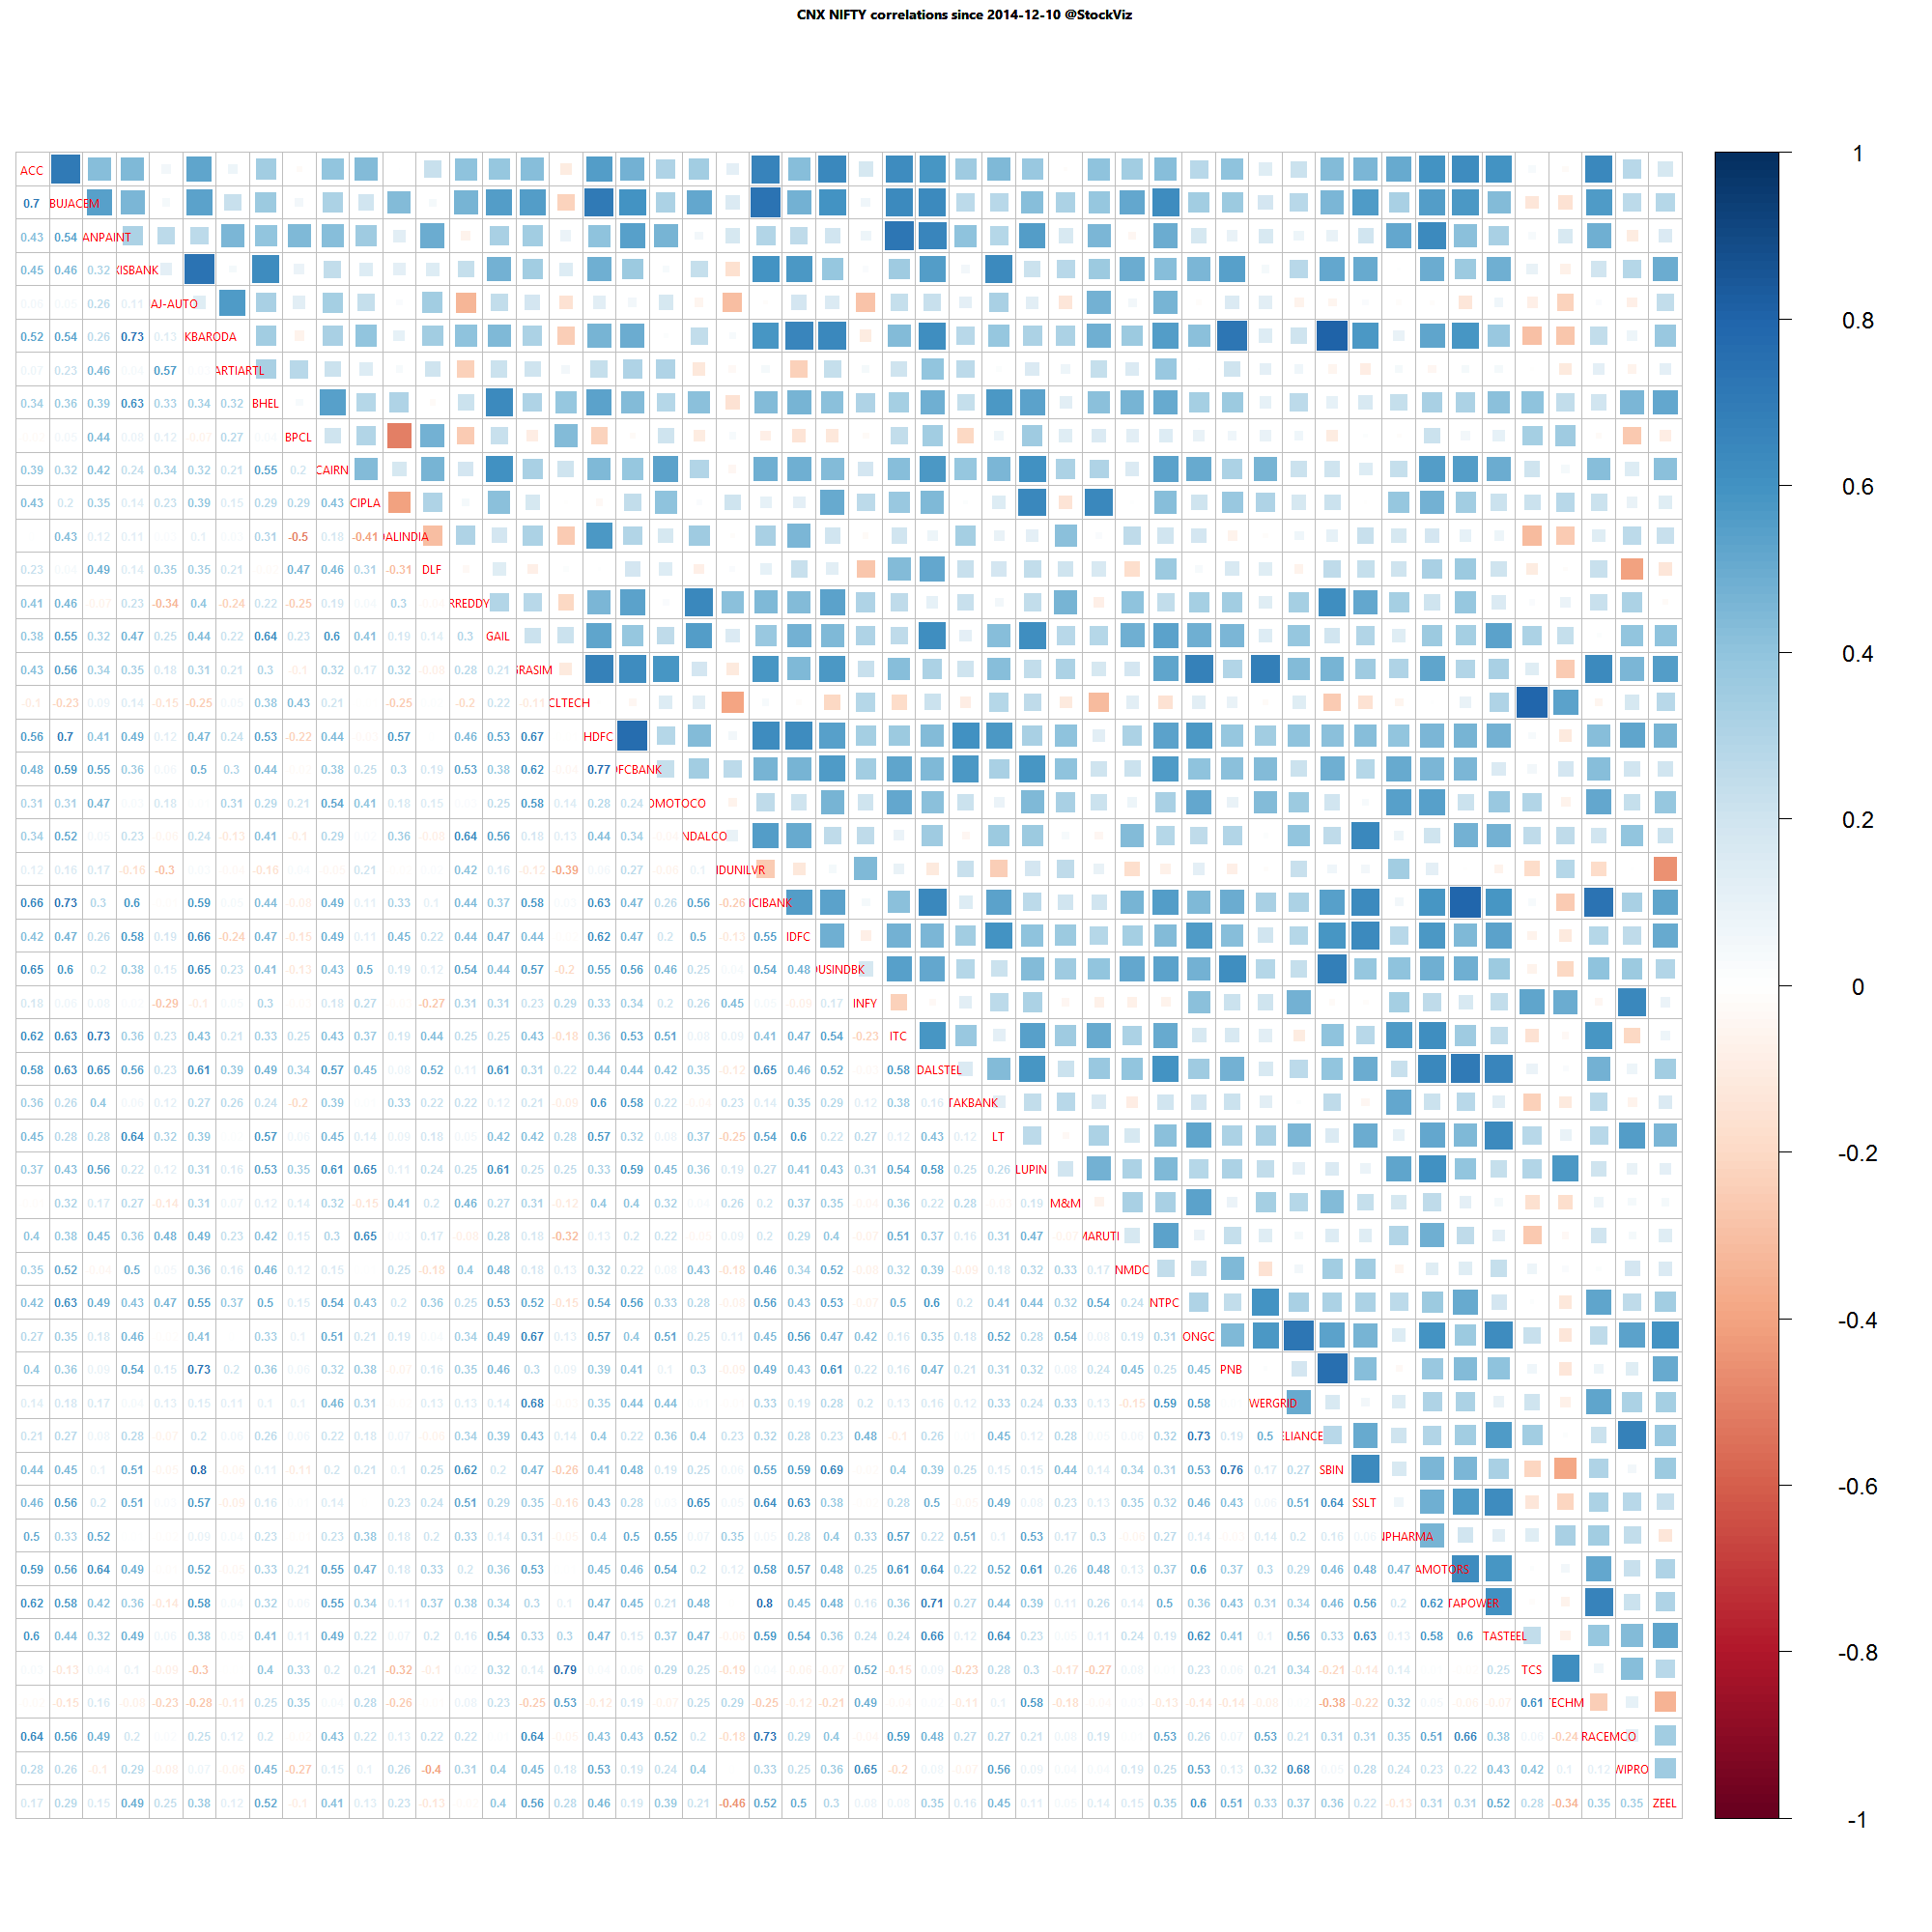
Nifty one year daily return correlations

Nifty one year daily return correlations

Nifty one month daily return correlations

Nifty one month daily return correlations

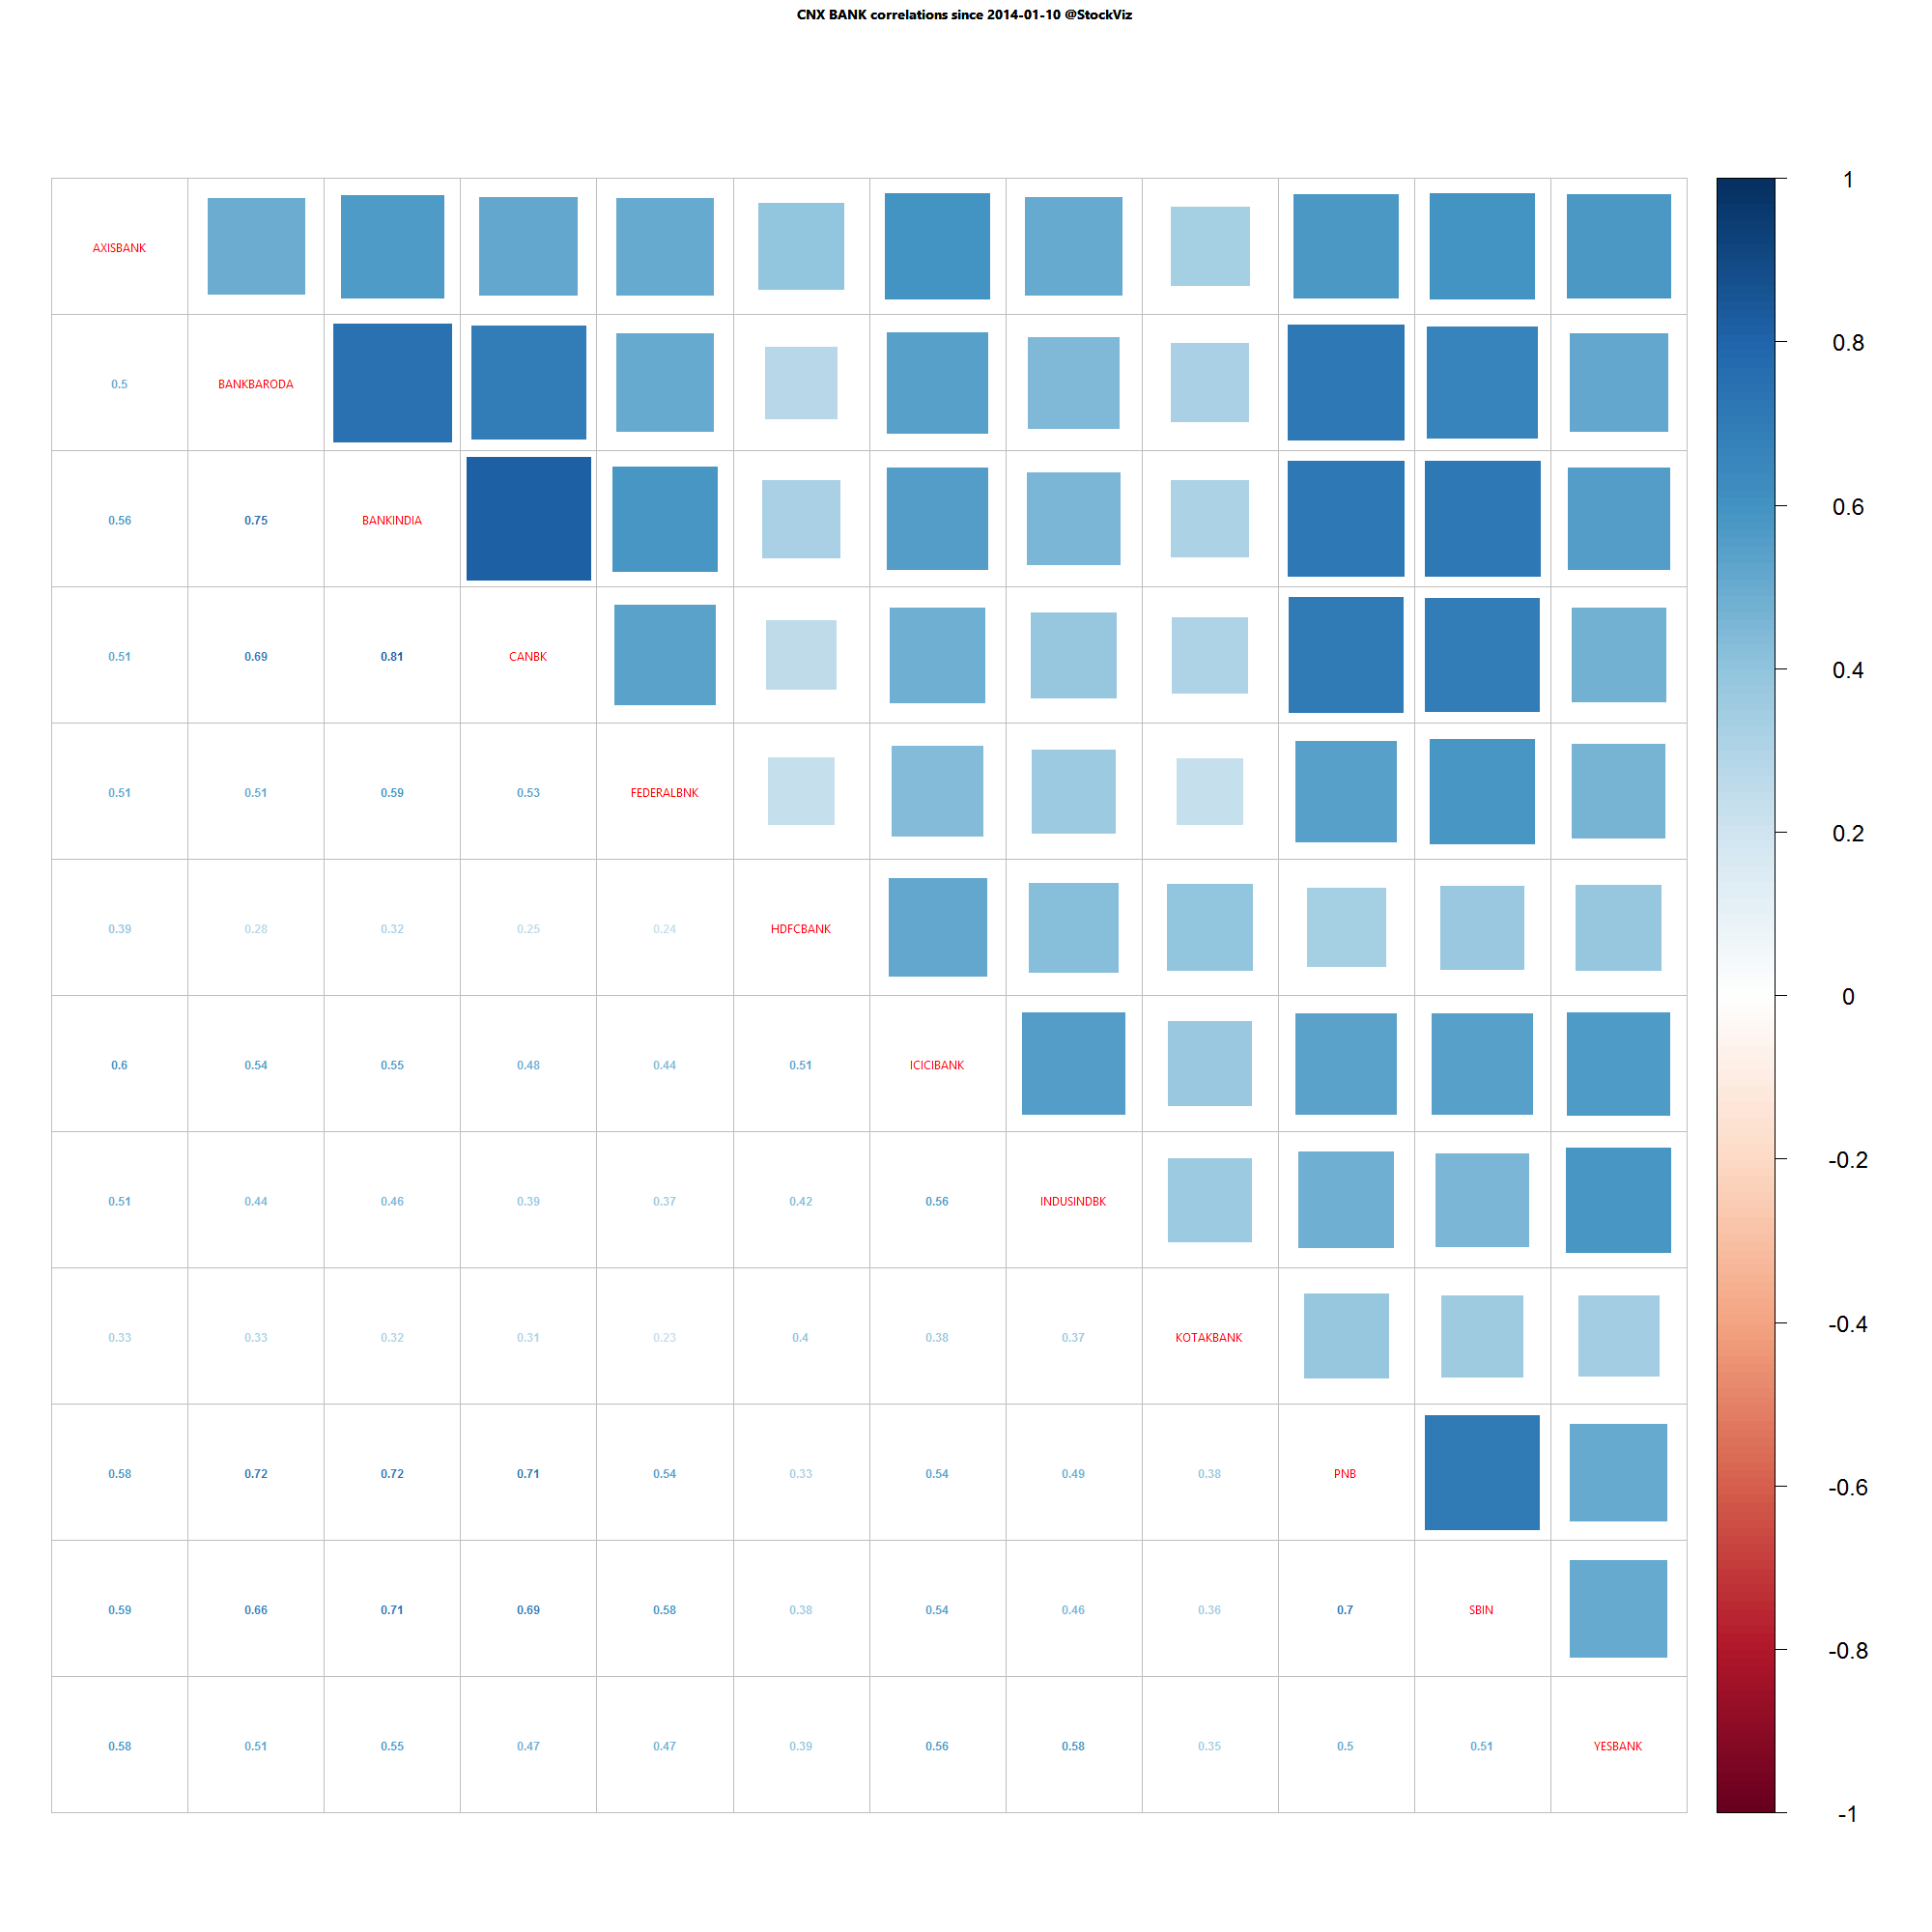
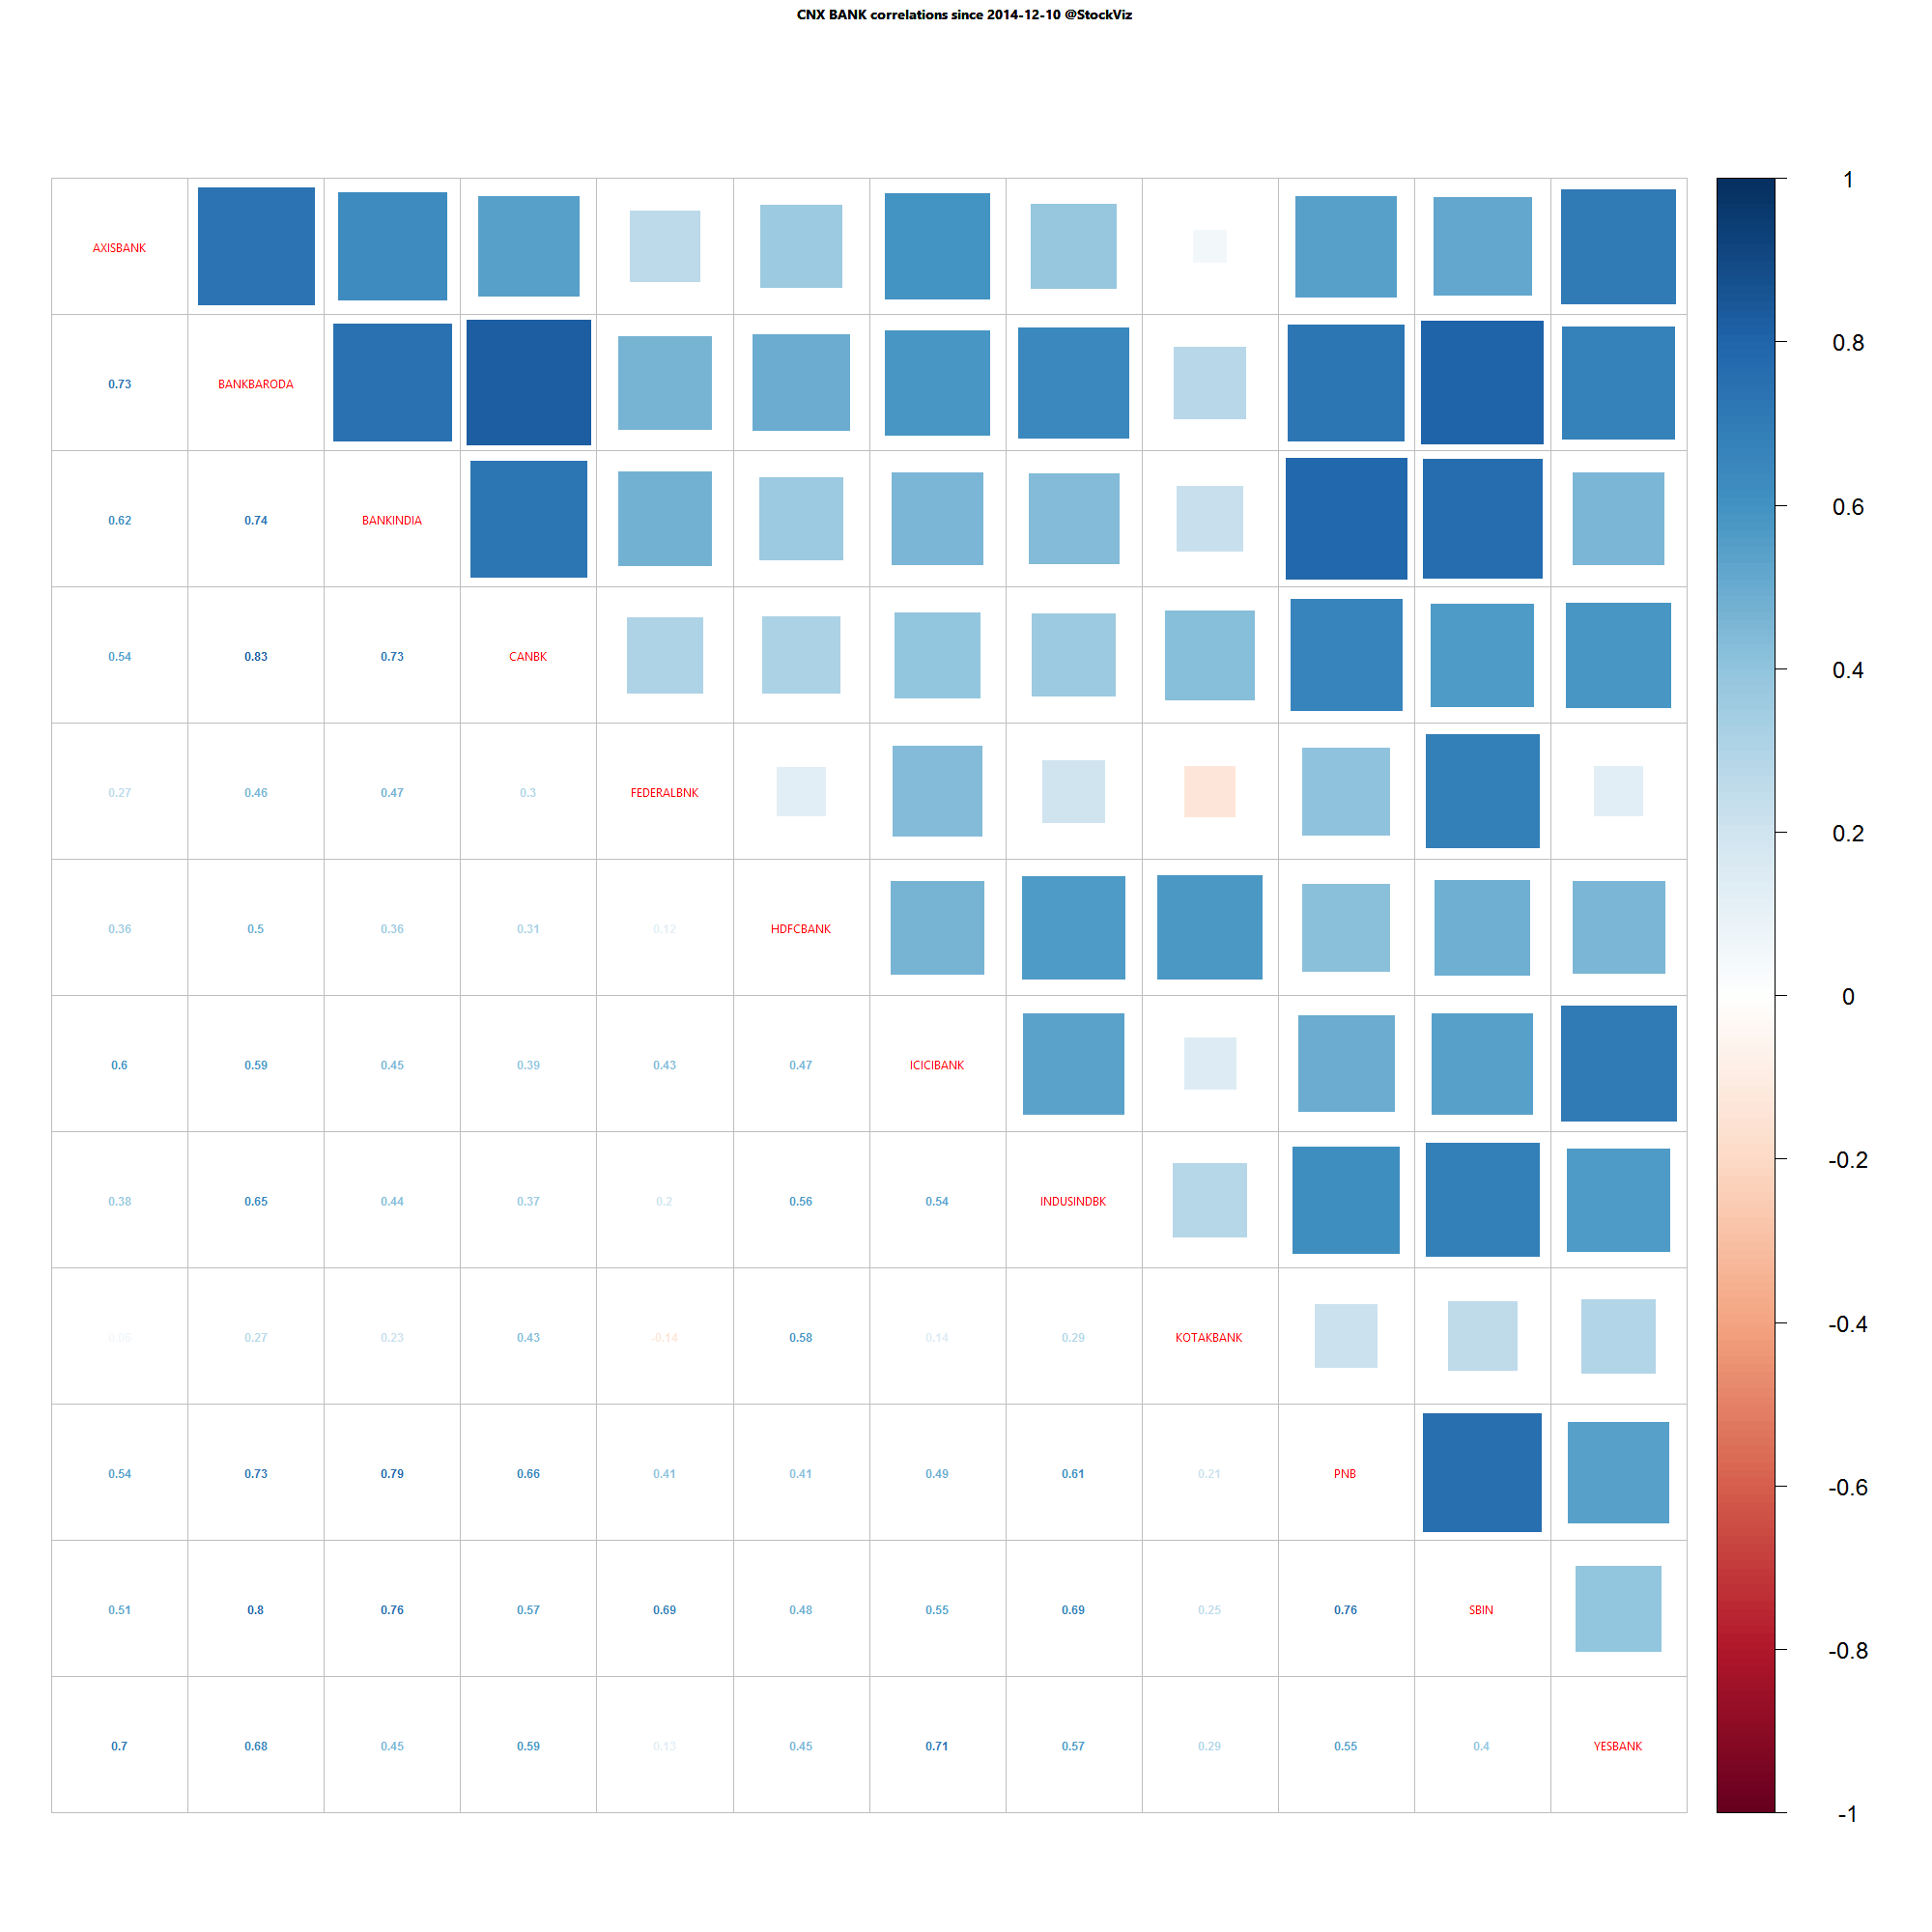
Bank Nifty one year daily return correlations

Bank Nifty one year daily return correlations

Bank Nifty one month daily return correlations

Bank Nifty one month daily return correlations

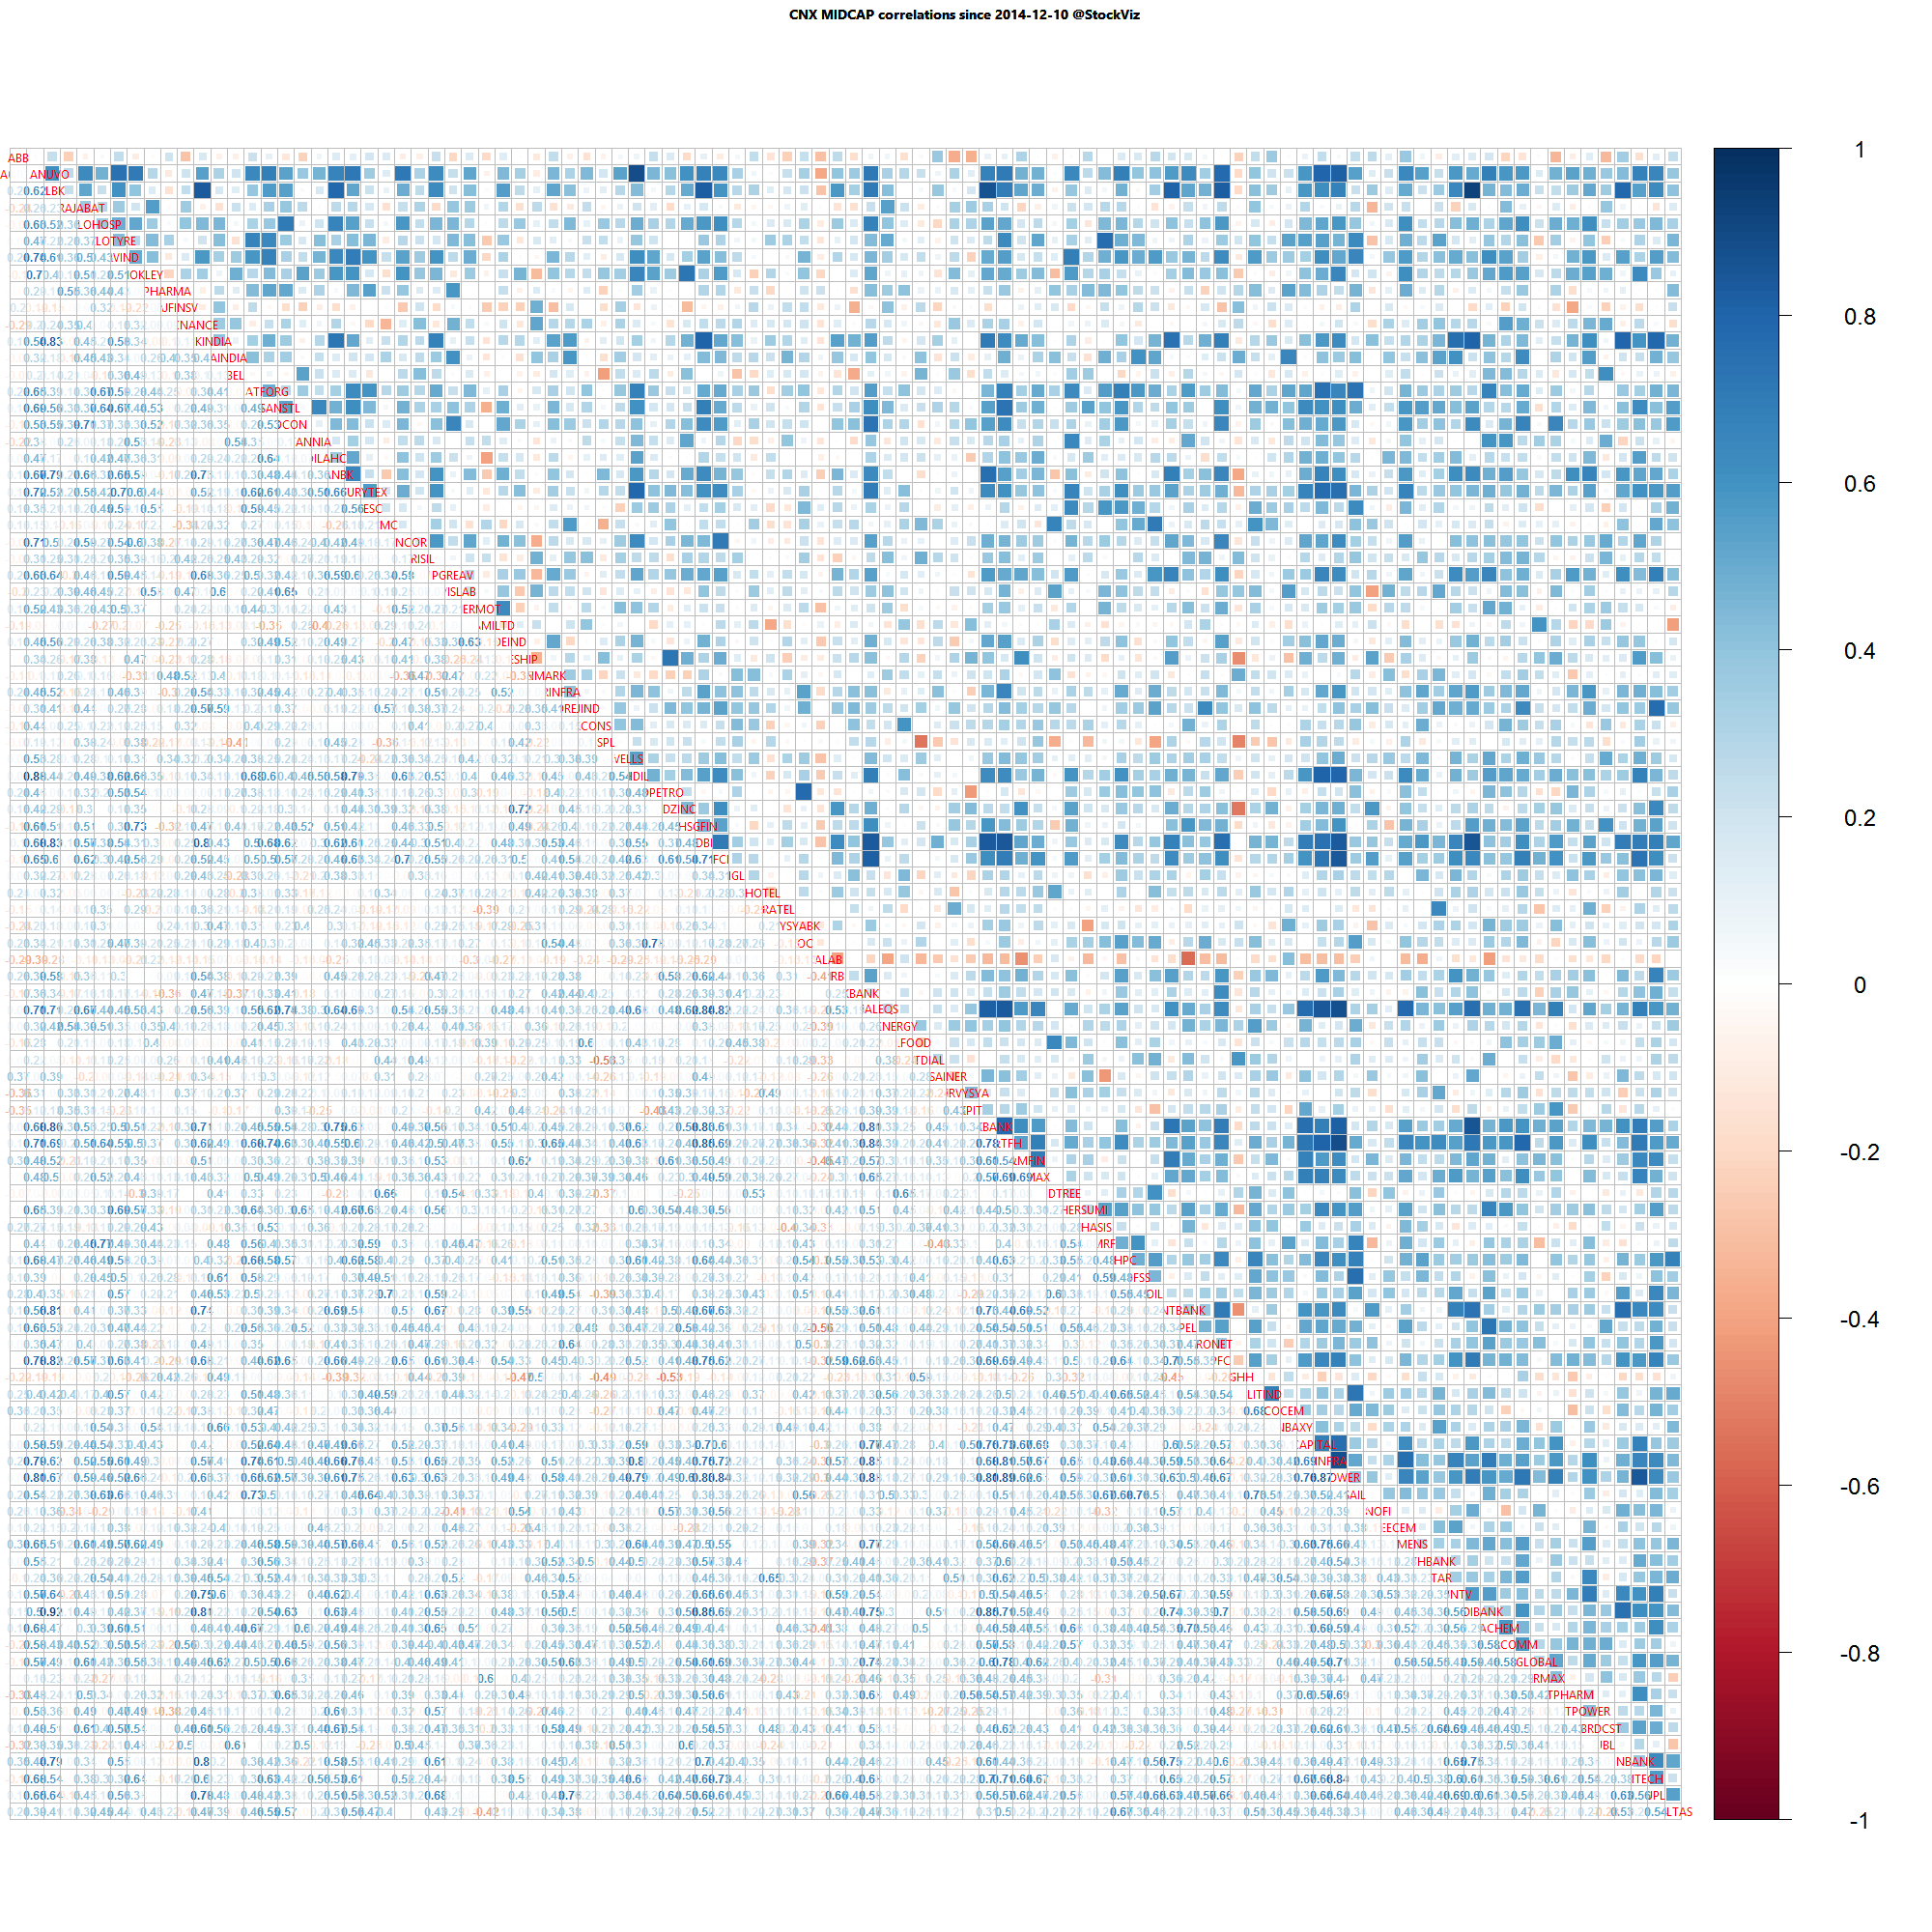
Midcap one year daily return correlations

Midcap one year daily return correlations

Midcap one month daily return correlations

Midcap one month daily return correlations

A lot of thick blue squares mean that positive correlations are high. Red squares mean negative correlations are high. Whites are the doldrums.

Mid N Small vs. Value Discovery

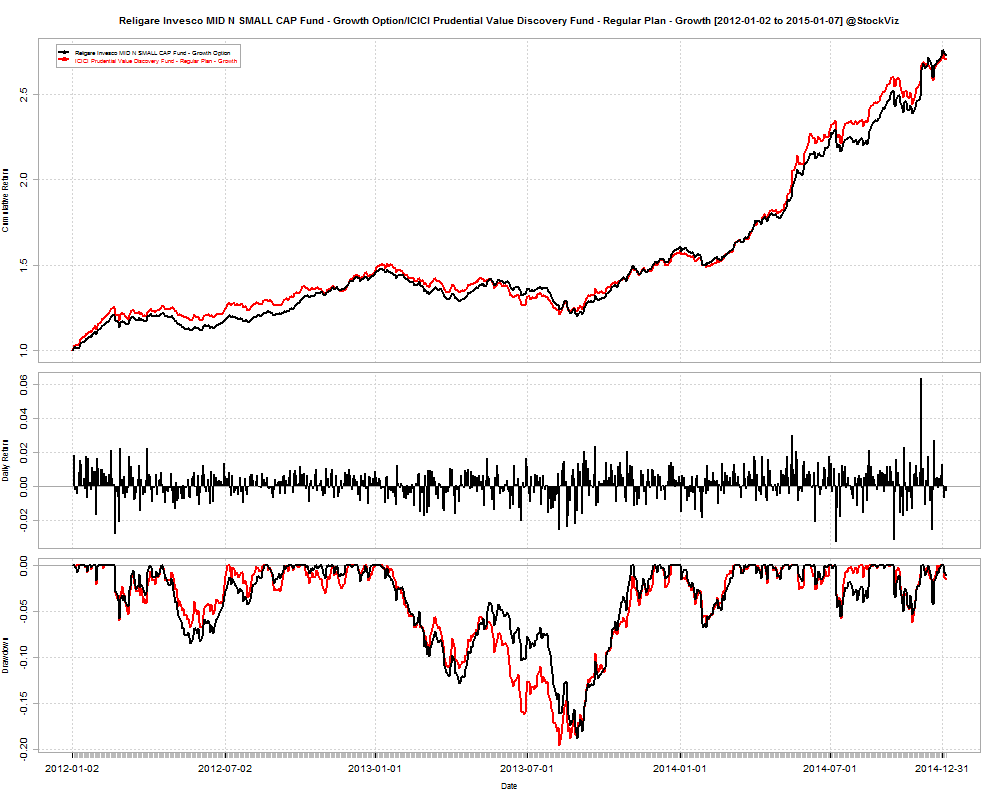
Sometimes, when you are comparing funds from different AMCs, you stumble across a pair of them that are so similar that it becomes a tough call choosing between them. For example, Religare Invesco MID N SMALL CAP Fund and ICICI Prudential Value Discovery Fund are right on top of each other. Try to spot the difference here (Jan-2012 through Jan-2015):

religare.icici

Between 2012-01-02 and 2015-01-07, Religare Invesco MID N SMALL CAP Fund has returned a cumulative 172.88% with an IRR of 39.49% vs. ICICI Prudential Value Discovery Fund’s cumulative return of 170.32% and an IRR of 39.05%.

Their drawdowns are similar as well. And since the NAV is quoted after all expenses, Religare’s expense ratio of 2.97% vs. ICICI’s 2.34% is factored into the returns.

religare.icici.metrics

In terms of metrics, Religare is marginally better than ICICI. However, there is nothing there to swing the decision one way or the other.

Run the FundCompare tool and have a look for yourself.

Nifty Correlations

It is useful to visualize the correlations of returns between individual stocks in an index. If correlations are high, betting on the index as a whole could be more profitable compared to picking single stocks. Low correlations, on the other hand, is a stock-picker’s dream. Here’s how the NIFTY correlations stack up.

One year daily returns

cnx nifty correlations.2014-1-1

One month daily returns

cnx nifty correlations.2014-12-1

A lot of thick blue squares mean that positive correlations are high. Red squares mean negative correlations are high. Whites are the doldrums.

We plan to update these on a weekly basis.