Category: Your Money

Weekly Recap: Wisdom in the Age of Information

world.2015-02-20.2015-02-28

Equities

Major
DAX(DEU) +3.18%
CAC(FRA) +2.50%
UKX(GBR) +0.45%
NKY(JPN) +2.54%
SPX(USA) +0.18%
MINTs
JCI(IDN) +0.93%
INMEX(MEX) +1.75%
NGSEINDX(NGA) +2.45%
XU030(TUR) -1.91%
BRICS
IBOV(BRA) +0.82%
SHCOMP(CHN) +1.95%
NIFTY(IND) +0.12%
INDEXCF(RUS) -1.88%
TOP40(ZAF) +0.60%

Commodities

Energy
Brent Crude Oil +3.85%
Ethanol +0.42%
Natural Gas -8.20%
WTI Crude Oil -2.02%
Heating Oil -6.88%
RBOB Gasoline +20.39%
Metals
Copper +3.44%
Gold 100oz +0.61%
Palladium +5.14%
Platinum +1.58%
Silver 5000oz +0.61%

Currencies

USDEUR:+2.02% USDJPY:+0.67%

MINTs
USDIDR(IDN) +0.84%
USDMXN(MEX) -0.62%
USDNGN(NGA) +1.64%
USDTRY(TUR) +2.36%
BRICS
USDBRL(BRA) -1.14%
USDCNY(CHN) +0.21%
USDINR(IND) -0.61%
USDRUB(RUS) -0.34%
USDZAR(ZAF) +0.24%
Agricultural
Coffee (Robusta) -3.55%
Cotton -0.71%
Lean Hogs +1.80%
Soybean Meal +1.03%
Wheat +0.49%
Cocoa -0.05%
Corn -0.26%
Feeder Cattle +1.00%
Sugar #11 -4.02%
Cattle -3.31%
Lumber -2.08%
Orange Juice -7.56%
Soybeans +2.85%
Coffee (Arabica) -7.38%
White Sugar -2.34%

Credit Indices

Index Change
Markit CDX EM -0.18%
Markit CDX NA IG -2.78%
Markit iTraxx Asia ex-Japan IG -4.75%
Markit iTraxx Australia -4.66%
Markit iTraxx Europe -4.75%
Markit iTraxx Europe Crossover -29.42%
Markit iTraxx Japan -0.03%
Markit iTraxx SovX Western Europe -3.07%
Markit LCDX (Loan CDS) +0.05%
Markit MCDX (Municipal CDS) -1.28%
After all the hype and hoopla, it turned to be a meh budget.

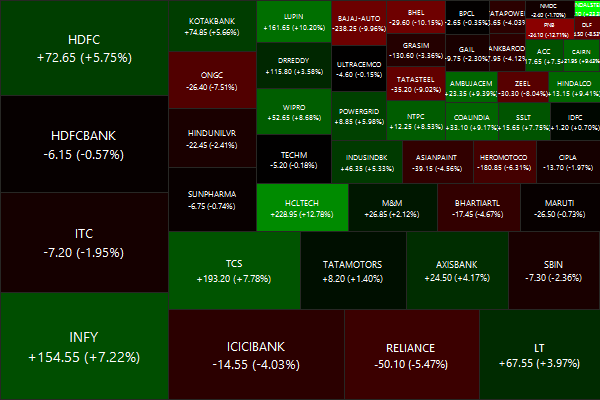
Nifty Heatmap

CNX NIFTY.2015-02-20.2015-02-28

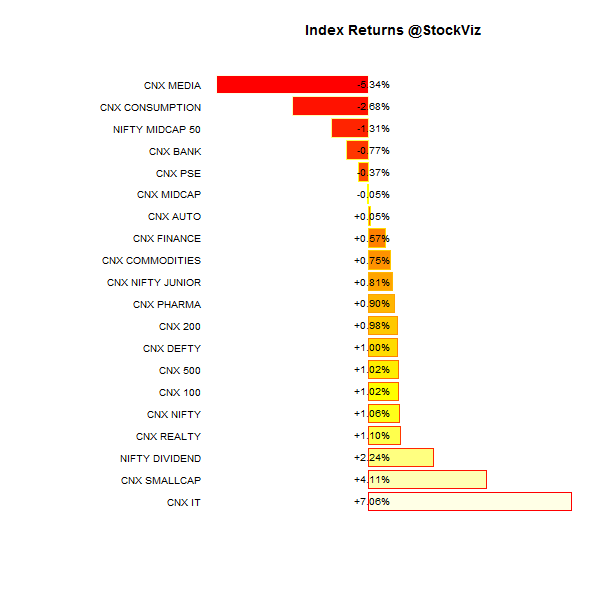
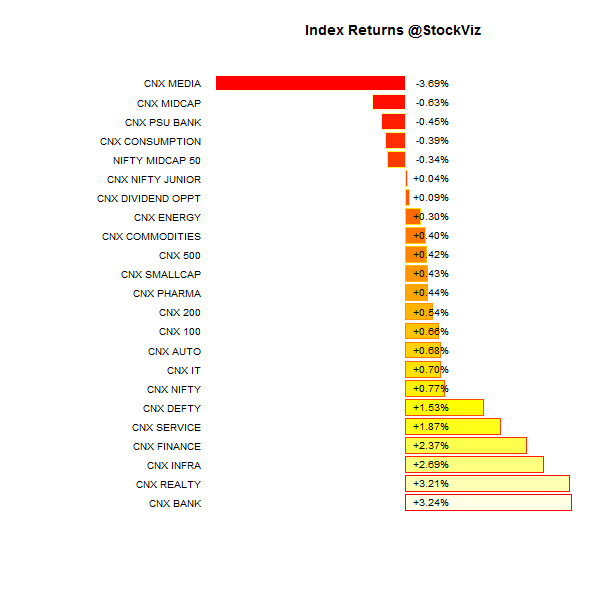
Index Returns

index performance.2015-02-20.2015-02-28

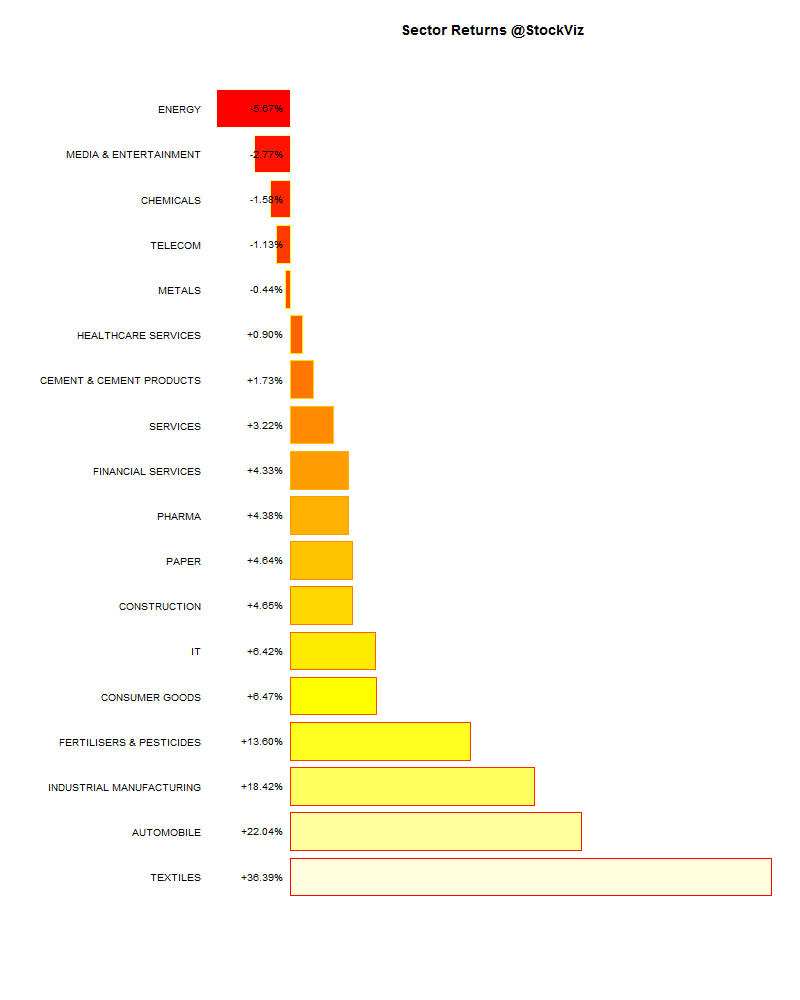
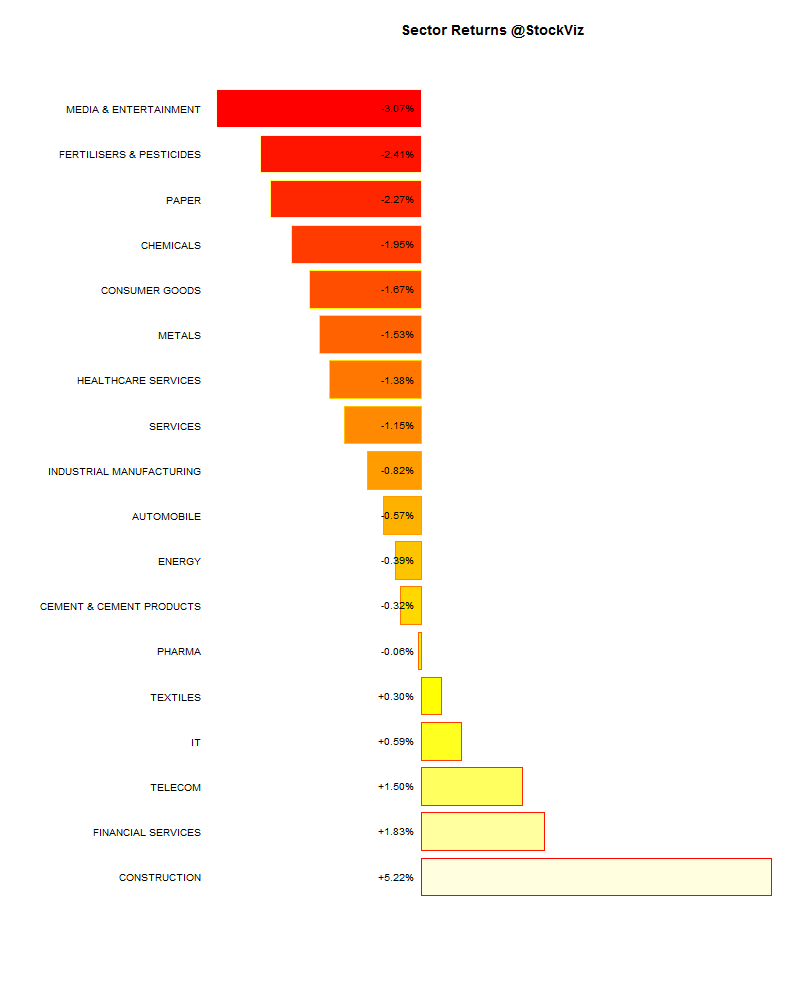
Sector Performance

sector performance.2015-02-20.2015-02-28

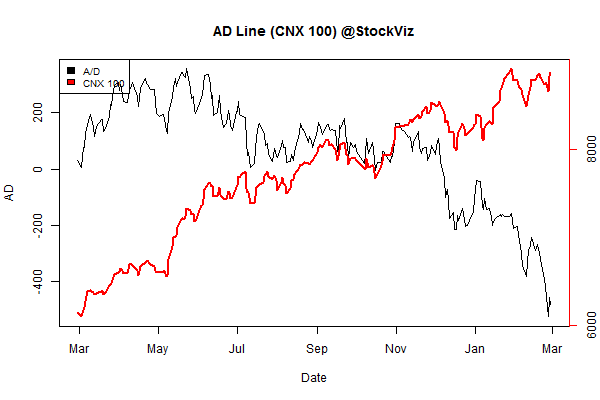
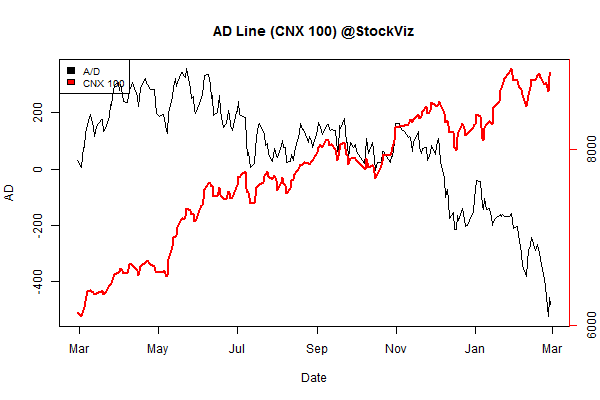
Advance Decline

advance.decline.line2.2015-02-20.2015-02-28

Market Cap Decile Performance

Decile Mkt. Cap. Adv/Decl
1 (micro) -0.84% 68/67
2 -0.57% 71/63
3 -0.50% 66/69
4 -1.52% 57/78
5 -0.36% 70/65
6 -0.16% 65/70
7 -0.65% 64/71
8 -0.47% 68/67
9 +0.21% 62/73
10 (mega) -0.50% 66/69
Mal all around…

Top Winners and Losers

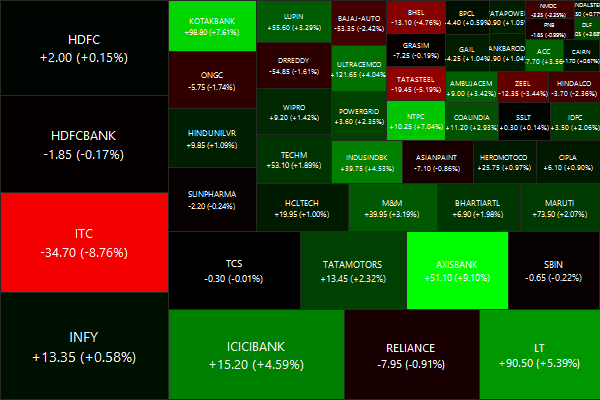
NTPC +7.04%
KOTAKBANK +7.61%
AXISBANK +9.10%
ITC -8.76%
SAIL -5.25%
MOTHERSUMI -5.22%
Investors are still trying to figure out what Make in India is all about.
Meanwhile, converging FPI & FDI might allow Axis Bank to be included back again into the MSCI India index.

ETF Performance

BANKBEES +2.94%
NIFTYBEES +0.66%
CPSEETF +0.44%
JUNIORBEES +0.36%
INFRABEES -1.08%
GOLDBEES -1.28%
PSUBNKBEES -2.43%
We still don’t know how PSU banks are going to fund themselves…

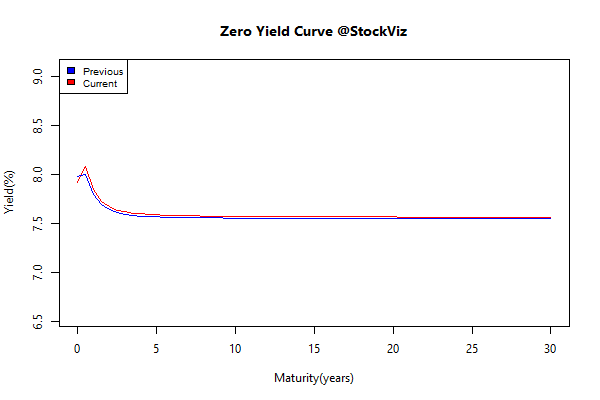
Yield Curve

yield Curve.2015-02-20.2015-02-28

Bond Indices

Sub Index Change in YTM Total Return(%)
GSEC TB +0.14 +0.11%
GSEC SUB 1-3 +0.26 -0.12%
GSEC SUB 3-8 +0.17 -0.41%
GSEC SUB 8 +0.06 -0.21%
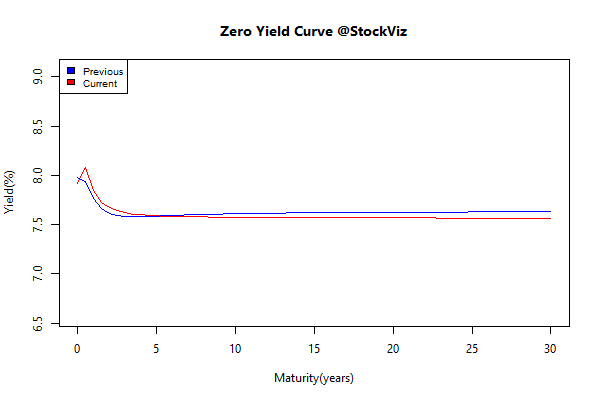
A flat yield curve, going nowhere in a hurry…

Investment Theme Performance

Equity Mutual Funds

Bond Mutual Funds

Thought for the weekend

We live in a world awash with information, but we seem to face a growing scarcity of wisdom. And what’s worse, we confuse the two. We believe that having access to more information produces more knowledge, which results in more wisdom. But, if anything, the opposite is true — more and more information without the proper context and interpretation only muddles our understanding of the world rather than enriching it.

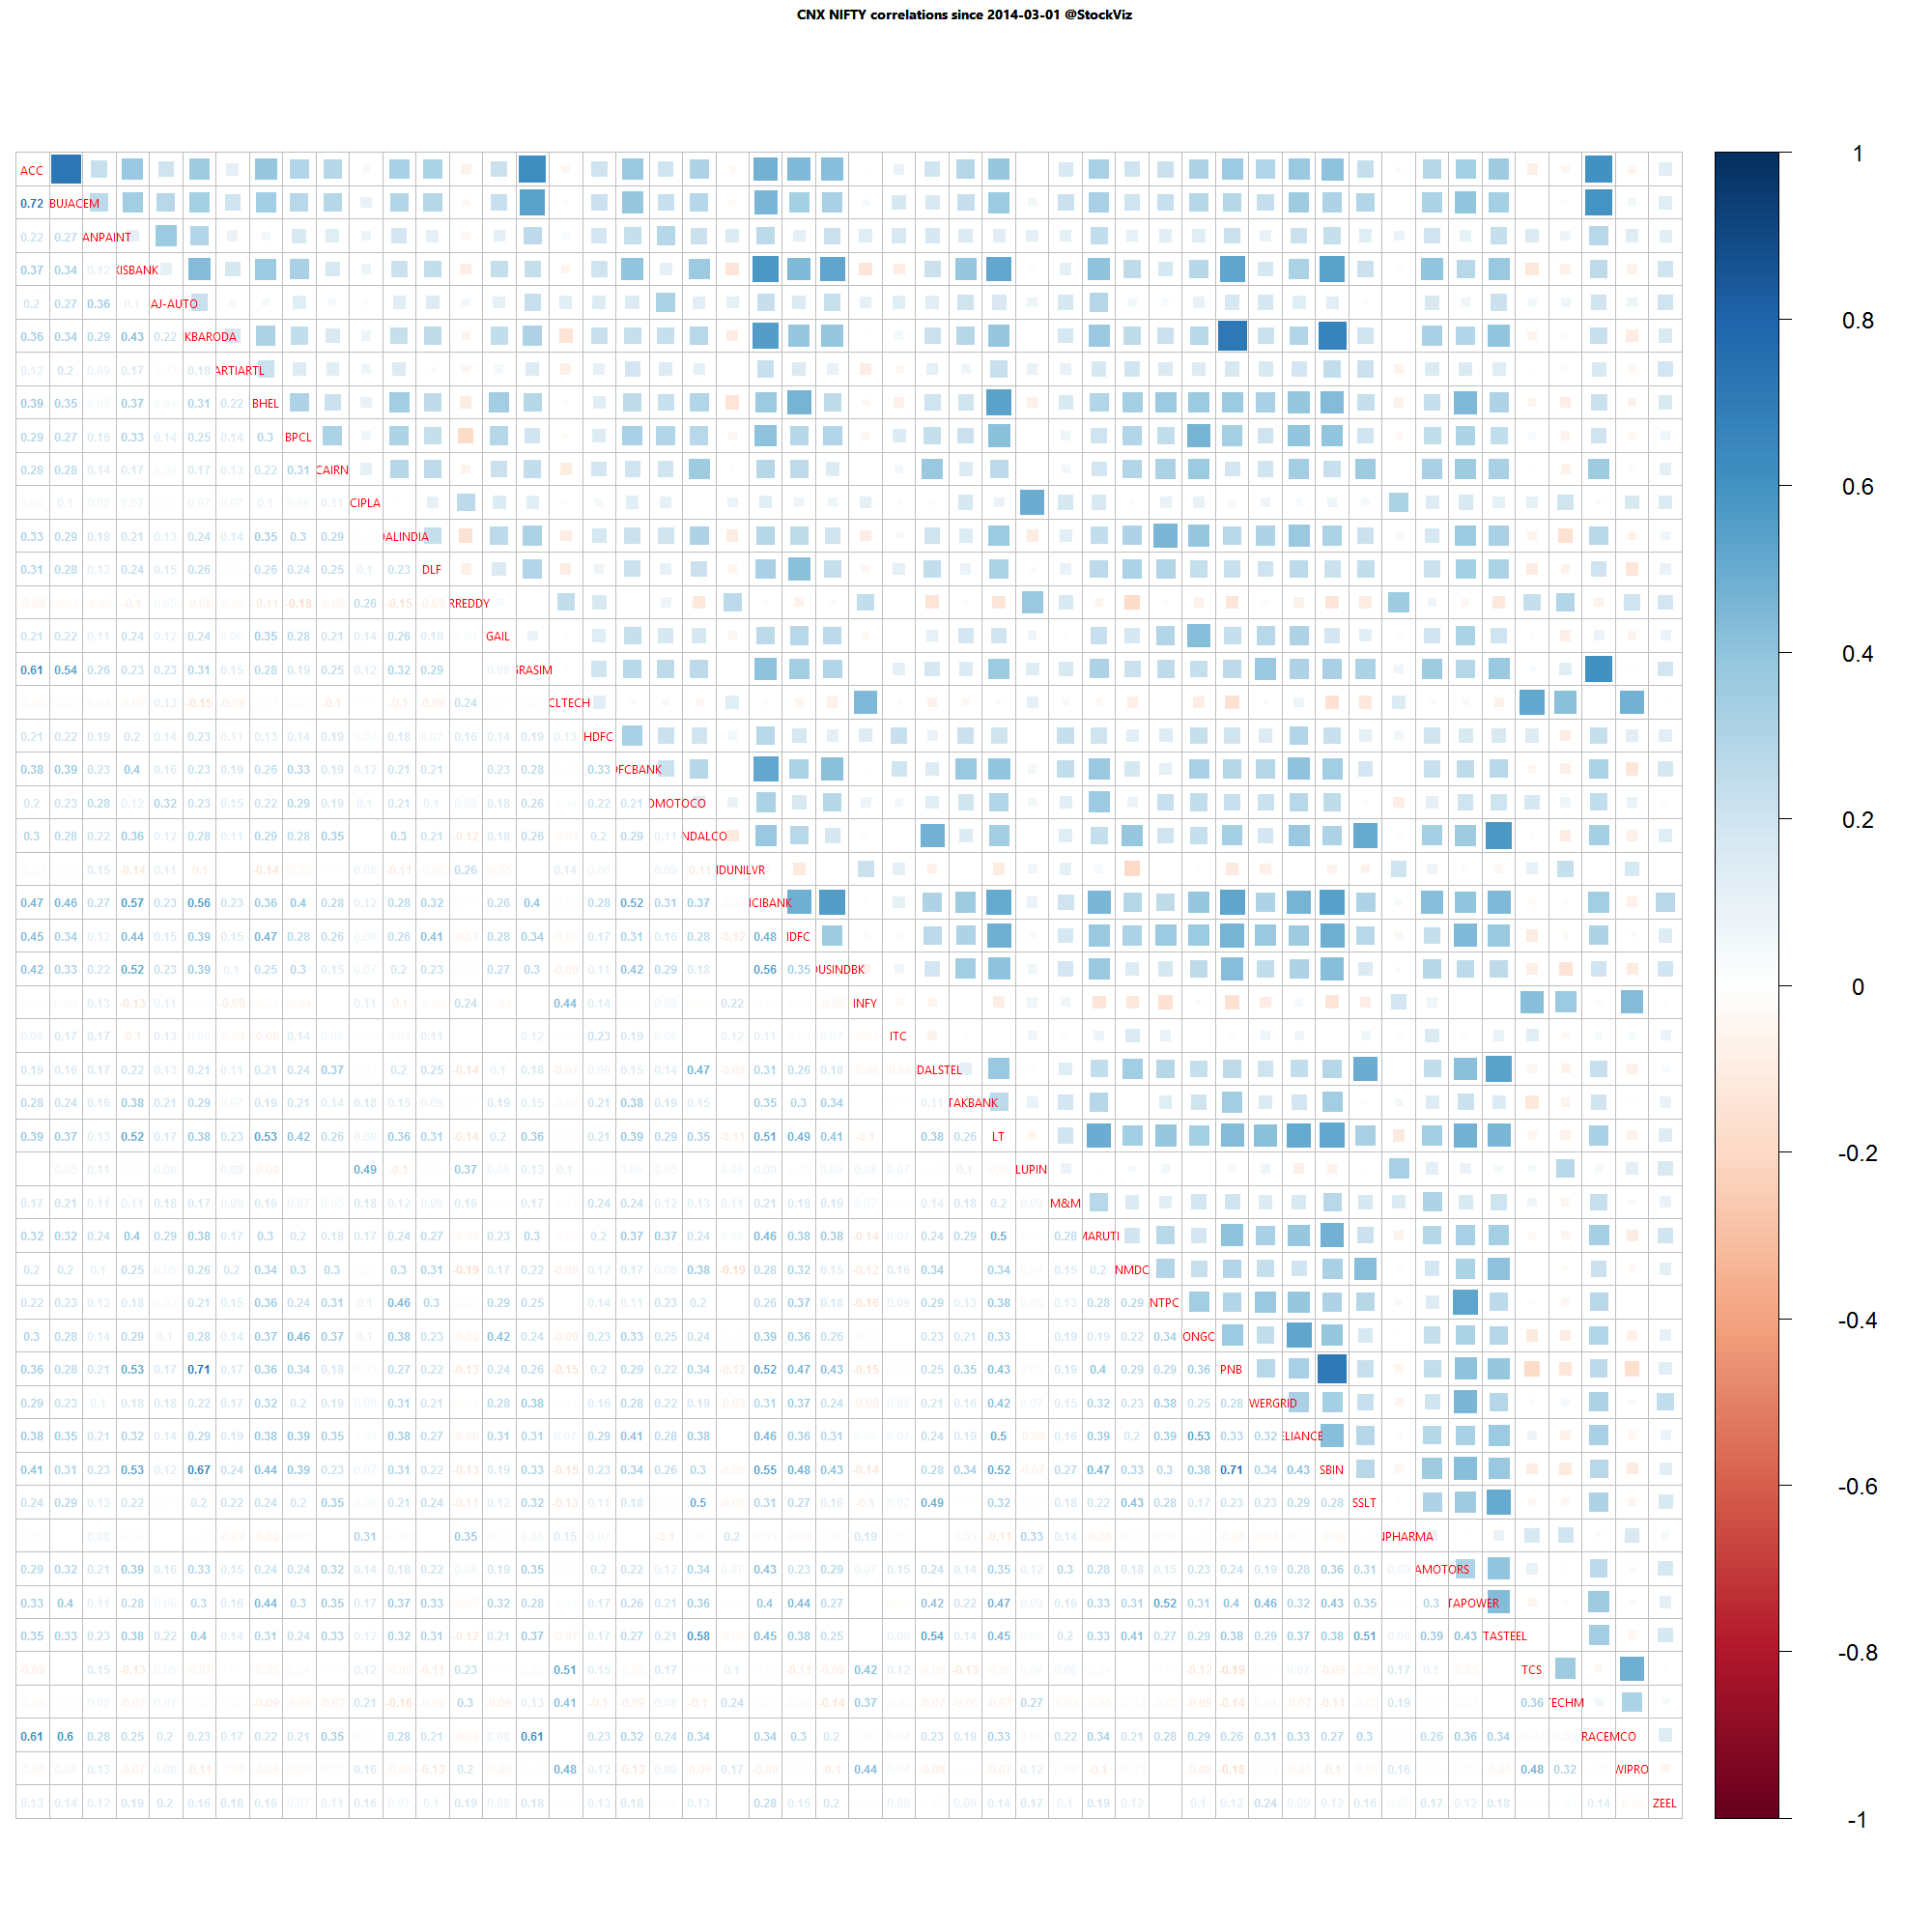
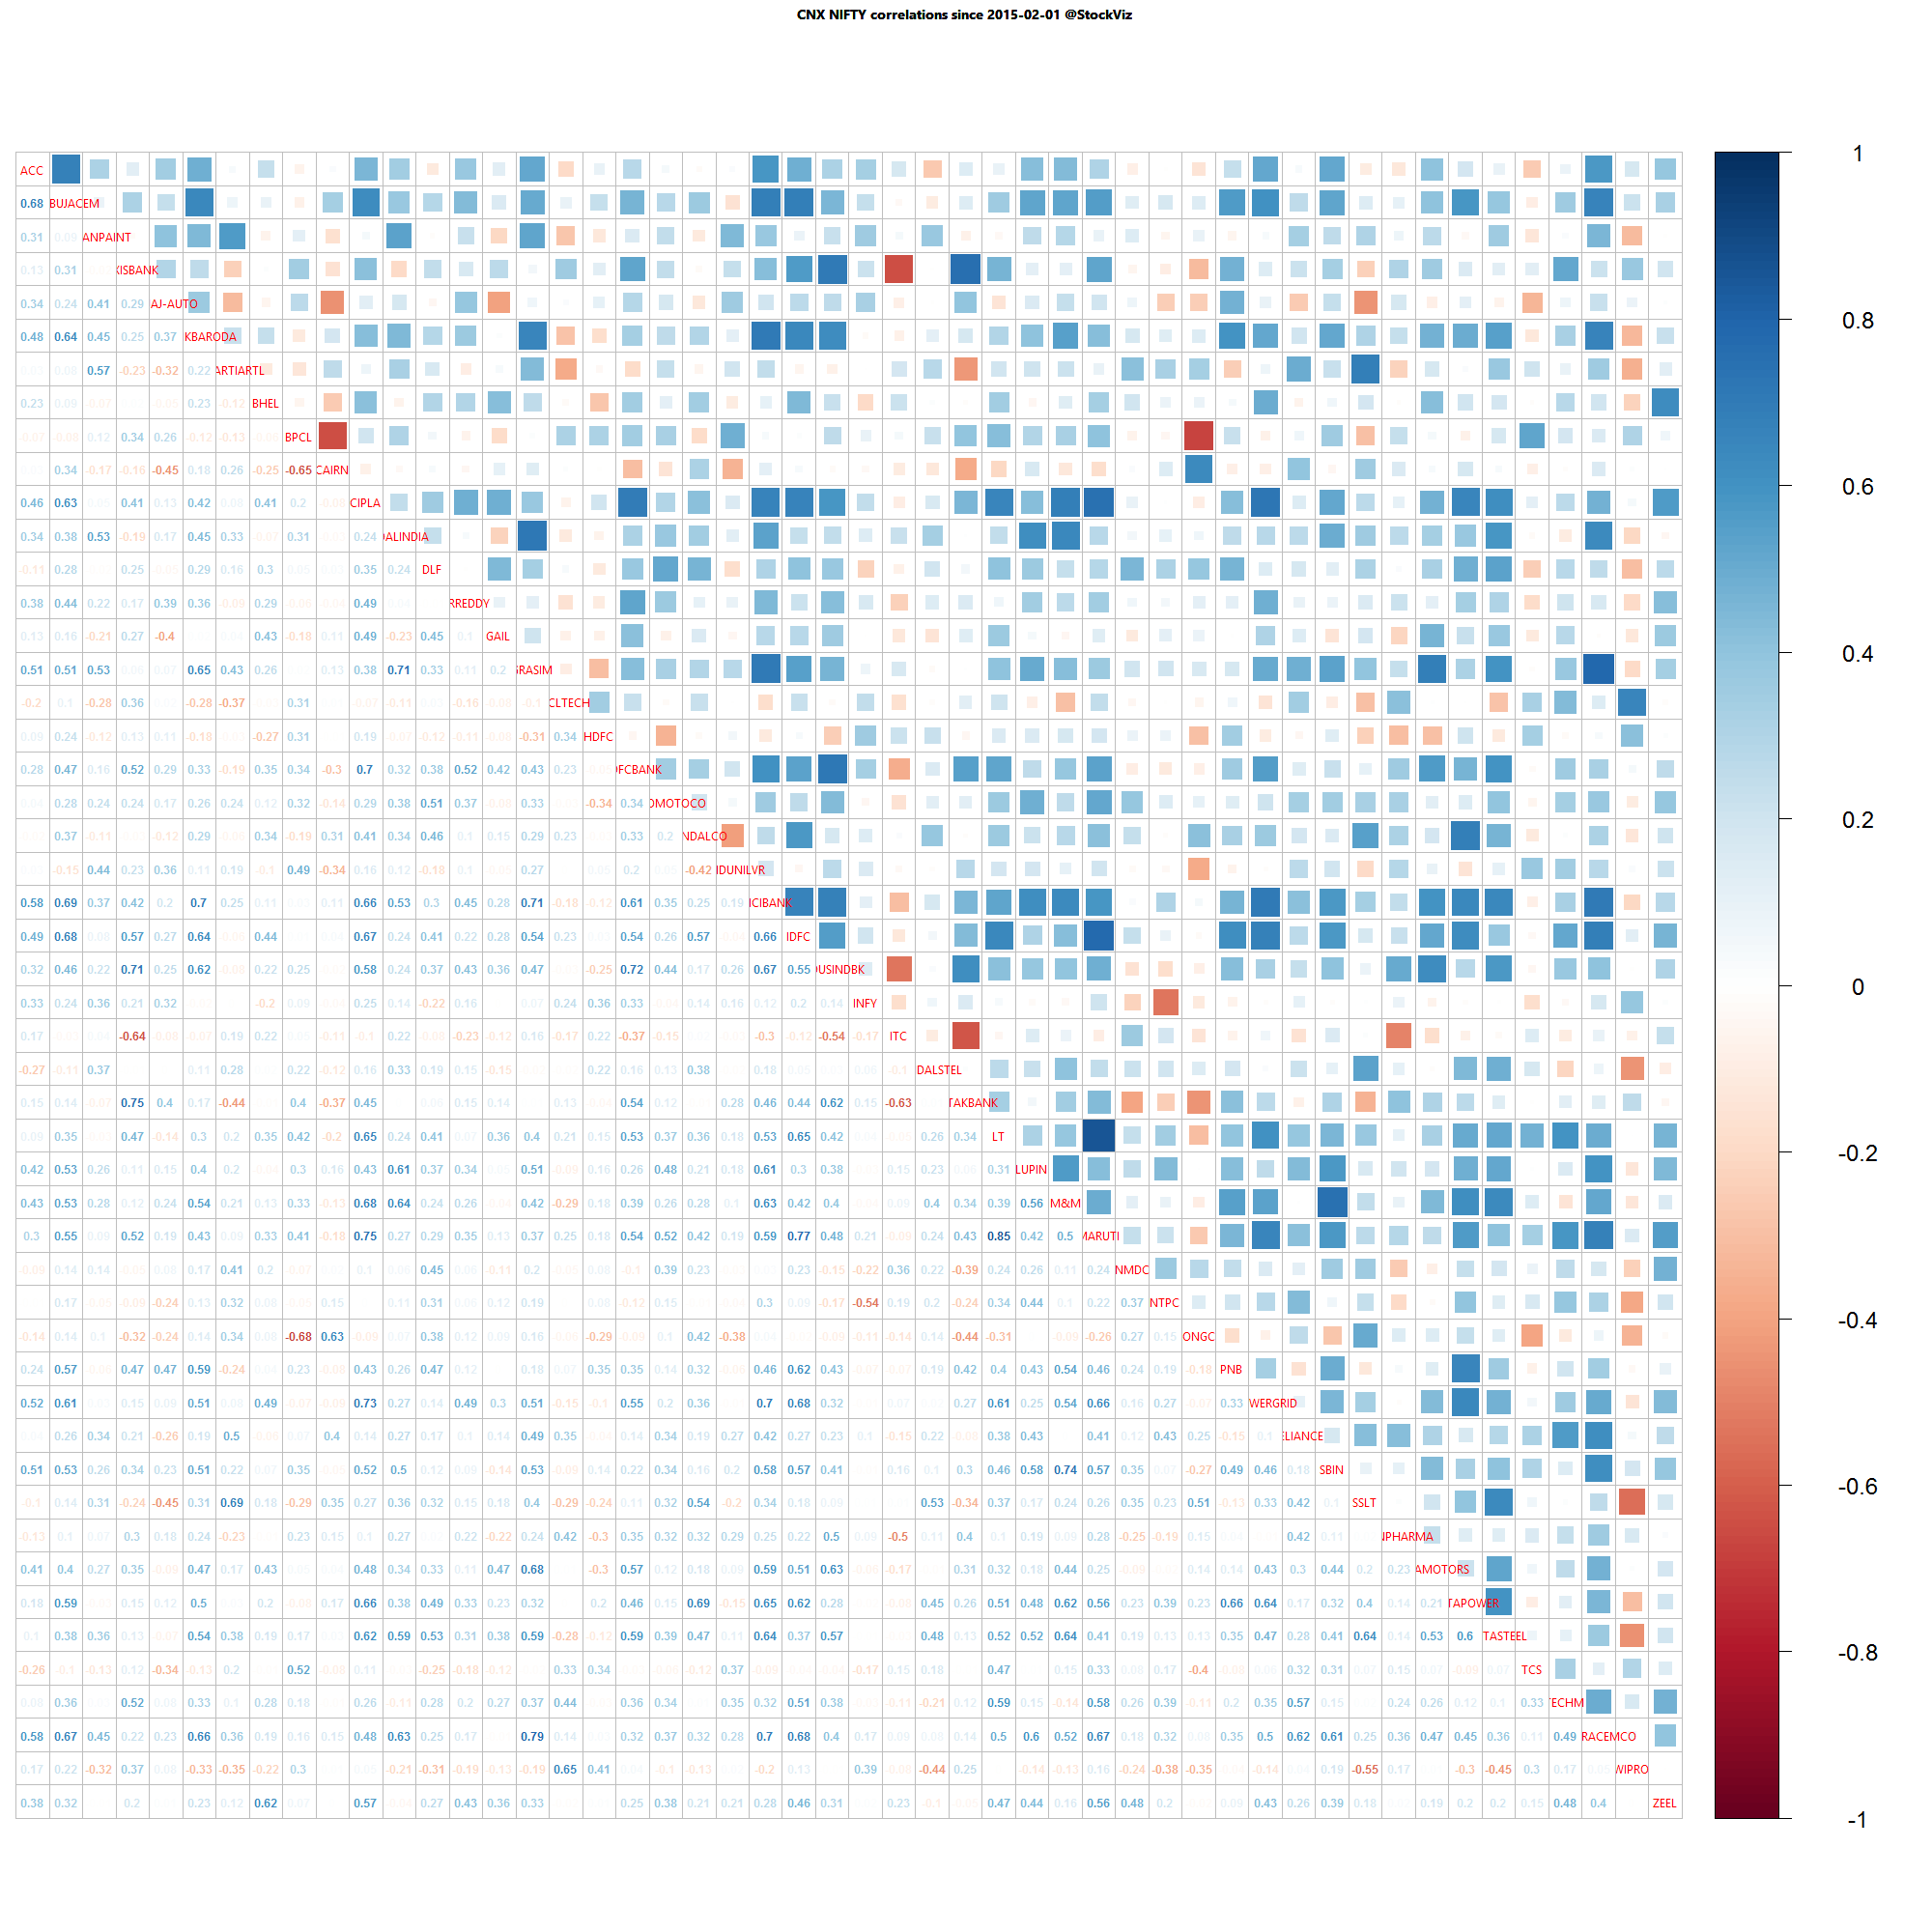
Correlation Update 01.03.2015

Nifty one year daily return correlations

Nifty one year daily return correlations

Nifty one month daily return correlations

Nifty one month daily return correlations

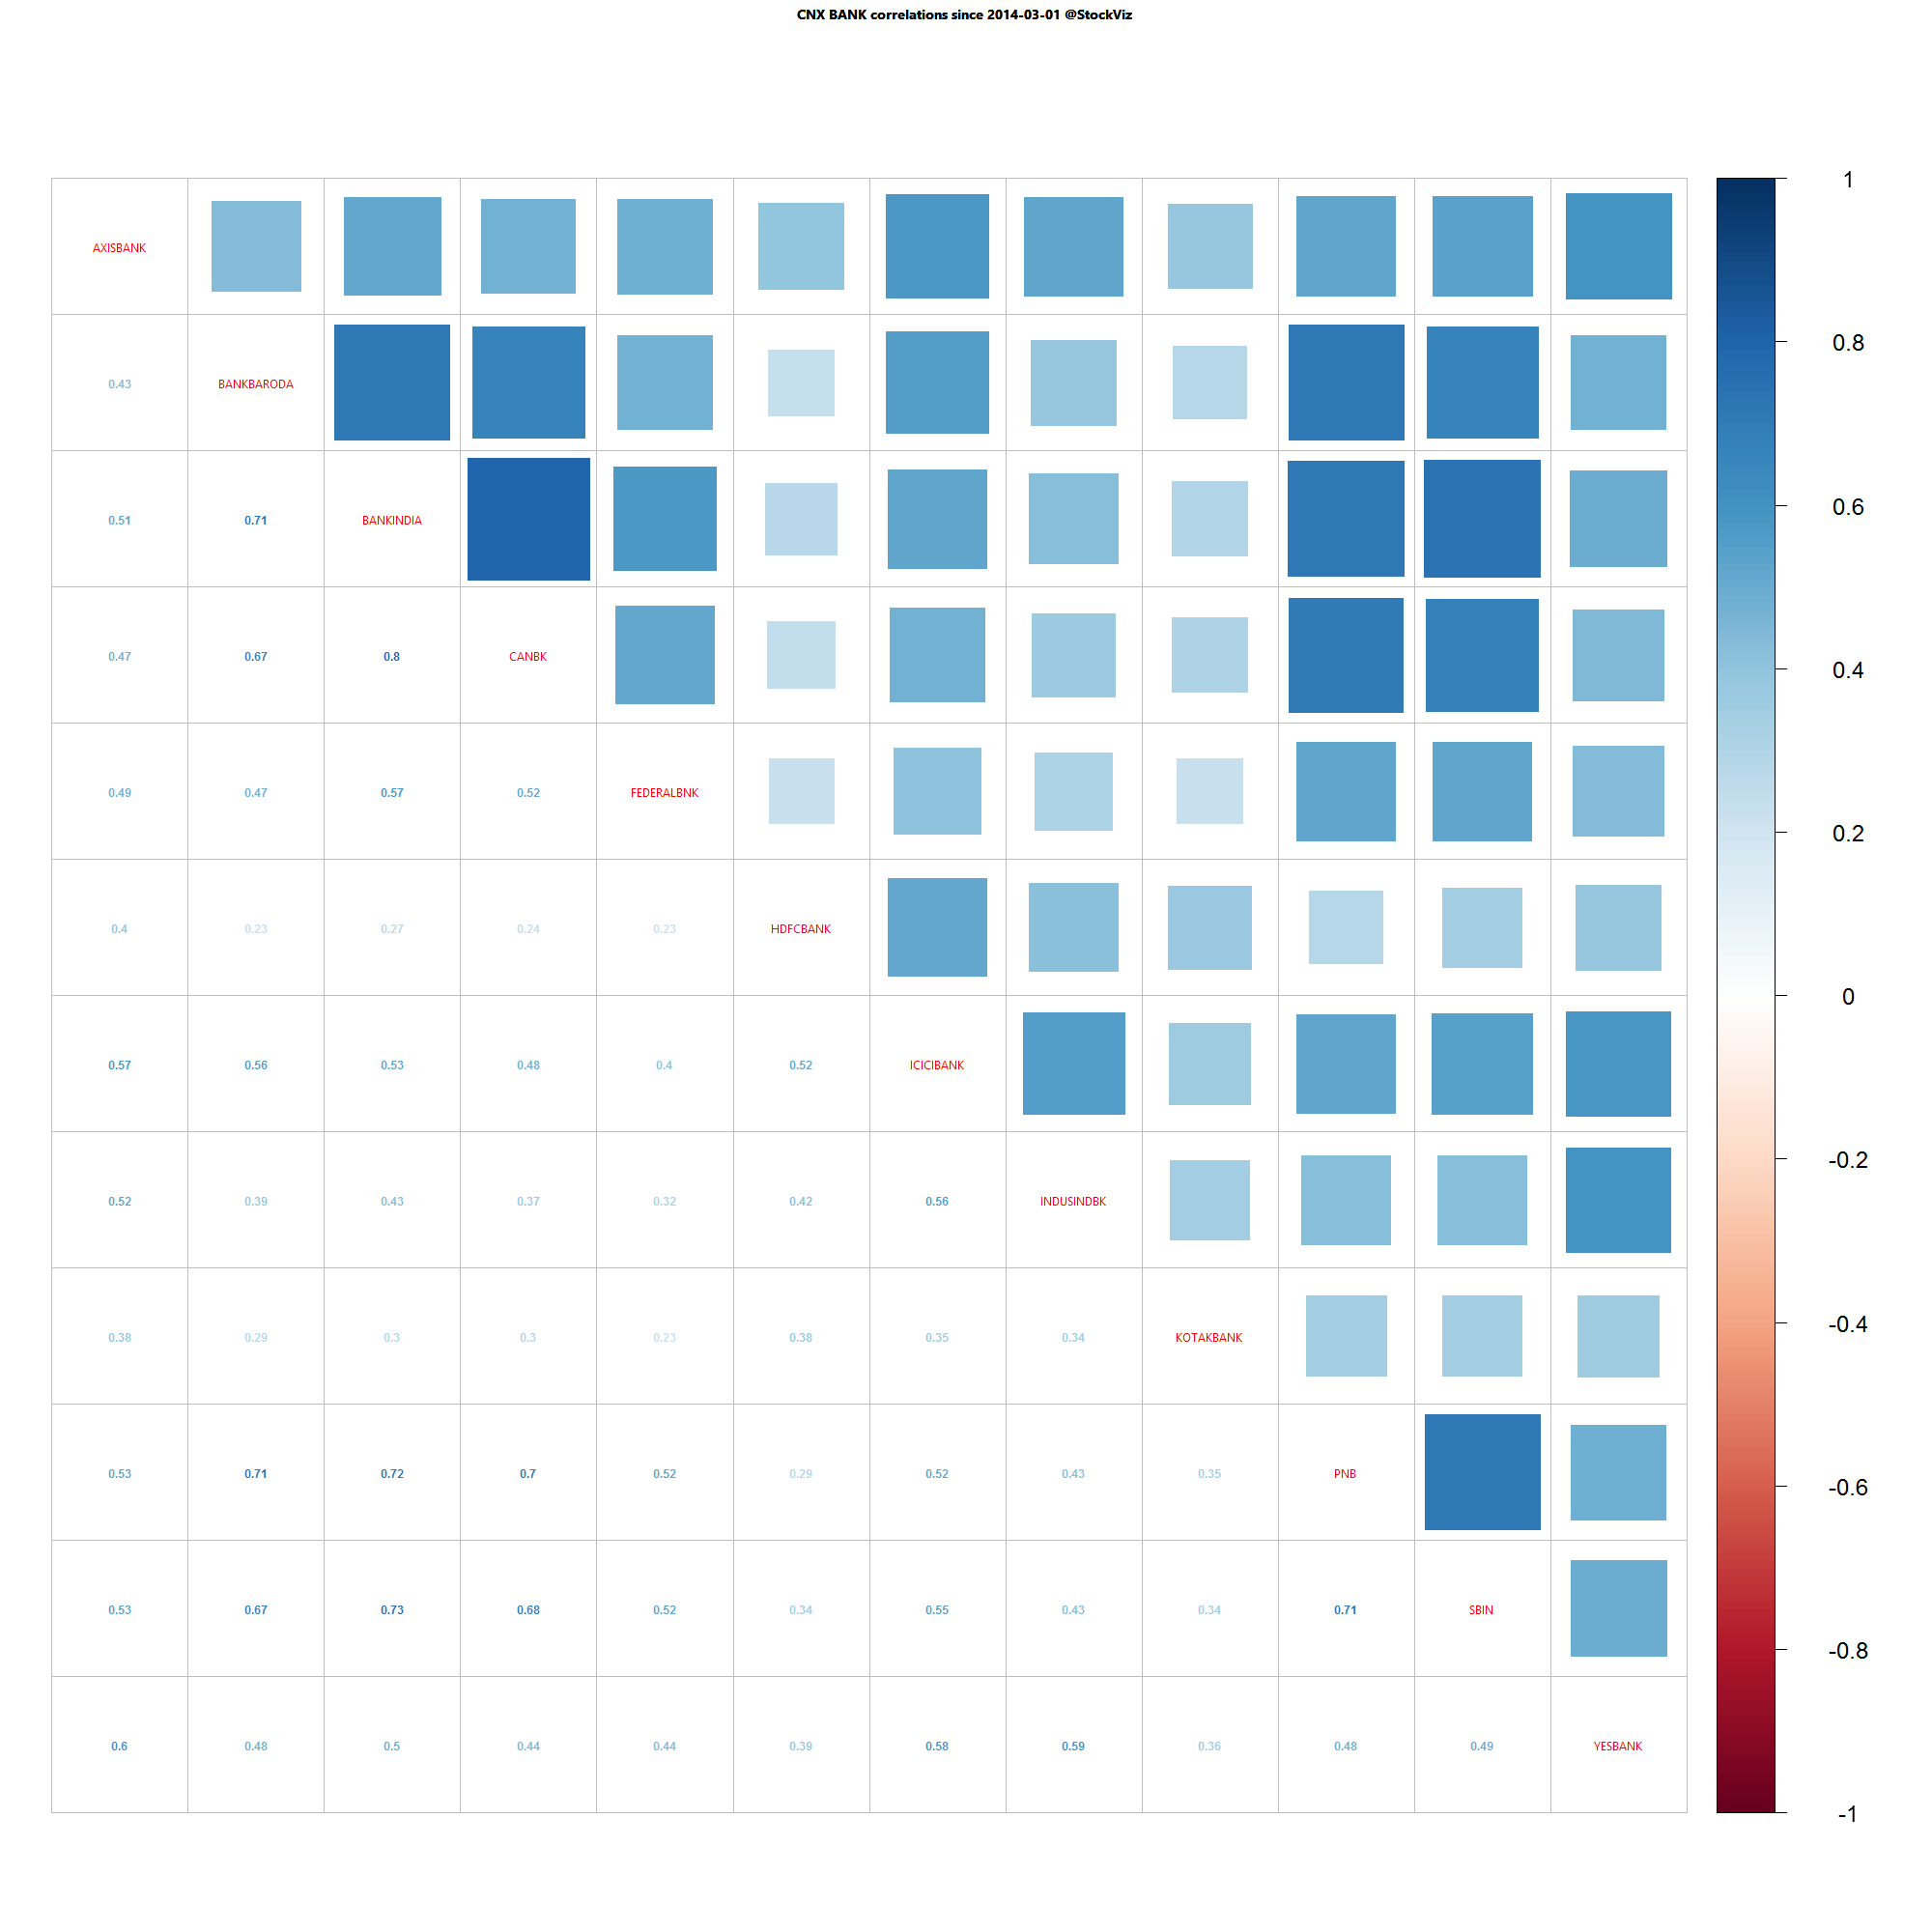
Bank Nifty one year daily return correlations

Bank Nifty one year daily return correlations

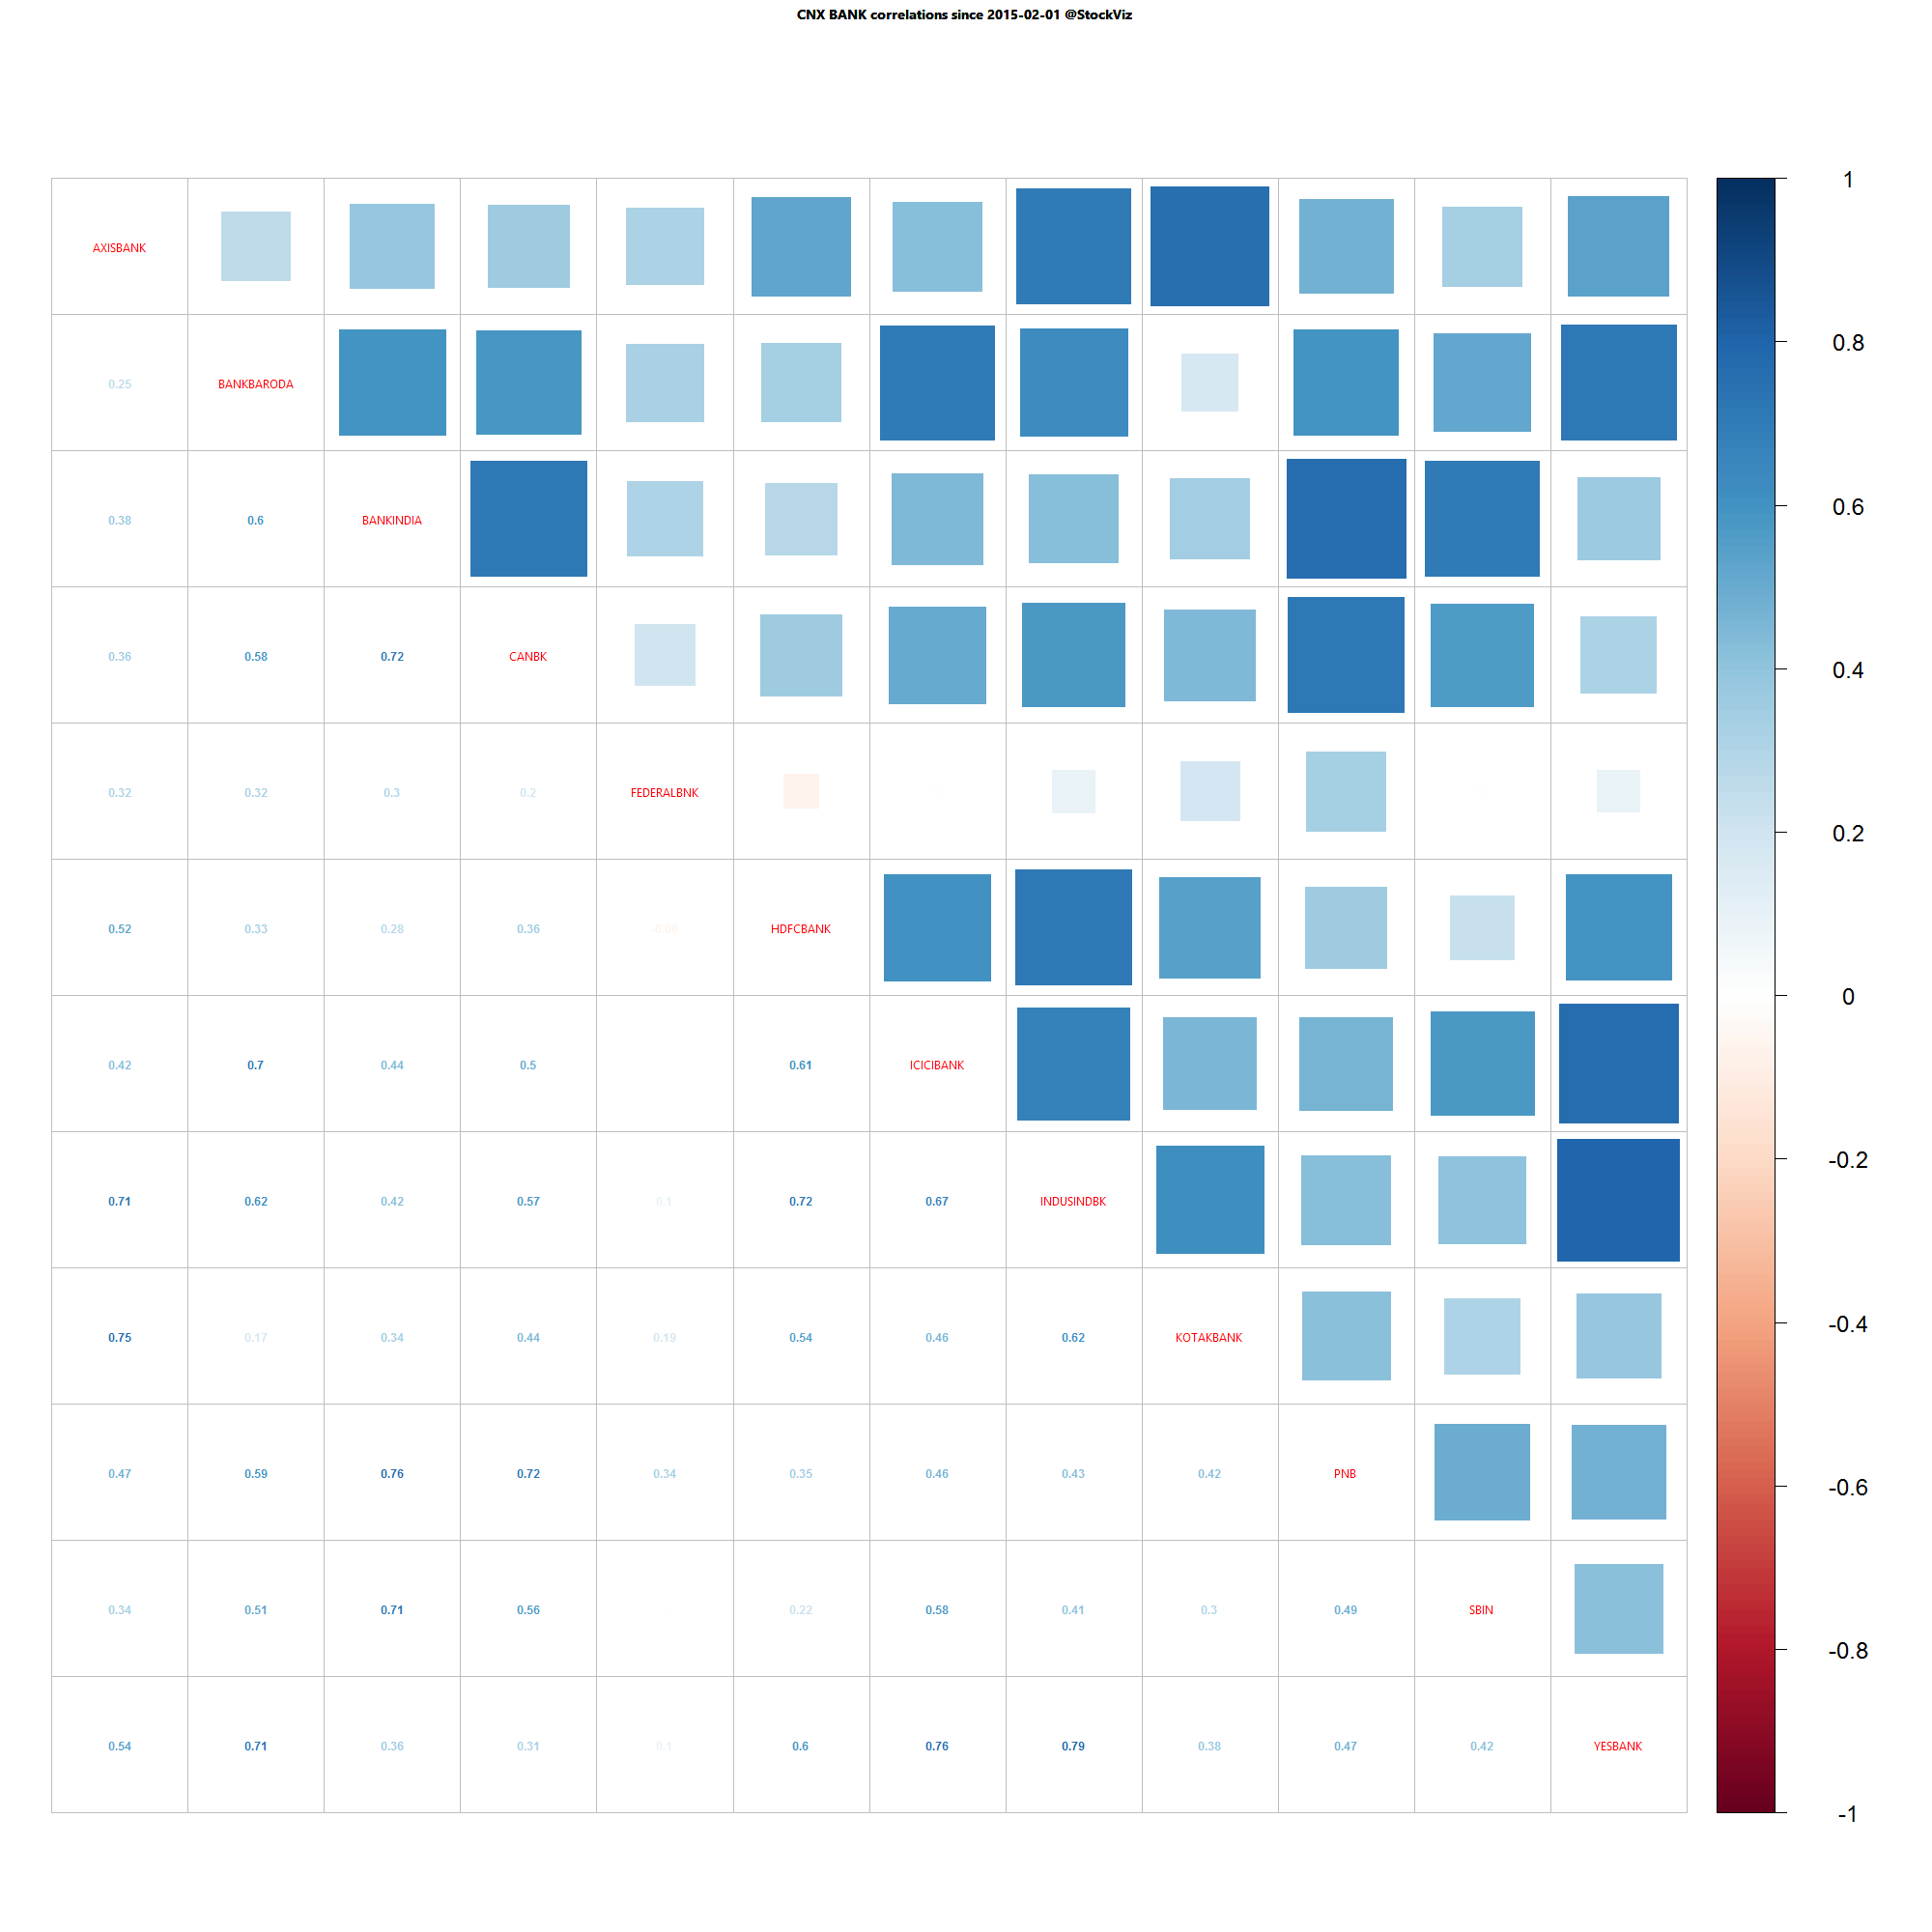
Bank Nifty one month daily return correlations

Bank Nifty one month daily return correlations

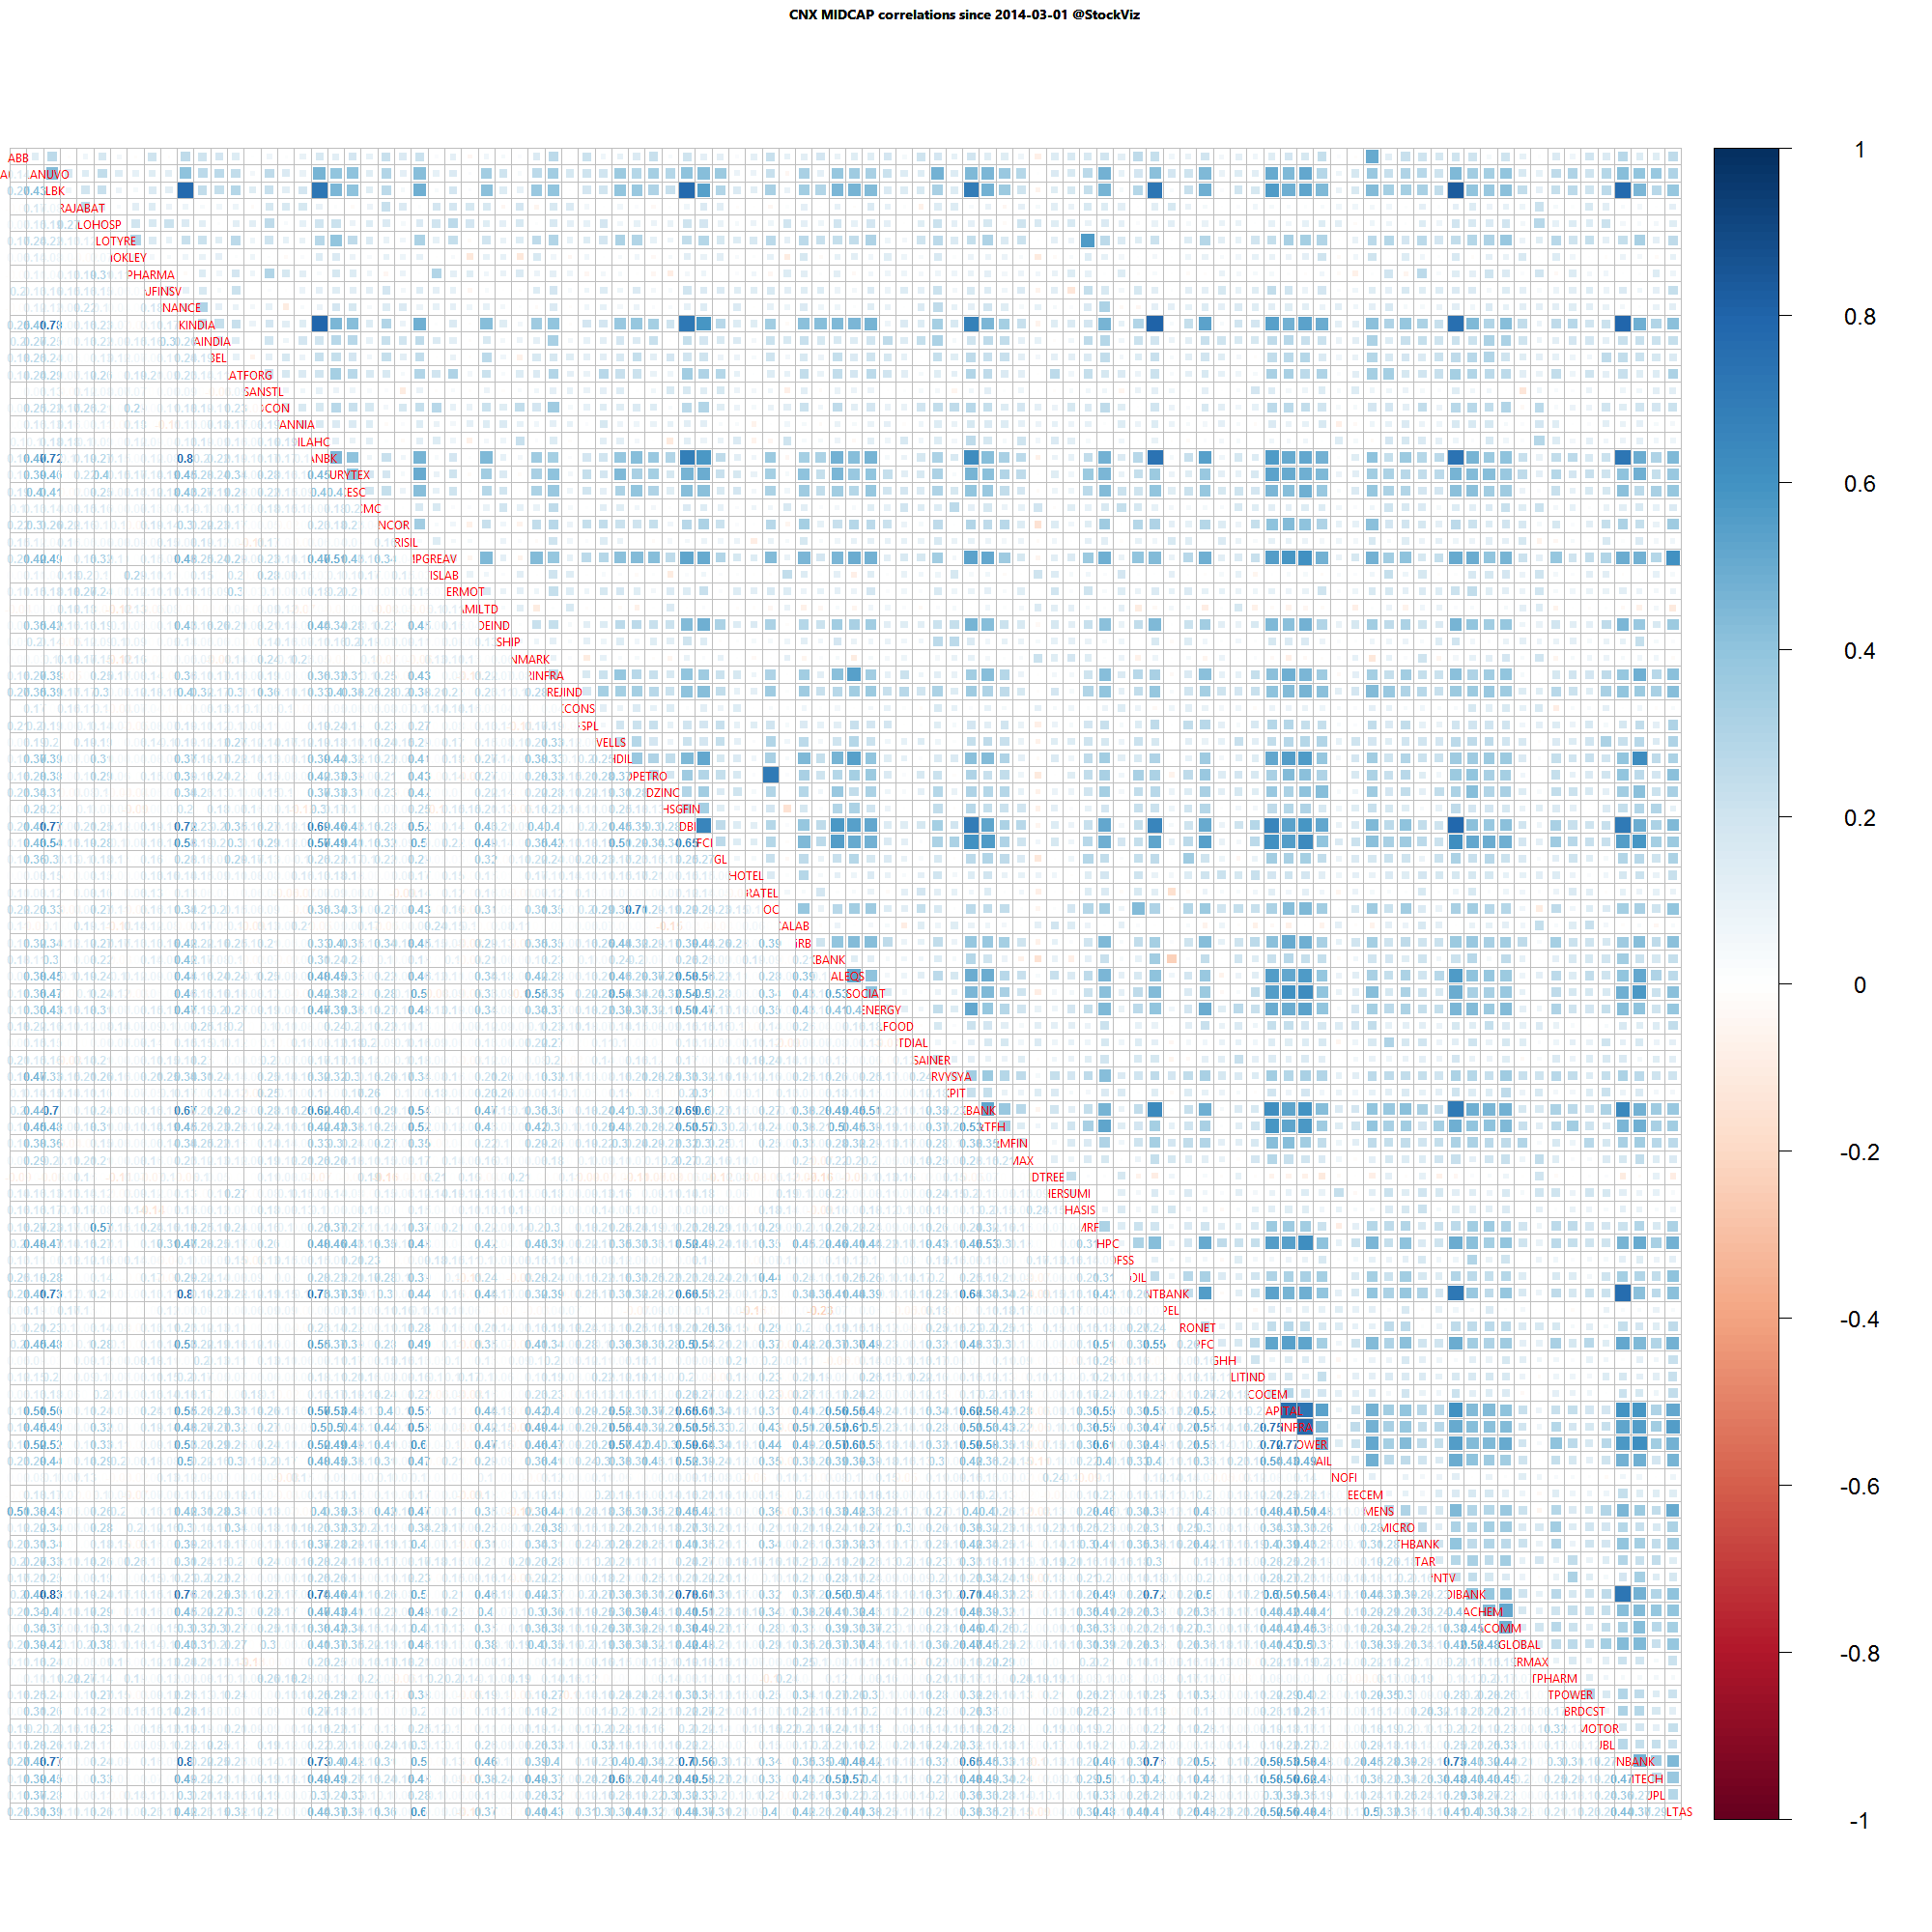
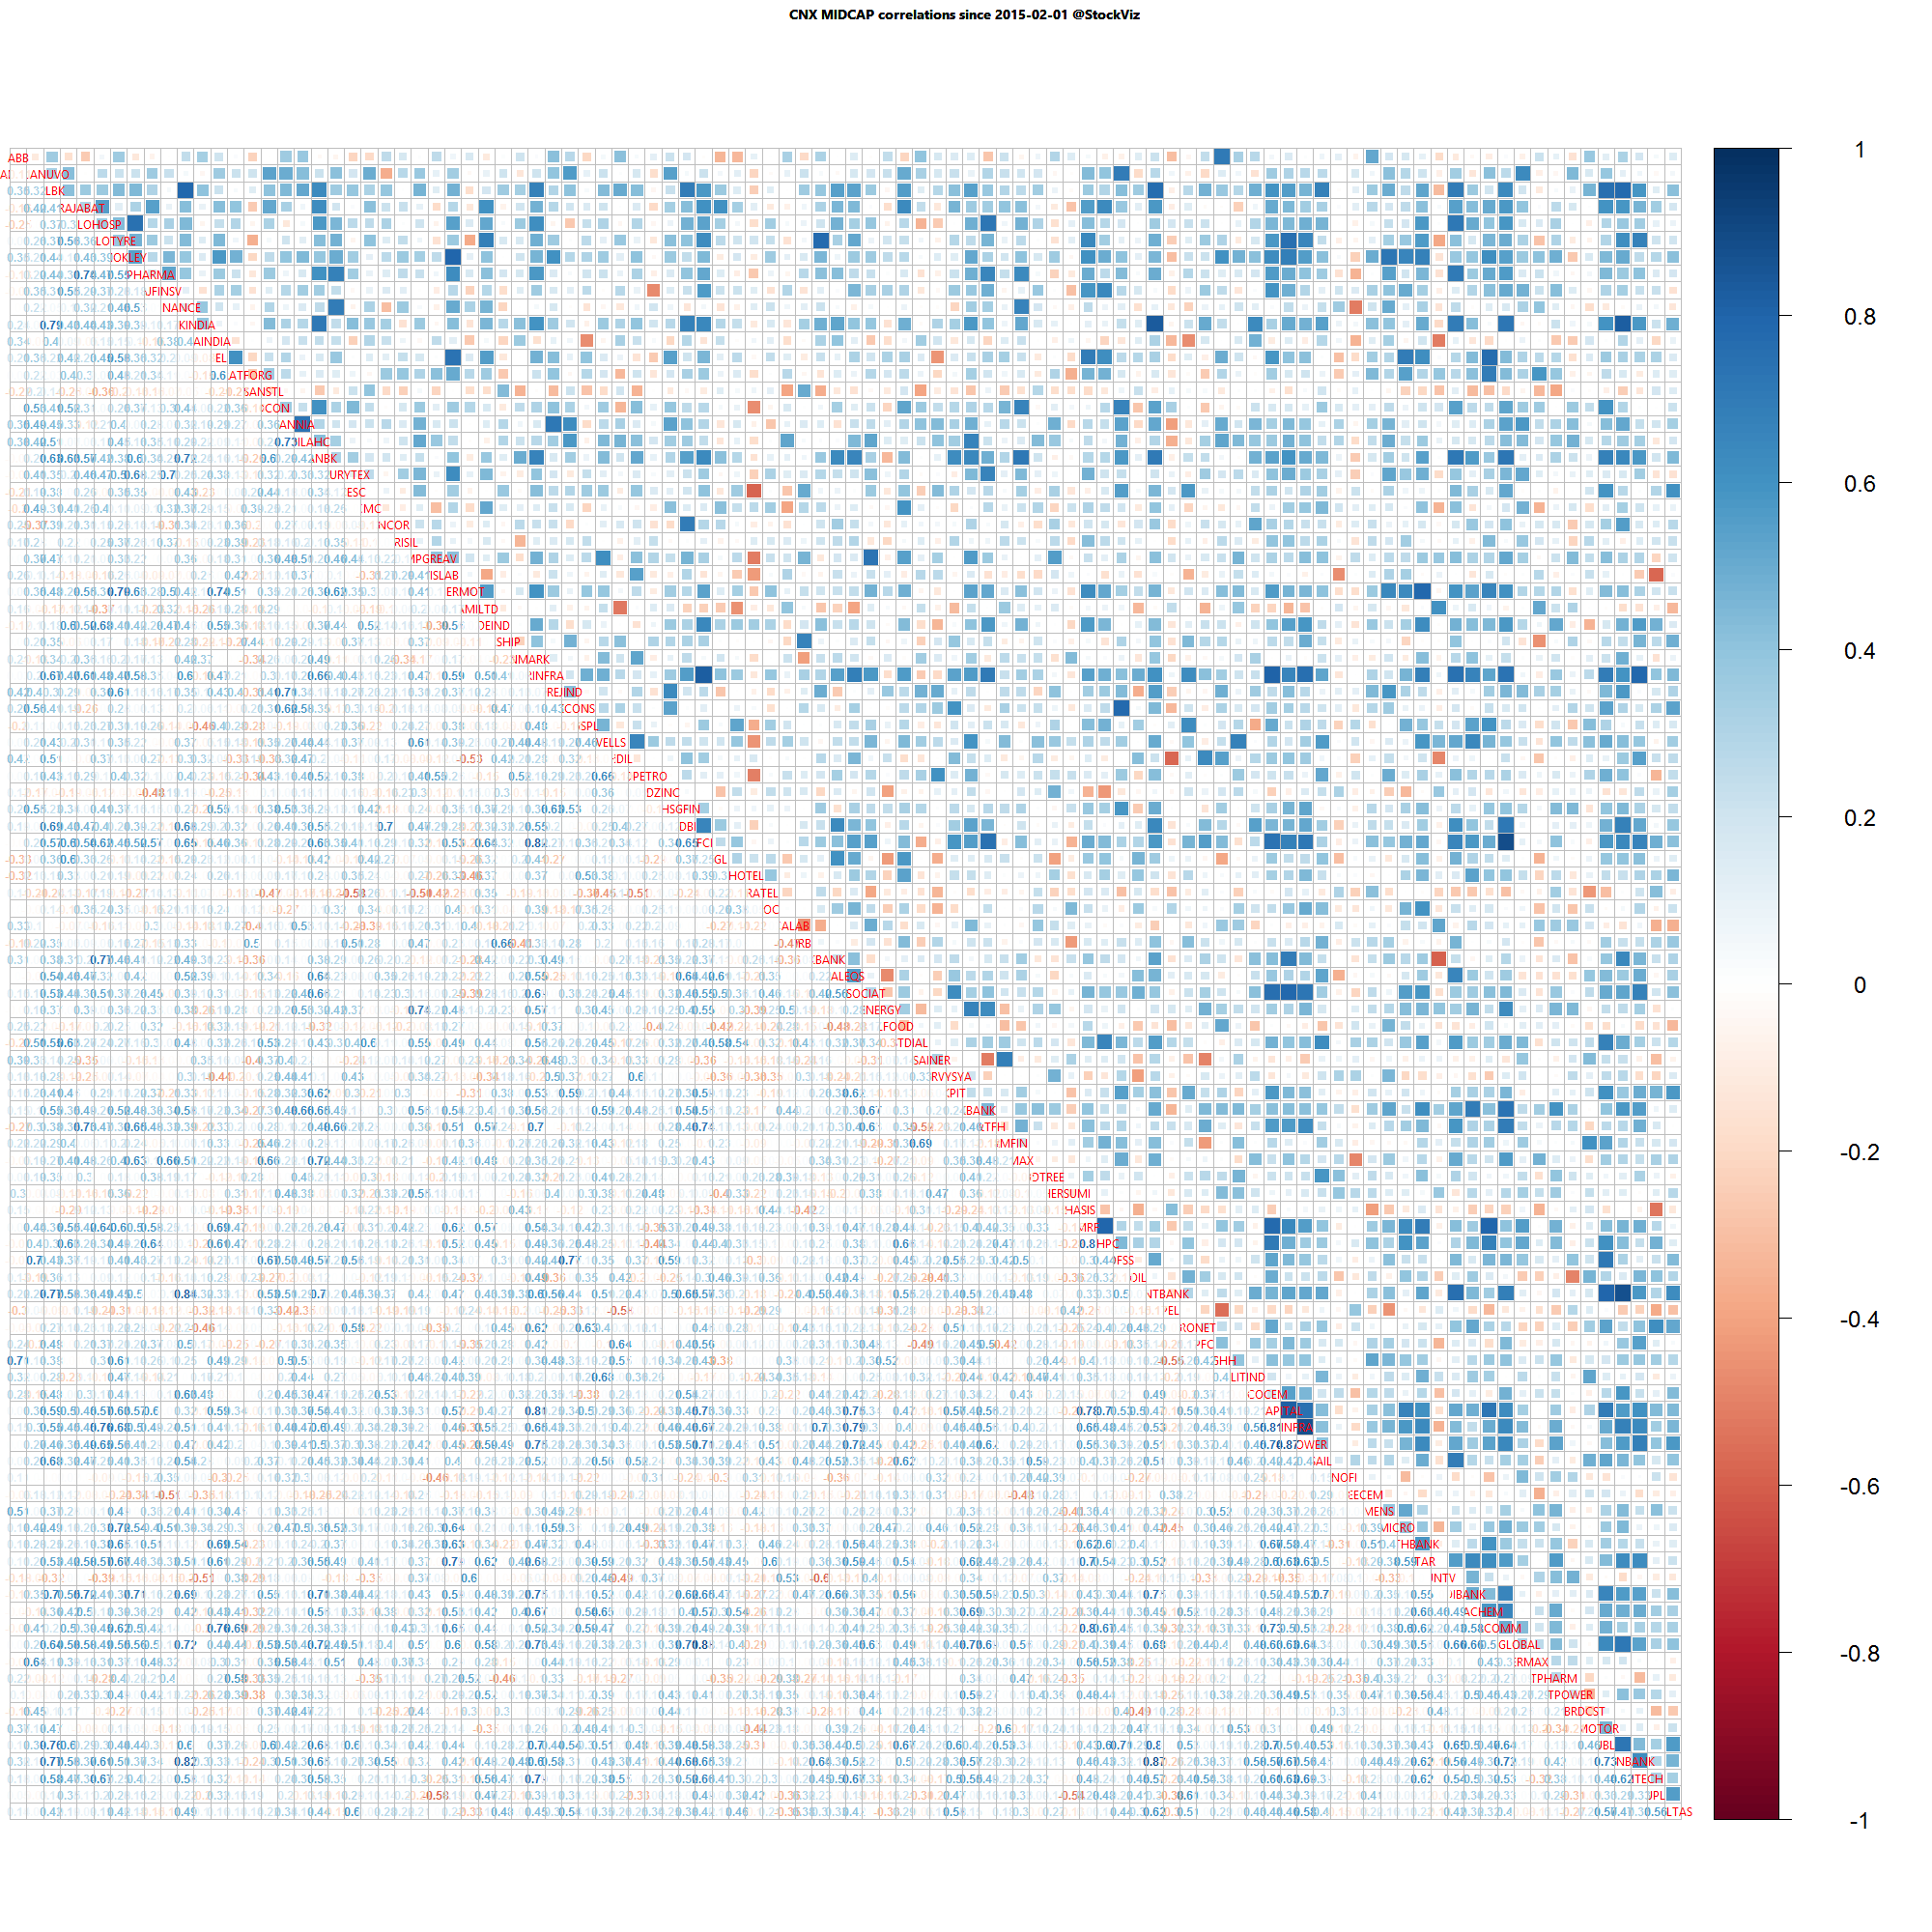
Midcap one year daily return correlations

Midcap one year daily return correlations

Midcap one month daily return correlations

Midcap one month daily return correlations

A lot of thick blue squares mean that positive correlations are high. Red squares mean negative correlations are high. Whites are the doldrums.

Funds that (also) invest in foreign markets

Diversification vs. Returns vs. Currency hedging

Some Indian funds, under the guise of diversification, invest in foreign equities. However, the benefit of diversification comes from investing across asset classes. Does investing in the same asset class, i.e., equities, really give the investor uncorrelated returns? Or are funds using international equities as a rupee-short in disguise?

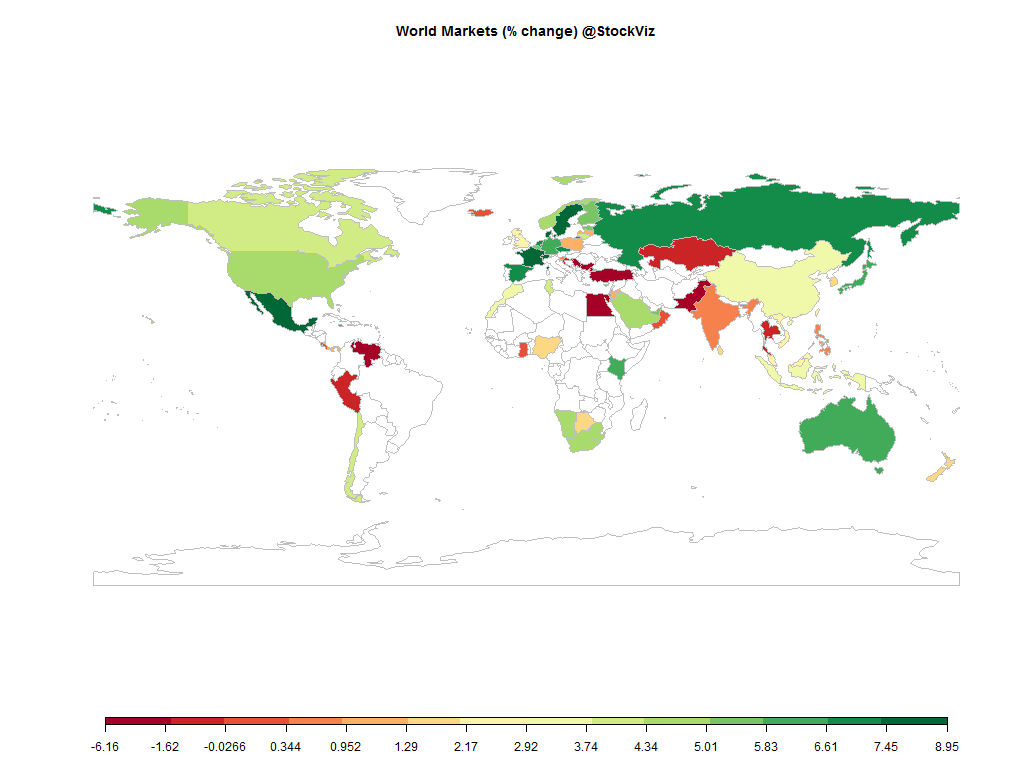
World Equity Correlation

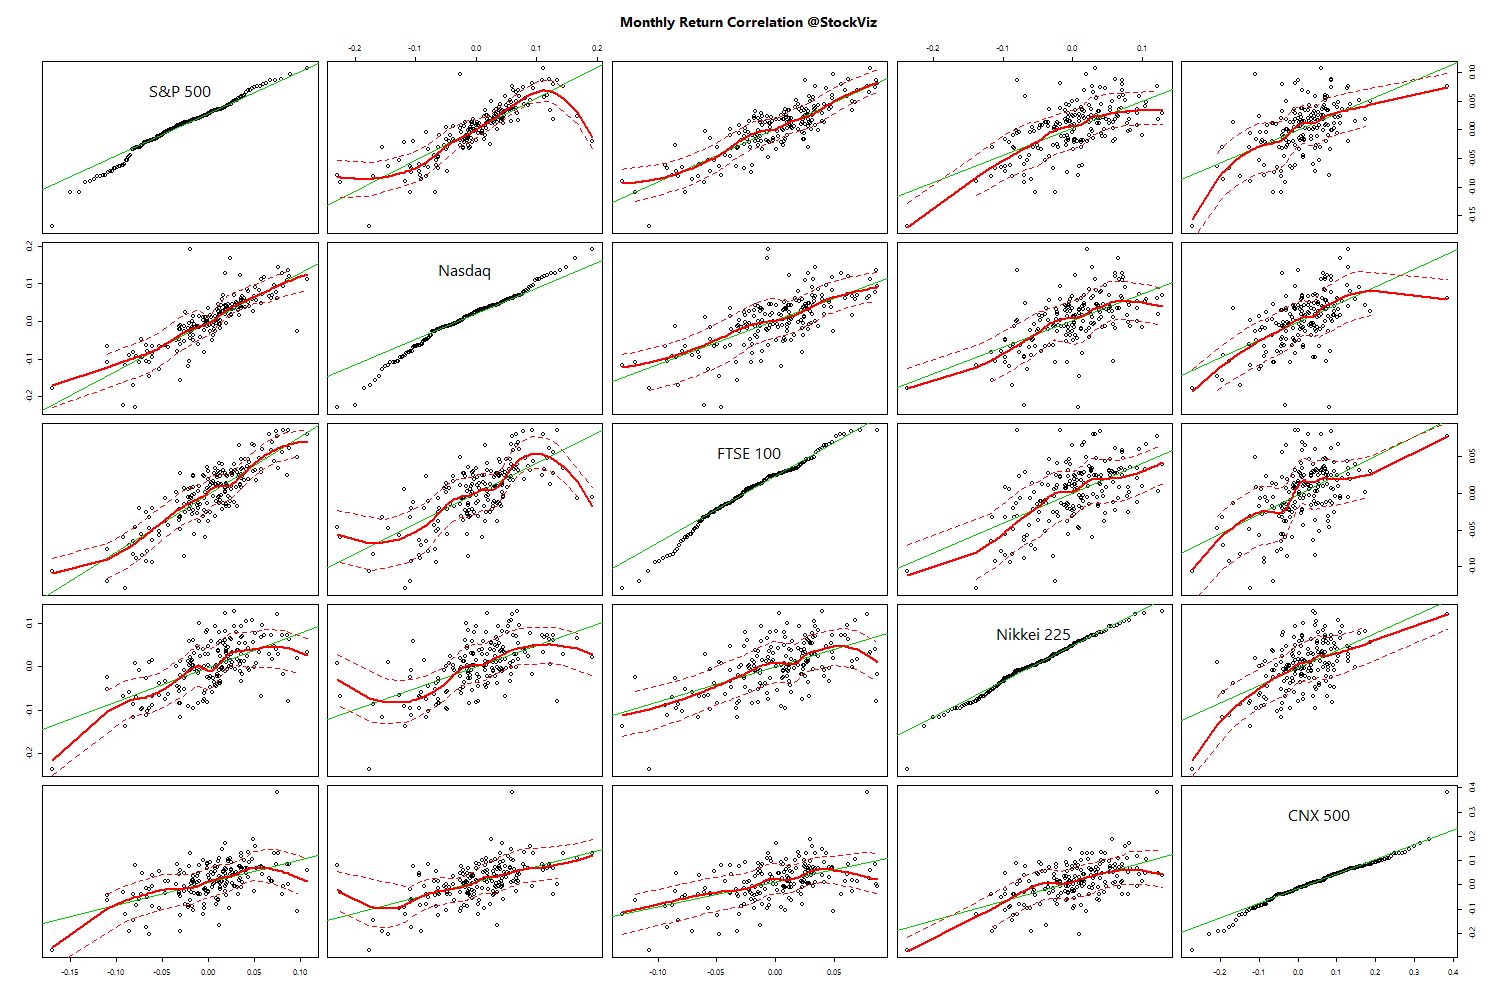
When you run correlations between the monthly returns of the S&P 500, Nasdaq, FTSE 100, Nikkei and CNX 500, here’s what you get:

S&P 500 Nasdaq FTSE 100 Nikkei 225 CNX 500
S&P 500 1.0000000 0.8387130 0.8537901 0.6144493 0.5226191
Nasdaq 0.8387130 1.0000000 0.6913427 0.5909979 0.5499836
FTSE 100 0.8537901 0.6913427 1.0000000 0.5717508 0.5216565
Nikkei 225 0.6144493 0.5909979 0.5717508 1.0000000 0.5633231
CNX 500 0.5226191 0.5499836 0.5216565 0.5633231 1.0000000

world-correlation

A zero or negative correlation would validate the diversification claim. But that is not the case. Indian equities are loosely correlated with international stock markets.

World equity Returns

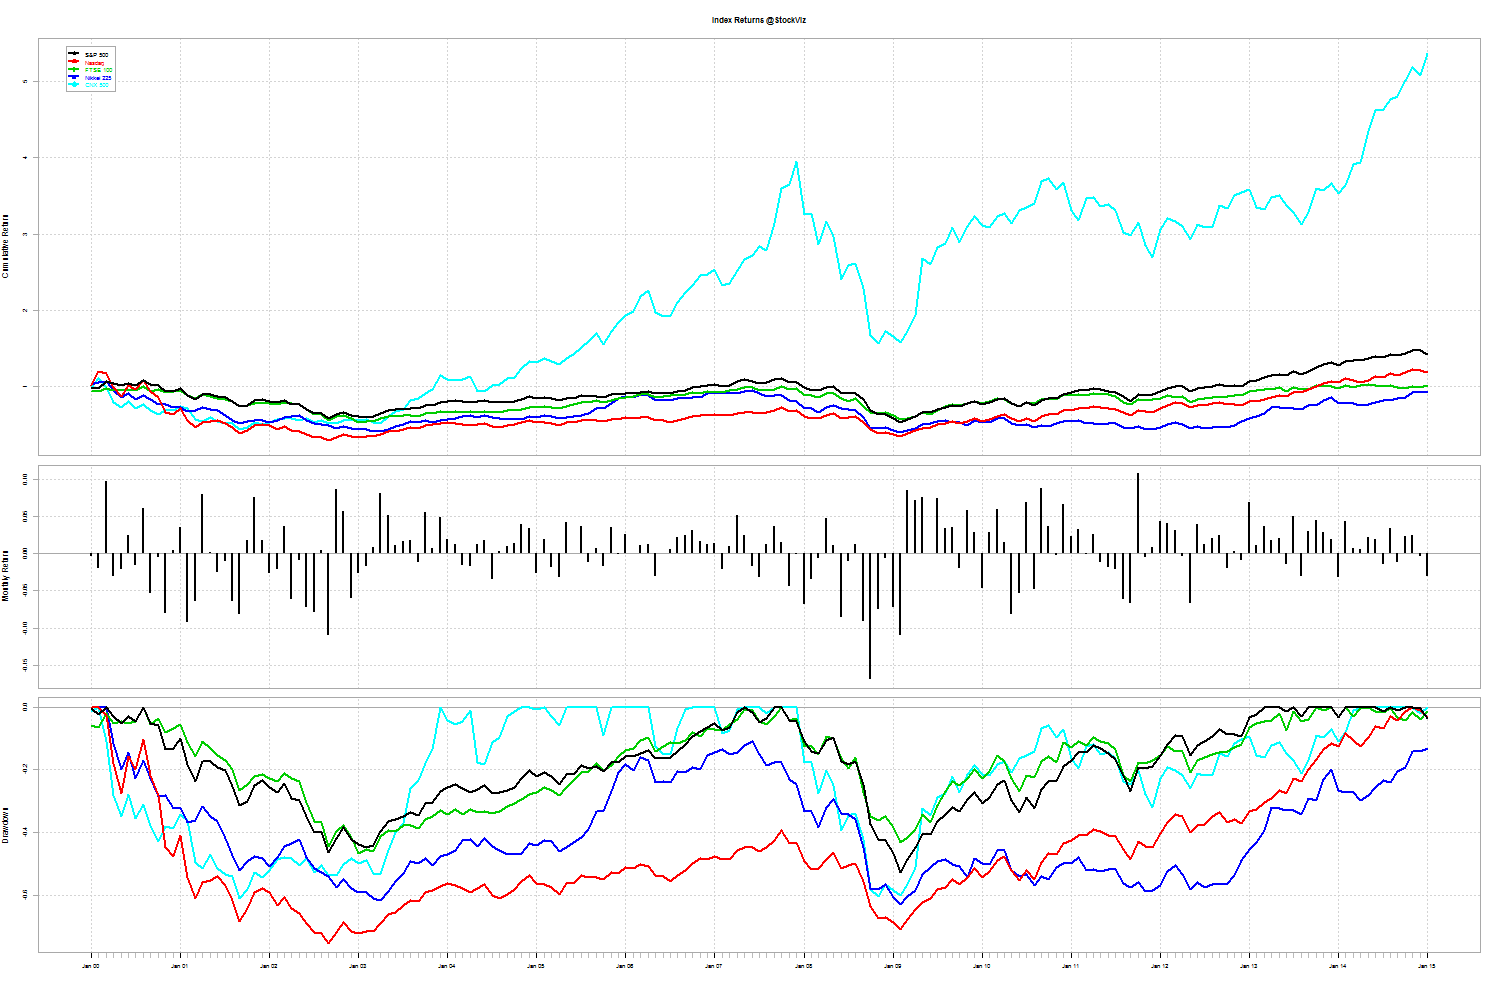
When it comes to returns, Indian equities have outperformed all the main indices.
world equity returns

Currency hedge

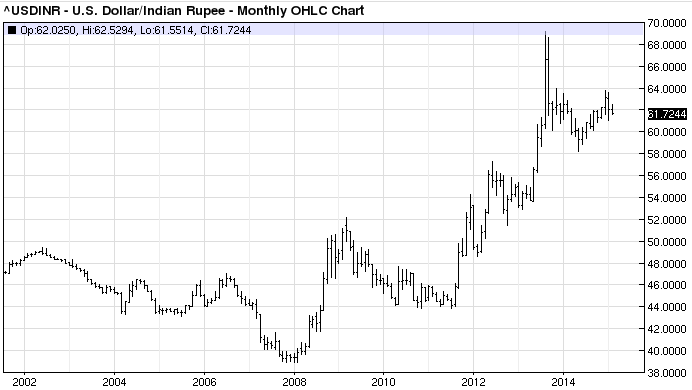
The 50% depreciation in the rupee since 2000, however, make a strong case for adding short-INR/long-USD assets.
USDINR

Competency

Although Rupee depreciation makes a case for holding dollar assets, why do it in a convoluted way by buying individual stocks? The competency of an Indian asset manager in picking stocks in a foreign market is questionable.

For example, the PPFAS fund holds about 20% of its assets in foreign equities. This, at a time when most developed markets have given up on stock-picking and have turned to indexing instead. Can a manager, sitting in India, select stocks in a foreign market that outperform that market?

The problem with a mixed-in portfolio like PPFAS is that it is very difficult to break performance down to its components. Between 2014-01-01 and 2015-02-25, PPFAS Long Term Value Fund has returned a cumulative 44.20% with an IRR of 37.45% vs. BSE MID CAP’s cumulative return of 58.84% and an IRR of 49.50%. (http://svz.bz/1DZzX1L)

Conclusion

Exposure to US Dollar assets makes sense given the historical depreciation of the Indian rupee against the US dollar. However, we are not convinced that buying a fund that tries to pick stocks in foreign markets is the way to go. Investors would be better of being net short the rupee, or buying the S&P 500 ETF separately.
Mad Trading: Mutual Fund Edition

Churn and Burn

When retail investors trade stocks, the market impact of trading decisions are de minimis. However, when a fund trades its portfolio, it has a noticeable market impact. According to a study quoted here in the Economist article, when academics compared the returns of the funds with their estimated trading costs, the funds with the highest costs had the lowest returns.

For contrast, lets compare the DWS Tax Saving Fund with Templeton India Growth Fund.

DWS Tax Saving Fund

First, investors would have been better off buying a CNX Midcap index fund. Between 2006-06-01 and 2015-02-19, DWS TAX SAVING FUND has returned a cumulative 143.52% with an IRR of 10.74% vs. CNX Midcap’s cumulative return of 209.71% and an IRR of 13.83%. (http://svz.bz/1EHGTxu)

Second, the fund looks like a fun trading vehicle for the manager rather than something that is meant to build wealth over the long term. Here’s how the manager has churned his portfolio:

Not only should you stay away from this fund, but you should use it in informational videos on how not to churn your portfolio.

Templeton India Growth Fund

First, even though returns are not the absolute best that it could have been, between 2006-06-01 and 2015-02-19, Templeton India Growth Fund has returned a cumulative 267.72% with an IRR of 16.09%.(http://svz.bz/1EHIljm)

Second, the portfolio doesn’t look like a mad scramble like the one above. Markedly fewer holdings for longer:

When you compare the two funds with each other, you can see who is doing a better job (http://svz.bz/1EHJCa2):

DWS TAX SAVING FUND vs. Templeton India Growth Fund

Conclusion

Beware of funds that churn their portfolios frequently. It might be a reflection of shoddy research, poor conviction or immaturity that you end up paying for.

How to spend your money

The wisdom of the grandmothers has it that money can’t buy happiness. But latest research seems to have reached a somewhat uneasy conclusion that the problem is that people don’t know how to spend it.

“If money doesn’t make you happy, then you probably aren’t spending it right,” Dunn, Gilbert and Wilson (pdf) distills tons of research in to eight succinct guidelines. Here’s how you should spend your money:

  1. Buy experiences instead of things
  2. Help others instead of yourself
  3. Buy many small pleasures instead of few big ones
  4. Buy less insurance
  5. Pay now and consume later
  6. Think about what you’re not thinking about
  7. Beware of comparison shopping
  8. Follow the herd instead of your head

And here’s the conclusion worthy of being nailed to the wall:

Our money provides us with satisfaction when we think about it, but not when we use it. Money can buy many, if not most, if not all of the things that make people happy, and if it doesn’t, then the fault is ours.

So go ahead, make more money, minus the guilt, and buy some happiness with it!