Category: Your Money

Correlation Update 28.03.2015

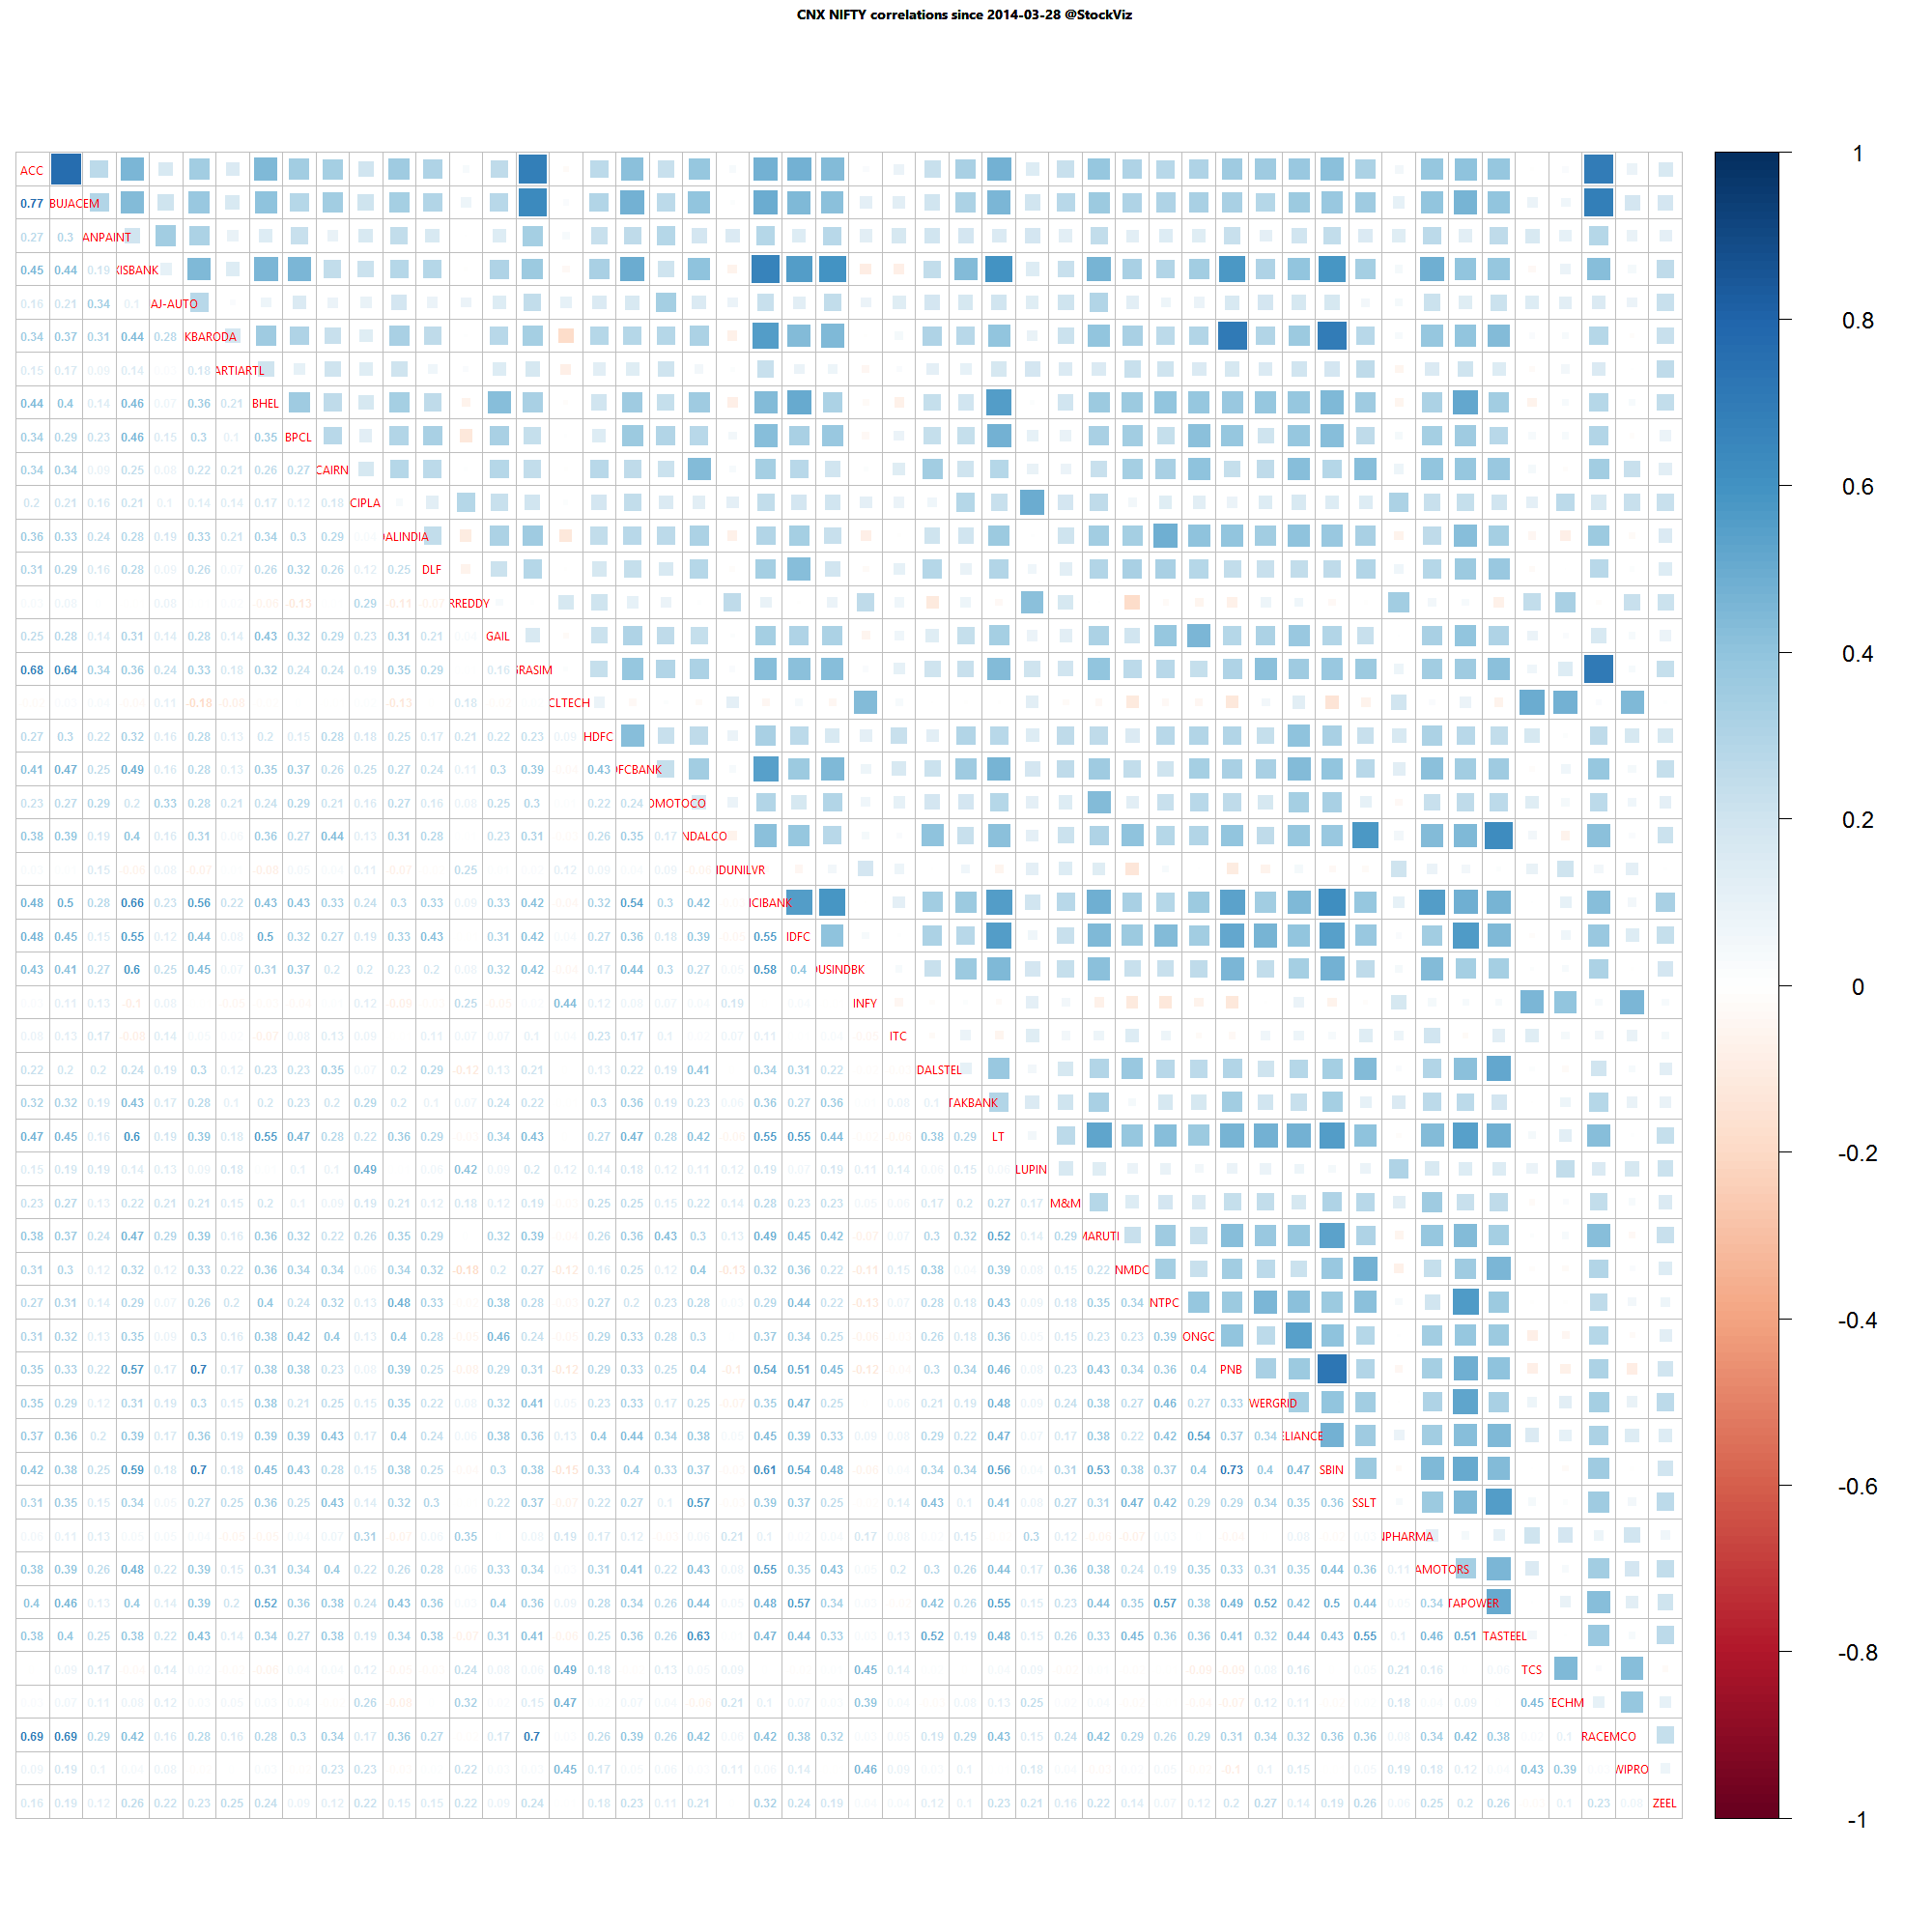
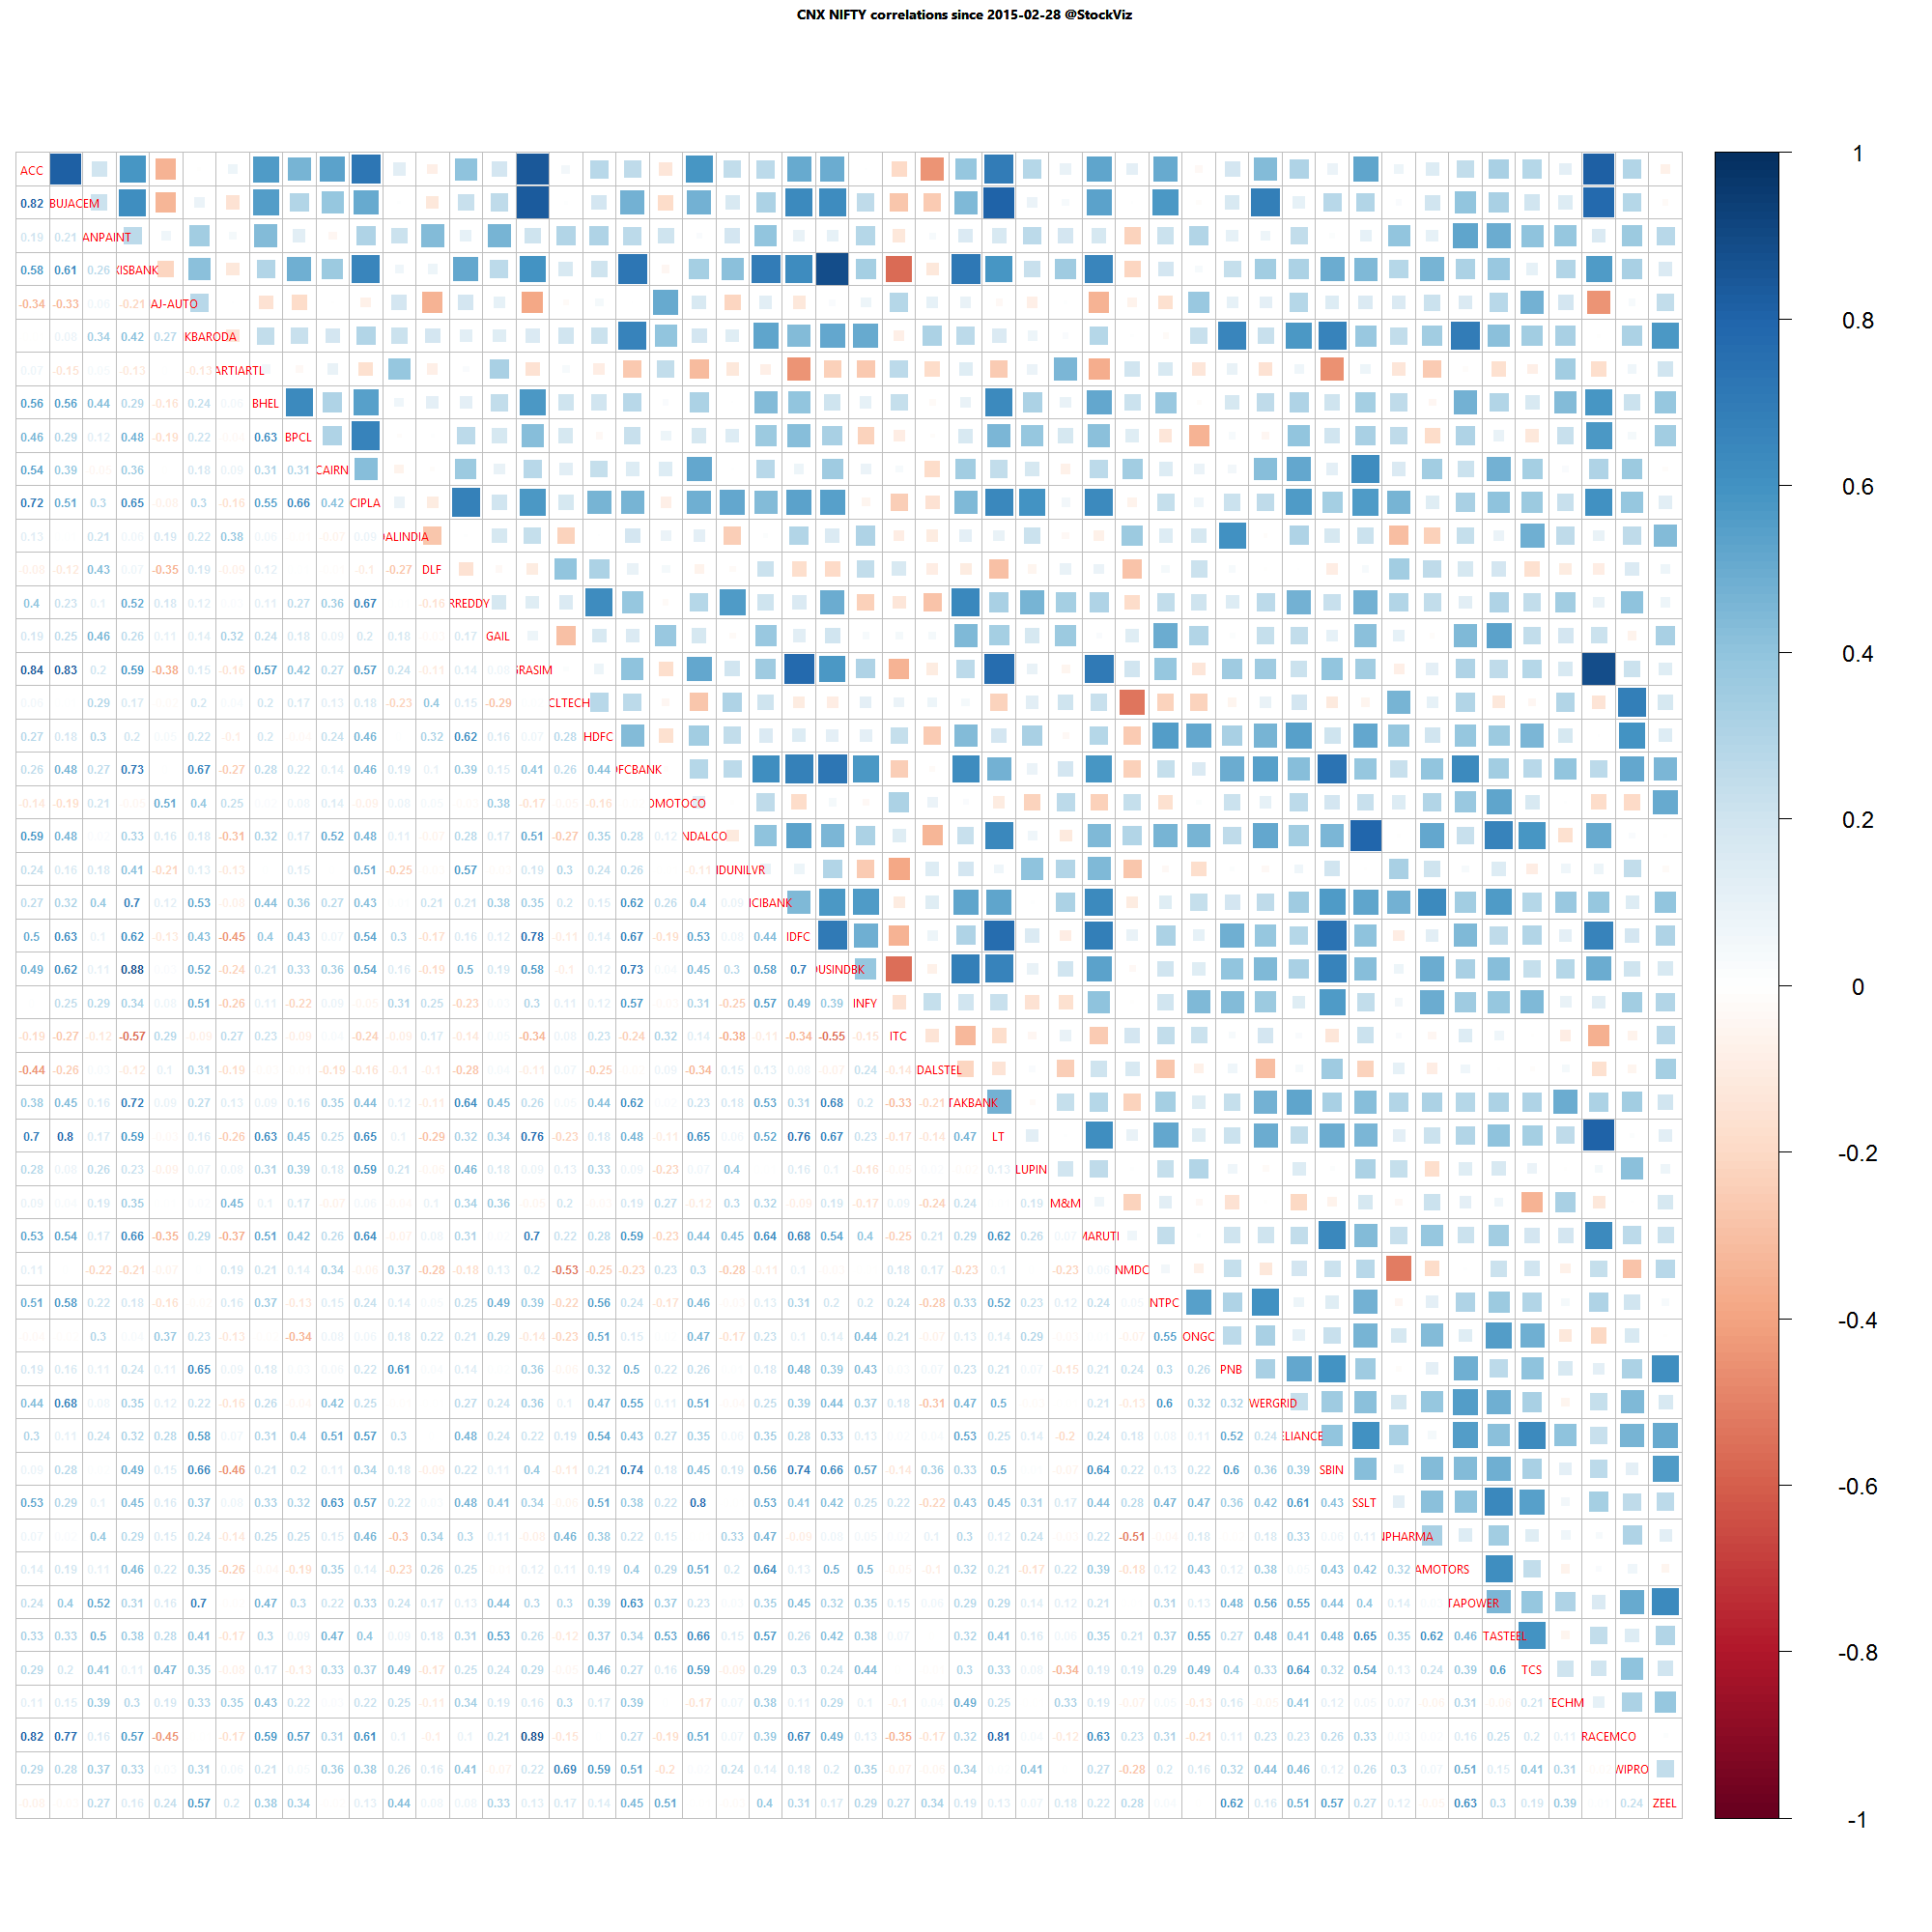
Nifty one year daily return correlations

Nifty one year daily return correlations

Nifty one month daily return correlations

Nifty one month daily return correlations

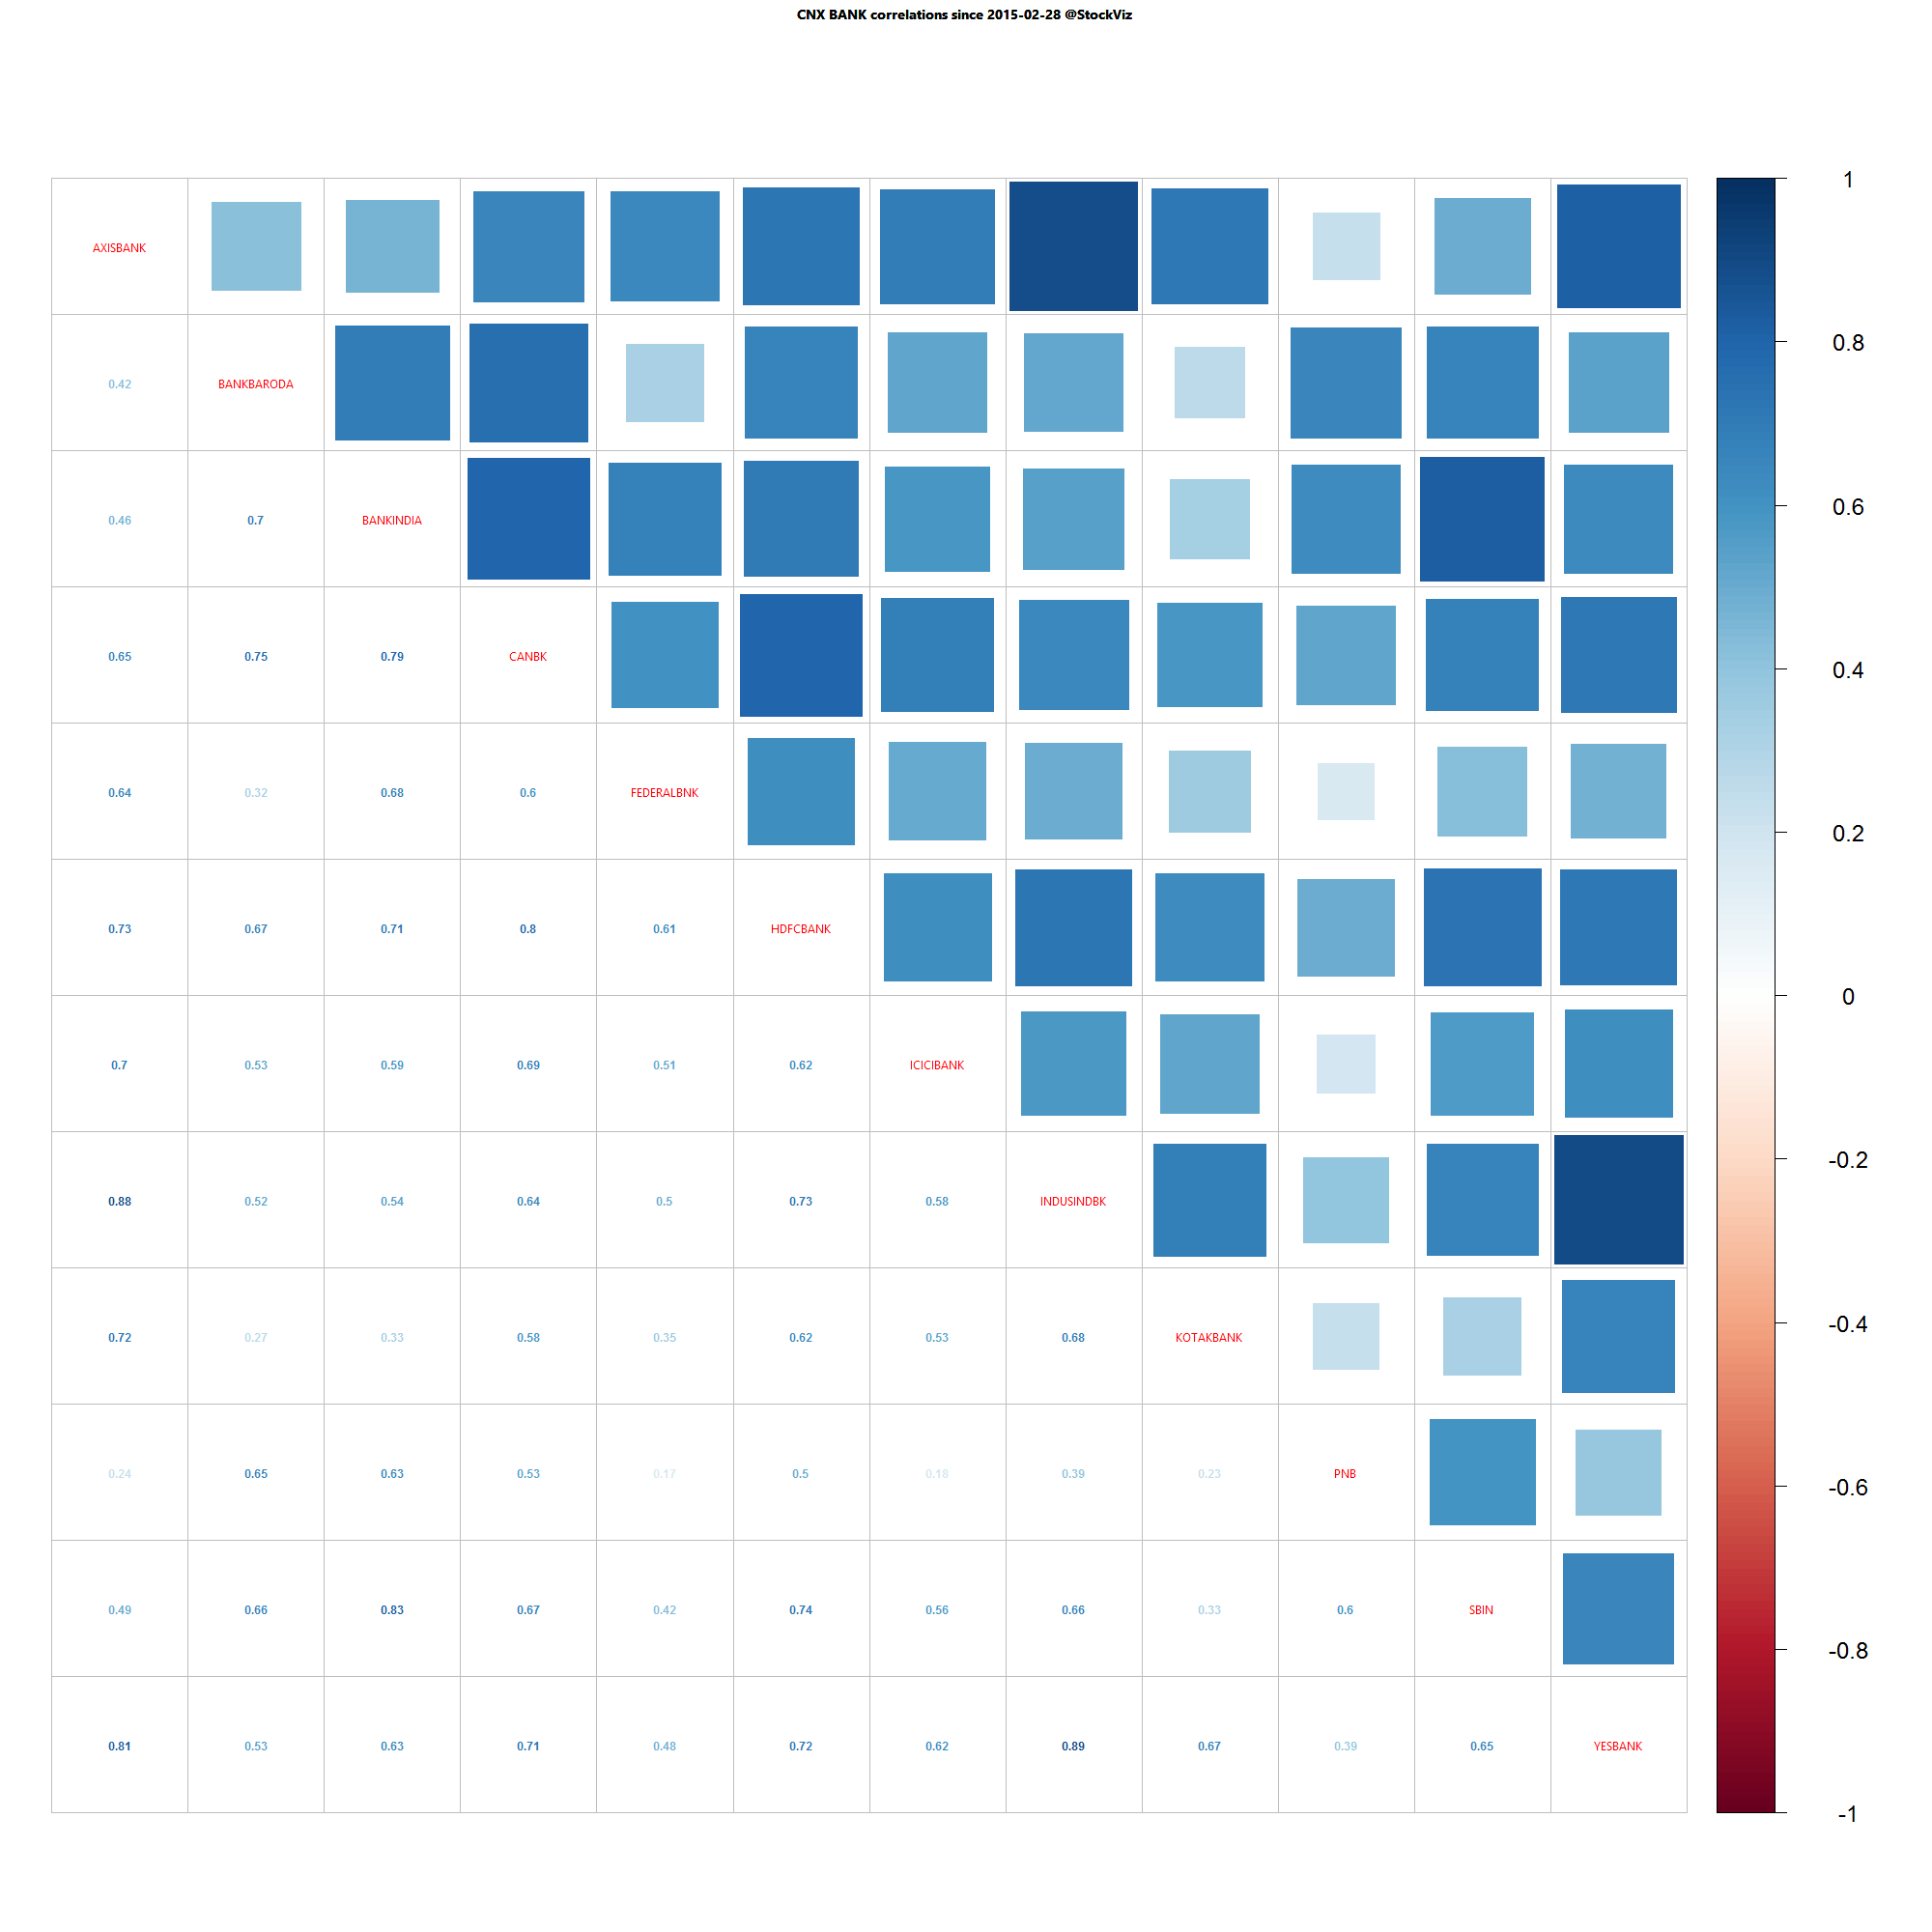
Bank Nifty one year daily return correlations

Bank Nifty one year daily return correlations

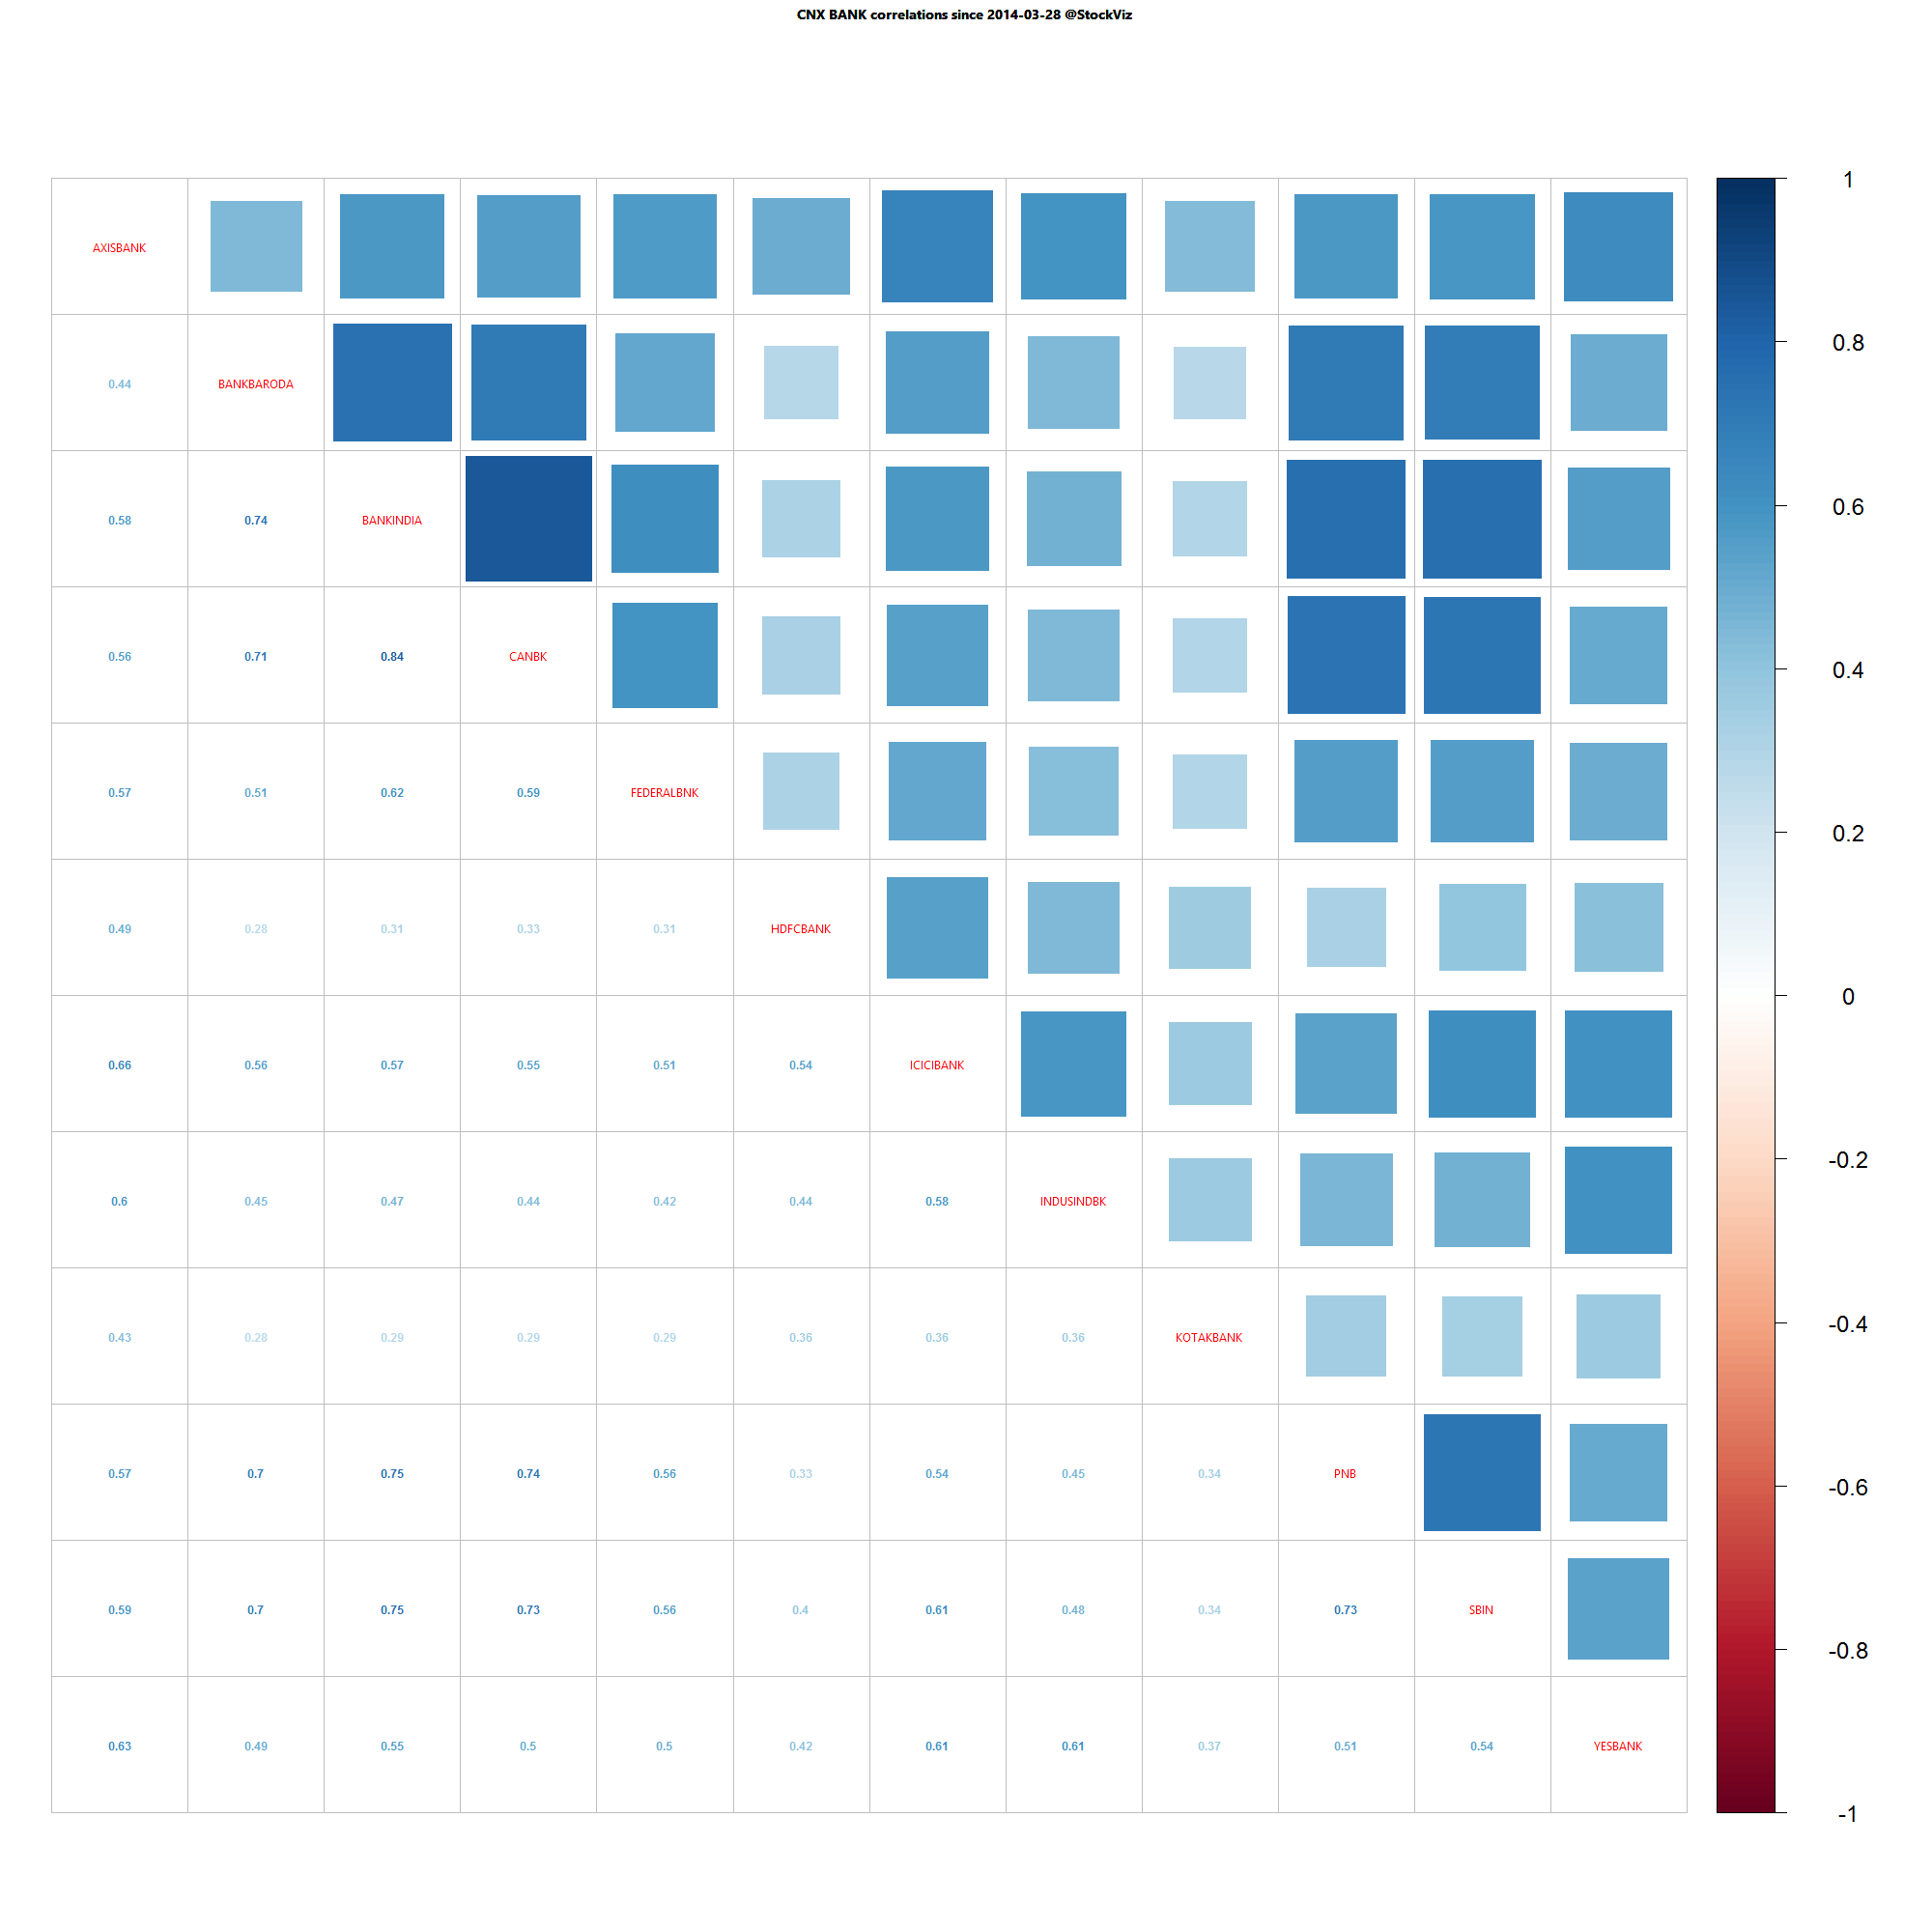
Bank Nifty one month daily return correlations

Bank Nifty one month daily return correlations

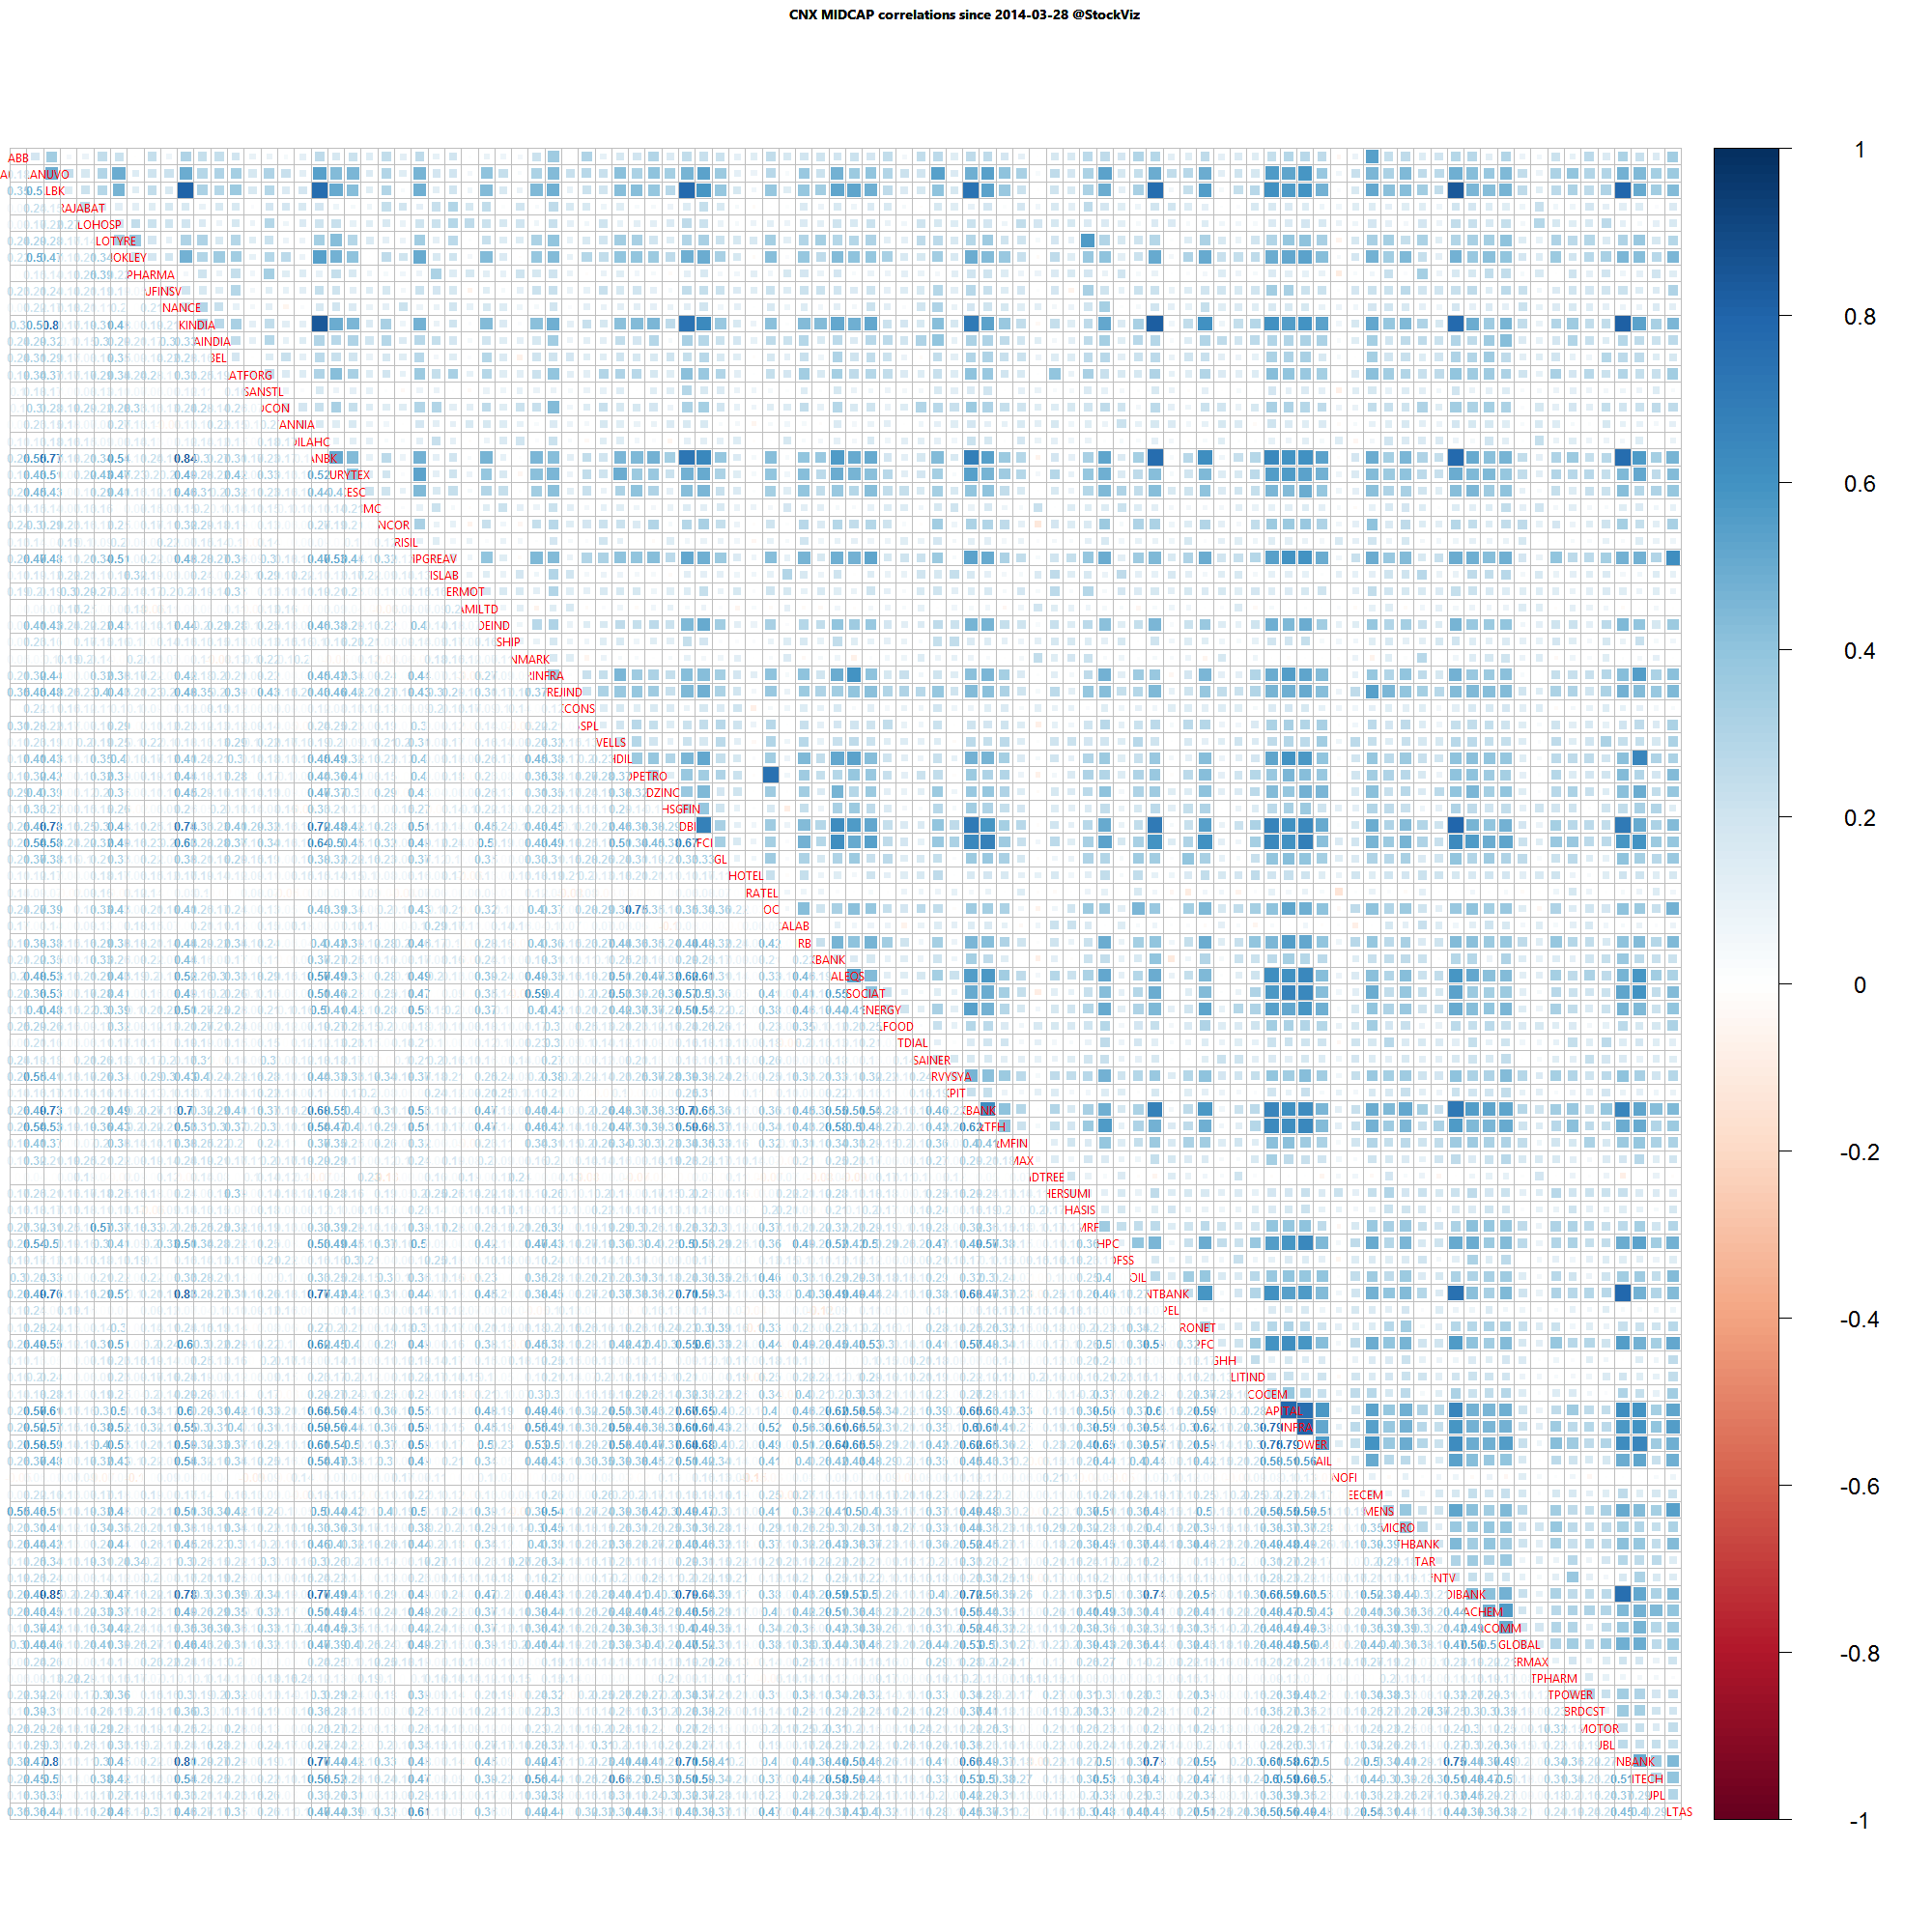
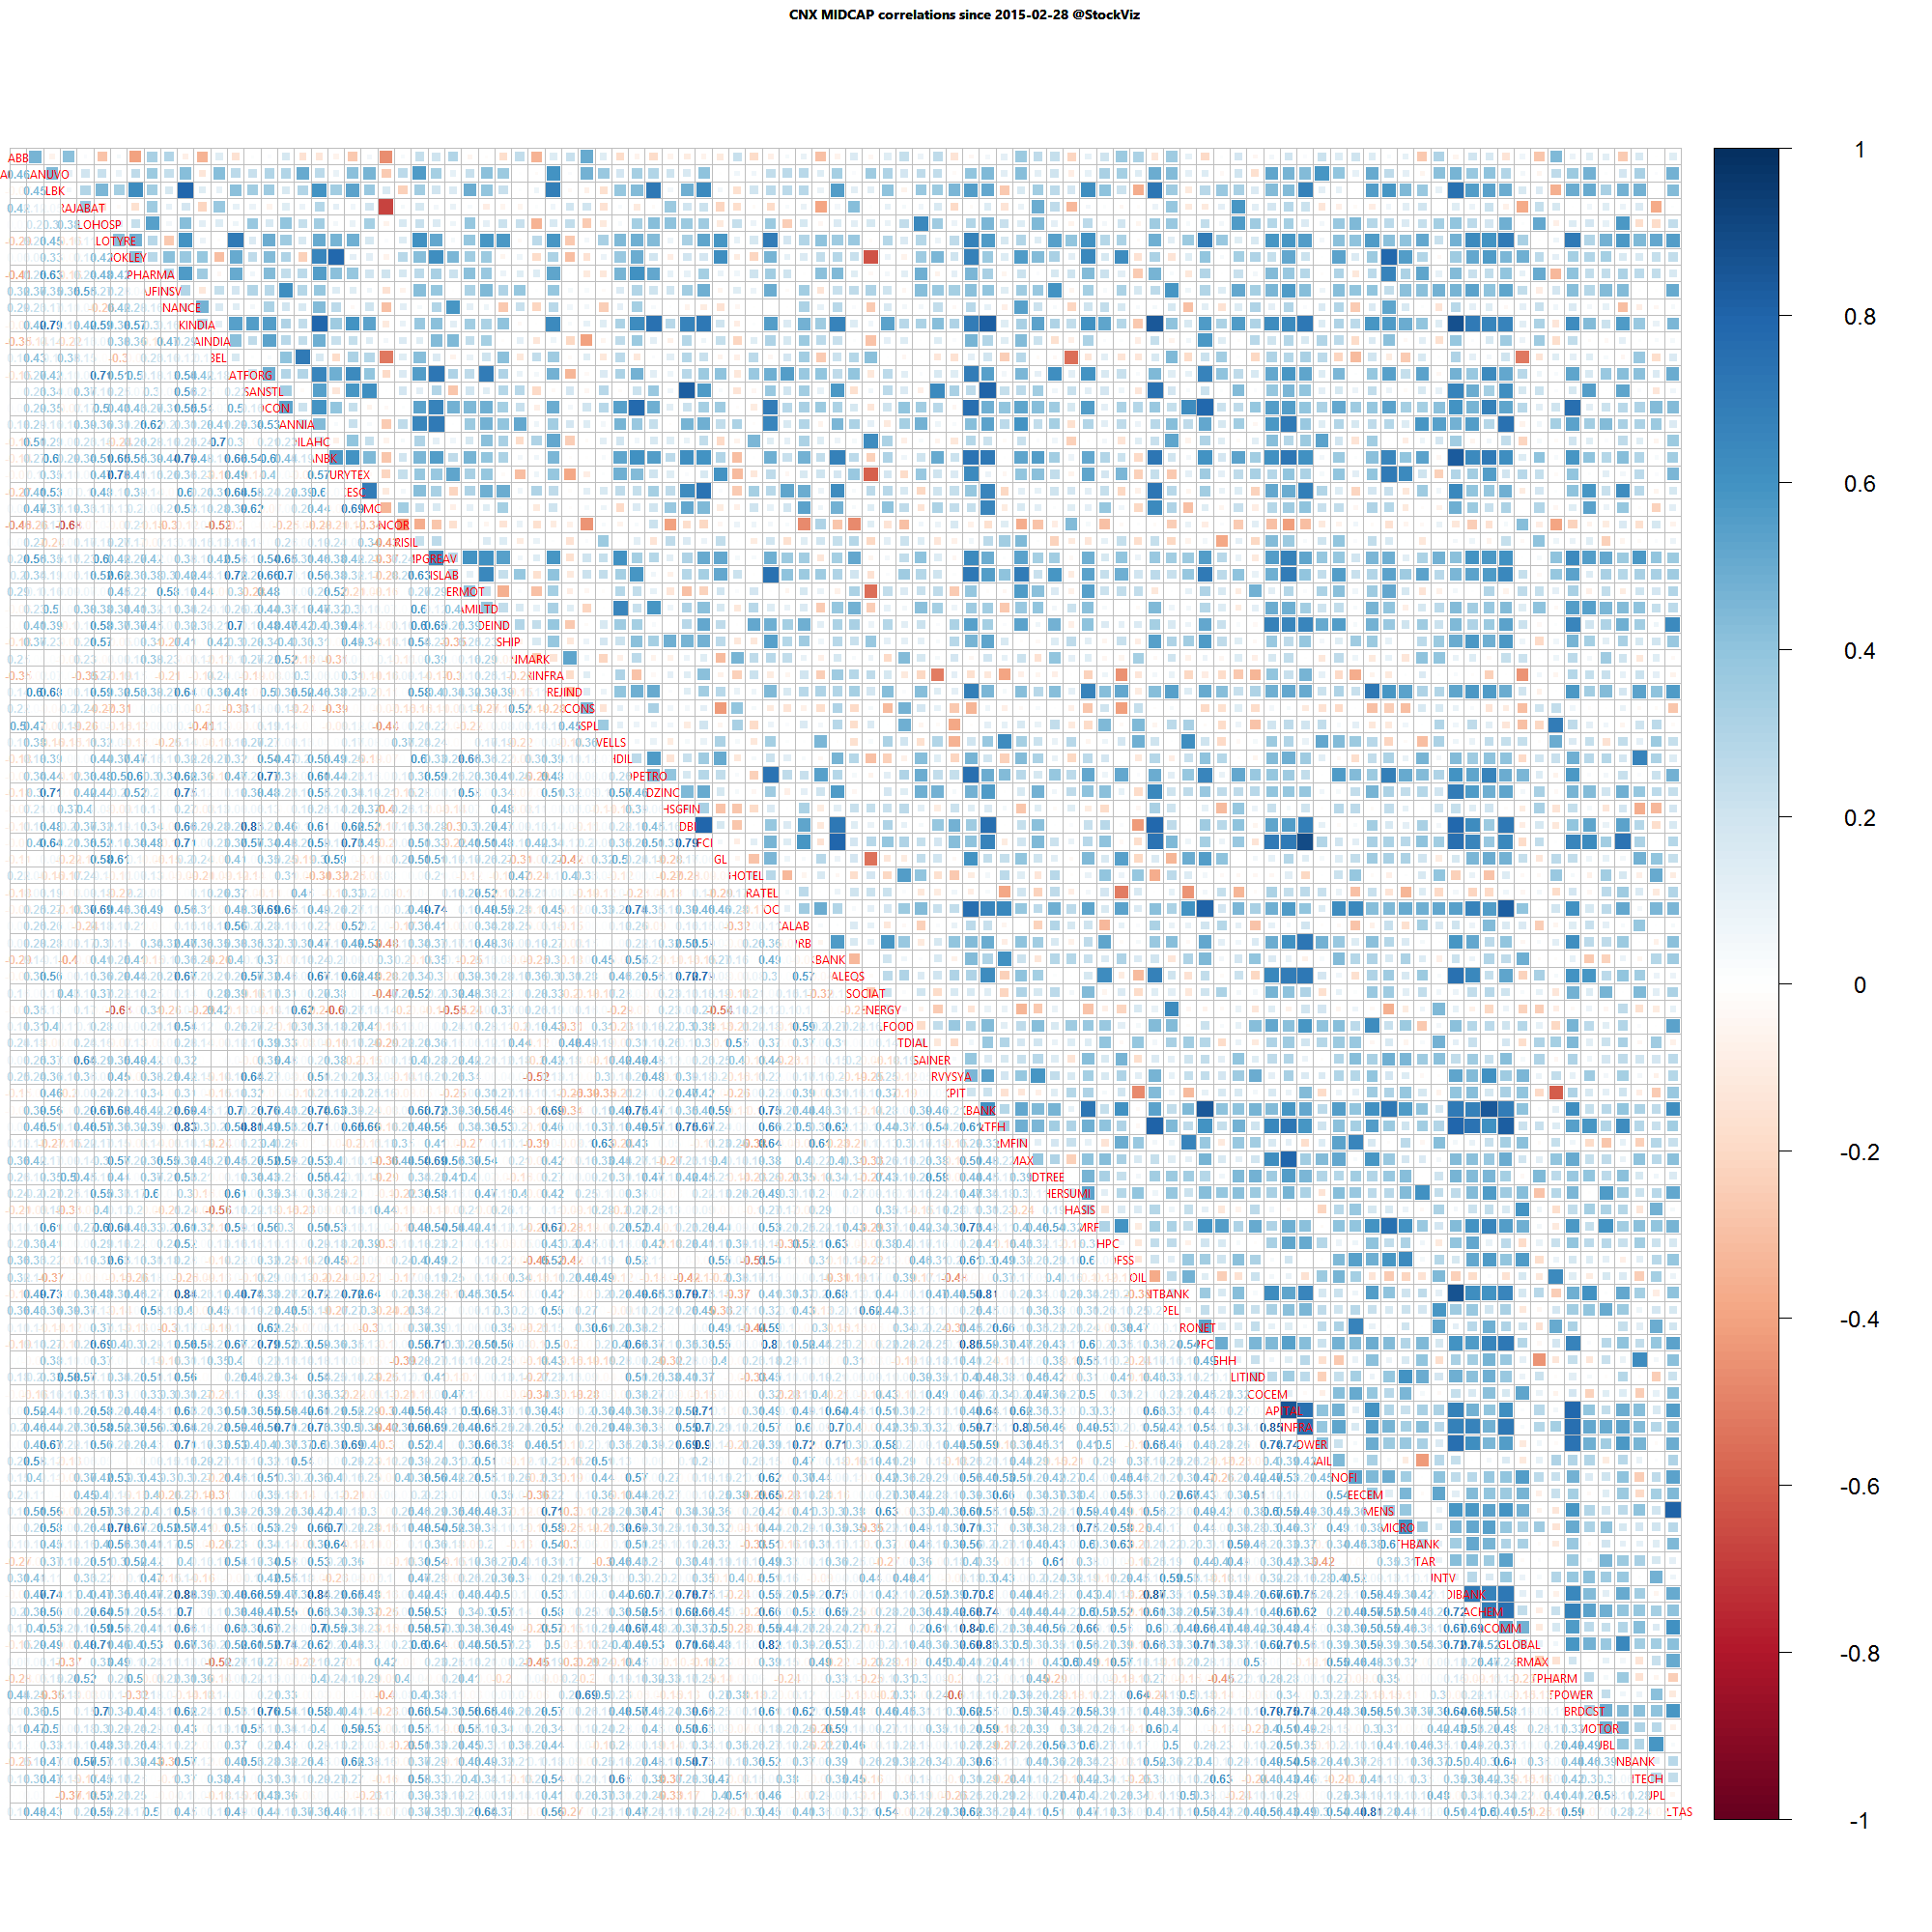
Midcap one year daily return correlations

Midcap one year daily return correlations

Midcap one month daily return correlations

Midcap one month daily return correlations

A lot of thick blue squares mean that positive correlations are high. Red squares mean negative correlations are high. Whites are the doldrums.

Leaders and Laggards

Lagged correlations

Excess winter snow-fall in the Himalayas lead to floods in Bangladesh during spring. If we know that that there was excess snow-fall in the Himalayas this season, we can be better prepared to handle the floods four-months from now. This is the idea behind studying lagged correlations.

If we took a pair of sector indices and lagged their returns, can we find an index that “leads” an other and profit from it?

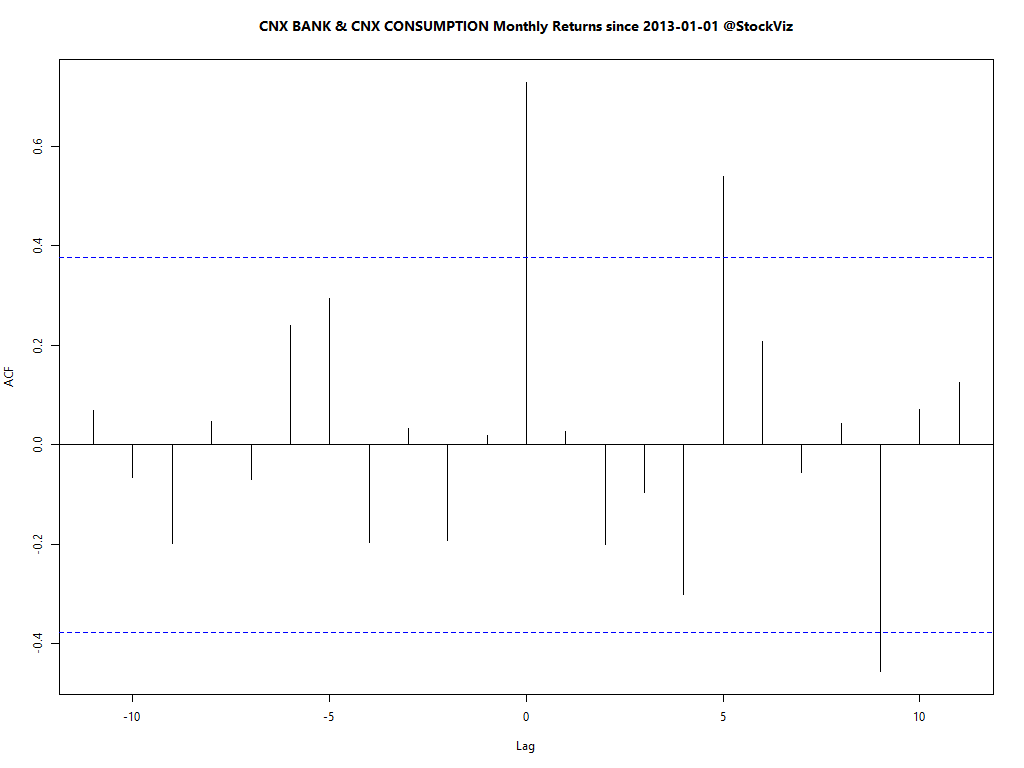
CNX BANK.CNX CONSUMPTION.monthly.lag

The chart above is called the cross-correlation plot. It shows that there are two lags, 5 and 9, where CNX BANK lags CONSUMPTION. A scatter plot shows how monthly-returns are correlated to each other across different lags and confirms the relationship:

CNX BANK.CNX CONSUMPTION.monthly.scatter

Finding

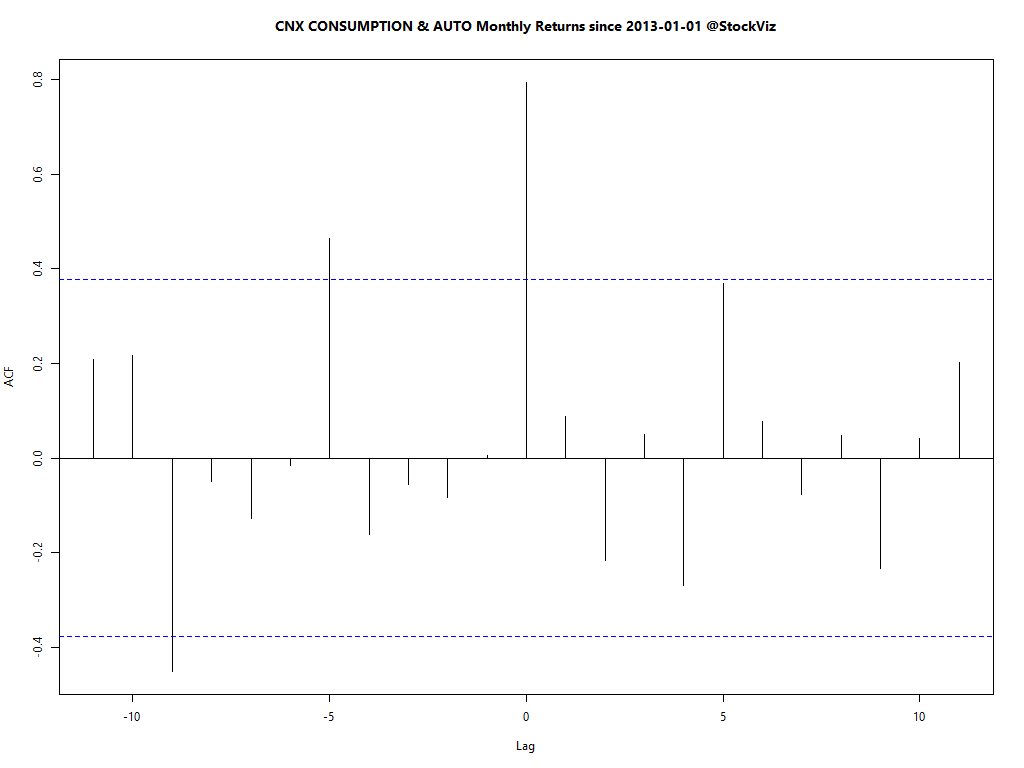
We found a number of index pairs that lead/follow one another. In addition to the CNX BANK and CNX CONSUMPTION indices above, CNX INFRA and CNX CONSUMPTION, CNX IT and CNX FINANCE, CNX CONSUMPTION and AUTO display this dynamic.

CNX INFRA.CNX CONSUMPTION.monthly.lag

CNX IT.CNX FINANCE.monthly.lag

CNX CONSUMPTION.AUTO.monthly.lag

Data mining warning

We cannot draw any conclusion from this “finding.” We mined 20 indices over 5 years to dig these nuggets out. The result is spurious. From a statistical point of view, there is no index that consistently leads or lags another.

Related: Should you care about monthly returns of the Nifty?

Weekly Recap: Luck

world.2015-03-13.2015-03-20

Equities

Major
DAX(DEU) +1.16%
CAC(FRA) +1.54%
UKX(GBR) +4.18%
NKY(JPN) +1.59%
SPX(USA) +3.09%
MINTs
JCI(IDN) +0.31%
INMEX(MEX) -0.34%
NGSEINDX(NGA) -4.51%
XU030(TUR) +8.13%
BRICS
IBOV(BRA) +7.21%
SHCOMP(CHN) +7.25%
NIFTY(IND) -0.89%
INDEXCF(RUS) +0.05%
TOP40(ZAF) +1.57%

Commodities

Energy
RBOB Gasoline +1.30%
Brent Crude Oil +0.34%
Ethanol +2.84%
Natural Gas +1.79%
Heating Oil +0.14%
WTI Crude Oil +3.02%
Metals
Copper +3.36%
Gold 100oz +2.84%
Silver 5000oz +7.74%
Platinum +1.95%
Palladium -2.08%

Currencies

USDEUR:-3.13% USDJPY:-1.03%

MINTs
USDIDR(IDN) -0.61%
USDMXN(MEX) -2.95%
USDNGN(NGA) +0.10%
USDTRY(TUR) -2.27%
BRICS
USDBRL(BRA) -0.74%
USDCNY(CHN) -0.87%
USDINR(IND) -0.79%
USDRUB(RUS) -4.89%
USDZAR(ZAF) -3.59%
Agricultural
Cocoa -2.31%
Feeder Cattle +1.07%
Lumber +3.09%
Wheat +4.38%
Soybean Meal -4.06%
White Sugar +1.27%
Cattle +2.99%
Corn +2.53%
Orange Juice +0.61%
Coffee (Arabica) +10.90%
Coffee (Robusta) +8.70%
Cotton +3.23%
Lean Hogs -5.21%
Soybeans -0.15%
Sugar #11 -0.55%

Credit Indices

Index Change
Markit CDX EM +0.29%
Markit CDX NA HY +0.29%
Markit CDX NA IG -1.59%
Markit iTraxx Asia ex-Japan IG -0.24%
Markit iTraxx Australia +0.39%
Markit iTraxx Europe +2.11%
Markit iTraxx Europe Crossover +12.07%
Markit iTraxx Japan -2.77%
Markit iTraxx SovX Western Europe +1.53%
Markit LCDX (Loan CDS) -0.04%
Markit MCDX (Municipal CDS) -1.14%
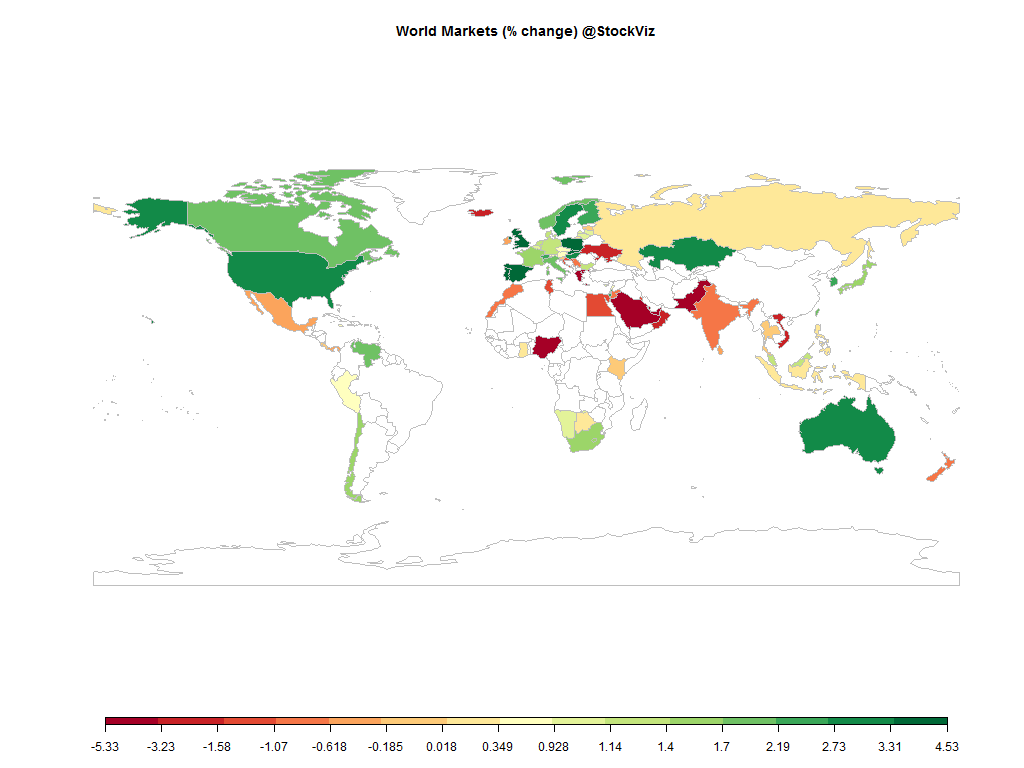
The US Dollar got beat up on Fed’s re-assurance to the markets that it is in no hurry to raise rates. Precious metals rallied and oil caught a break. Most equity markets ended in the green except for India.

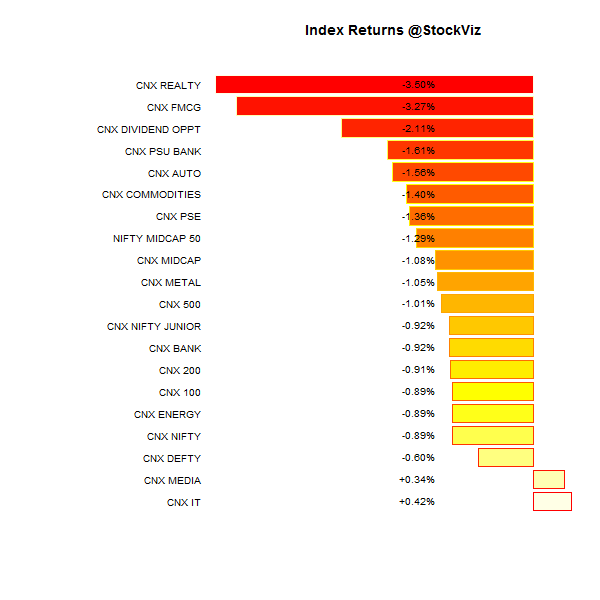
Index Returns

index performance.2015-03-13.2015-03-20

Market Cap Decile Performance

Decile Mkt. Cap. Adv/Decl
1 (micro) -5.00% 56/77
2 -4.91% 59/74
3 -4.09% 56/77
4 -2.81% 58/74
5 -4.43% 62/71
6 -3.76% 60/73
7 -3.01% 59/73
8 -1.63% 60/73
9 -0.96% 70/63
10 (mega) -1.39% 67/66
Mid- and small-cap stocks took it on the chin this week on the sudden realization that the (earnings) emperor has no clothes.

Top Winners and Losers

M&MFIN +3.04%
YESBANK +3.57%
GSKCONS +3.61%
JINDALSTEL -11.67%
RCOM -9.93%
BAJAJFINSV -8.07%
Is RCOM equity headed towards its intrinsic value of zero?

ETF Performance

JUNIORBEES -0.31%
GOLDBEES -0.44%
NIFTYBEES -0.57%
CPSEETF -0.66%
BANKBEES -0.83%
PSUBNKBEES -1.33%
INFRABEES -3.27%
No ETF in the green zone this week. In spite of the volatility, BANKBEES kept its losses less than a point.

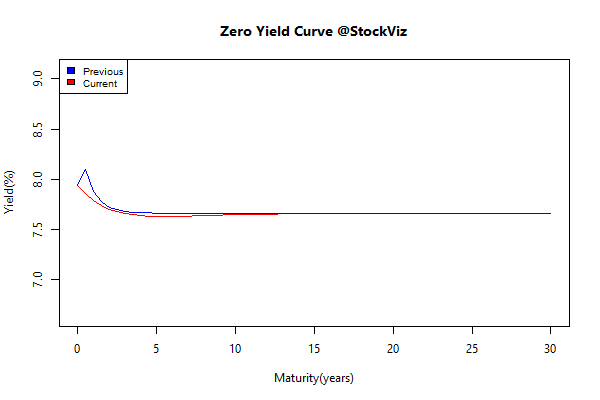
Yield Curve

yield Curve.2015-03-13.2015-03-20

Bond Indices

Sub Index Change in YTM Total Return(%)
GSEC TB -0.14 +0.19%
GSEC SUB 1-3 -0.09 +0.47%
GSEC SUB 3-8 -0.19 +1.12%
GSEC SUB 8 -0.13 +1.32%
The long-end recovered a bid from last week’s tumble…

Investment Theme Performance

Equity Mutual Funds

Bond Mutual Funds

Thought to sum up the week

“Lucky” people are adept at creating and noticing chance opportunities (such as meeting an important businessman at a café), listen to their intuition, have positive expectations that create self-fulfilling prophesies, and have a relaxed and resilient attitude about life’s trials. Poor unlucky souls are more tense and anxious than lucky ones.

Source: How luck works

Index Update 21.03.2015

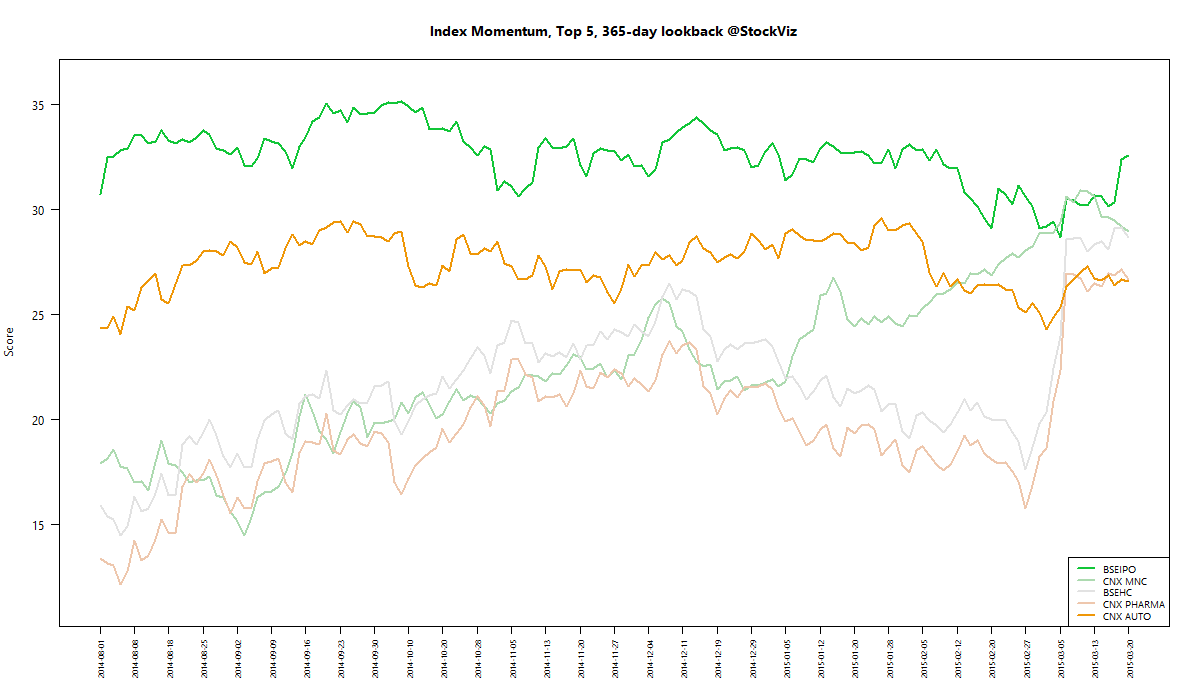
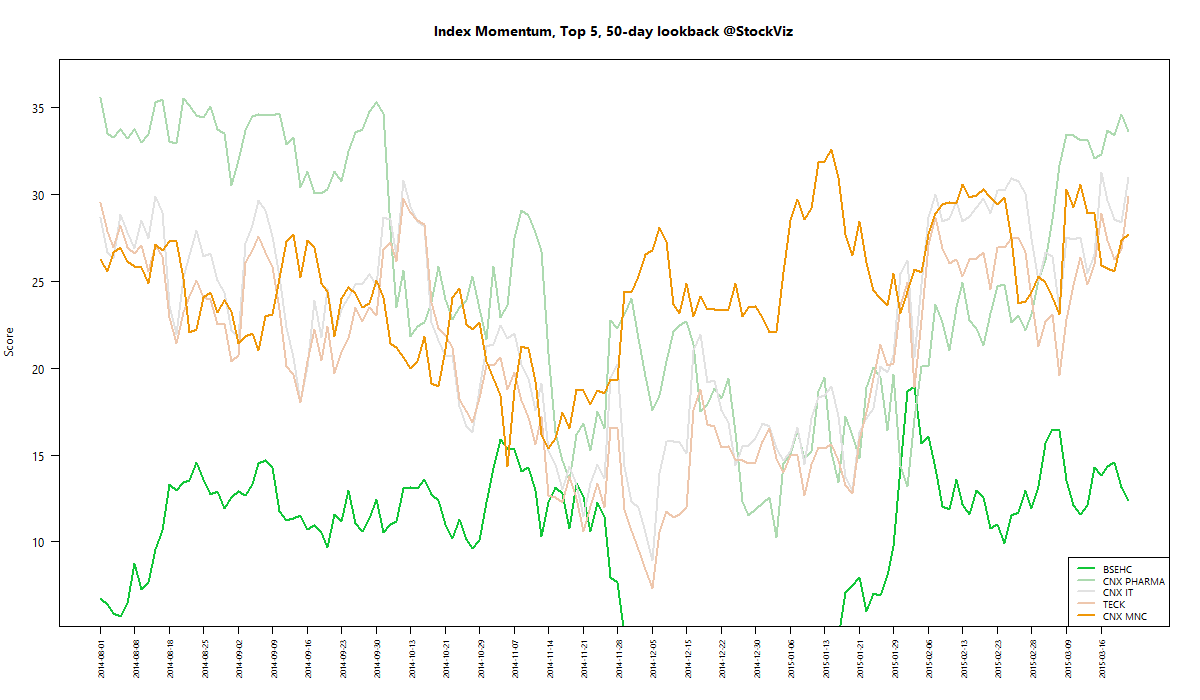
MOMENTUM

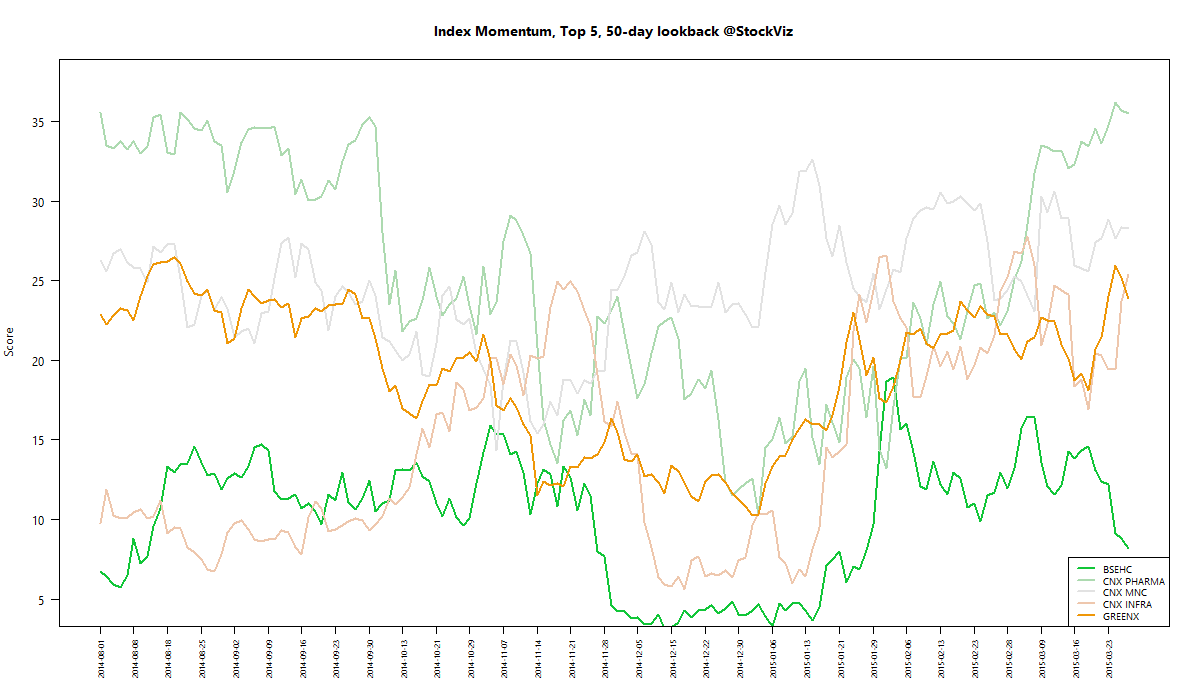
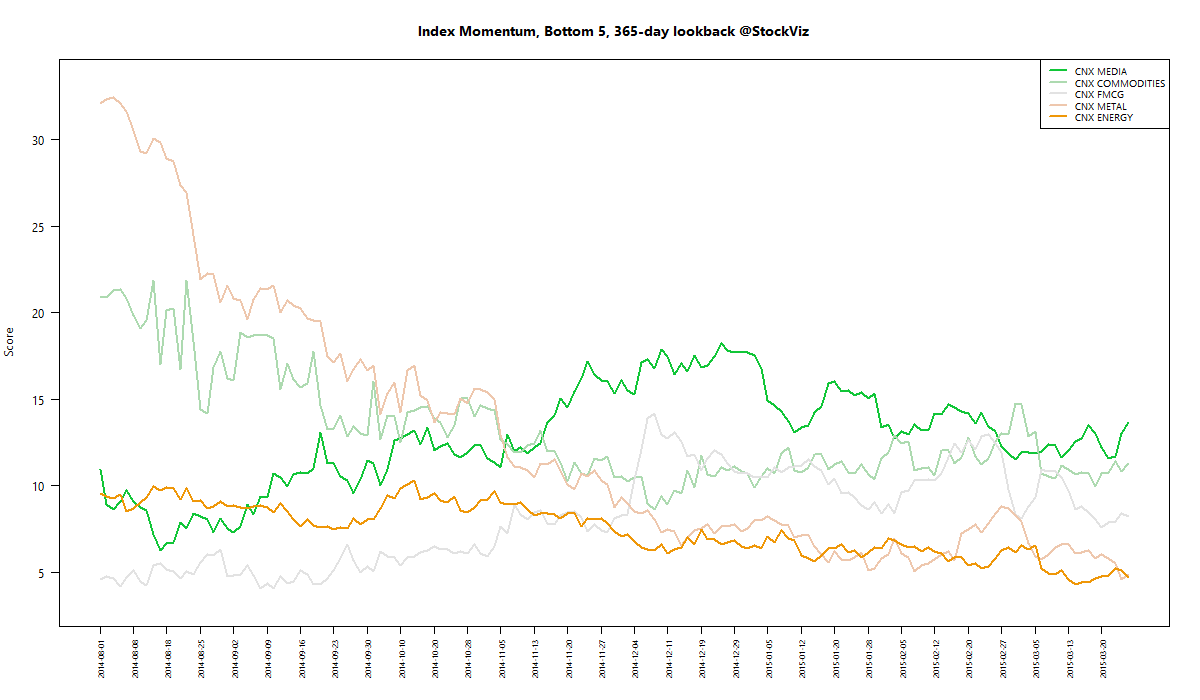
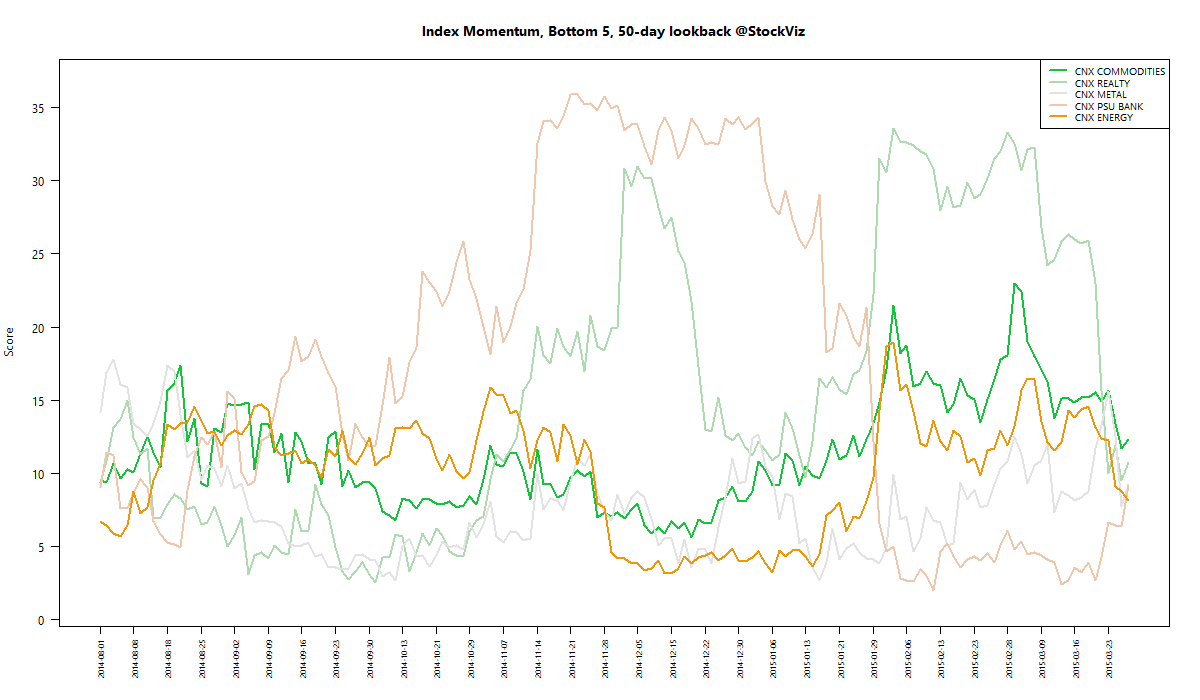
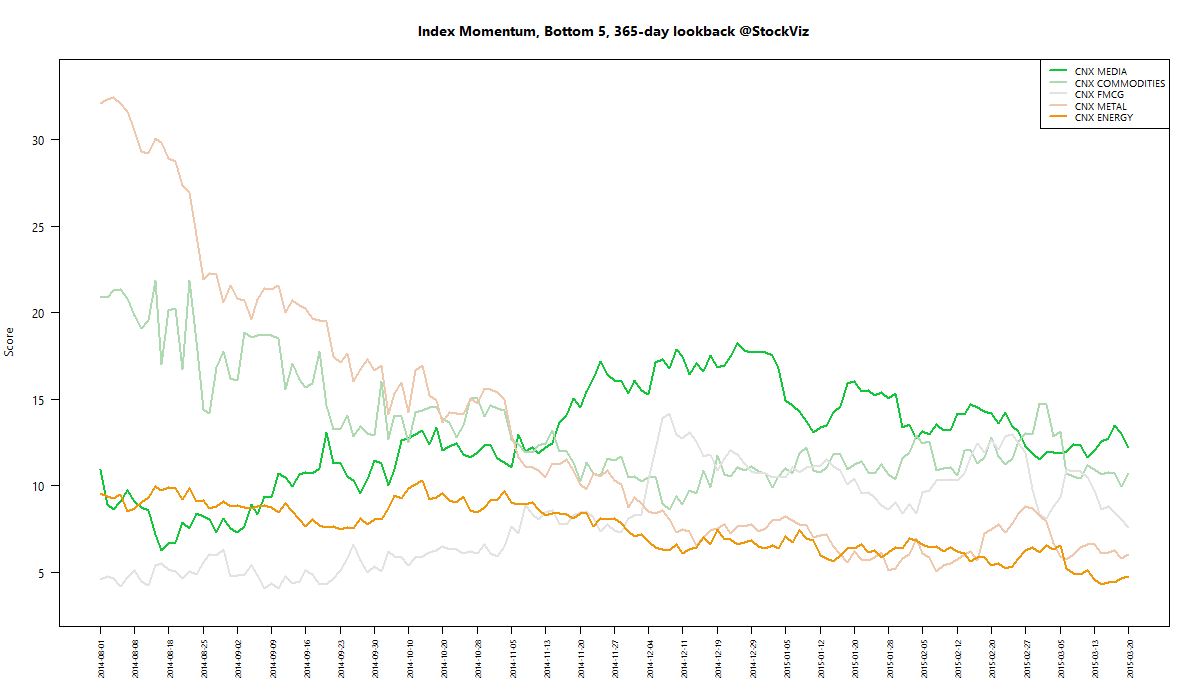
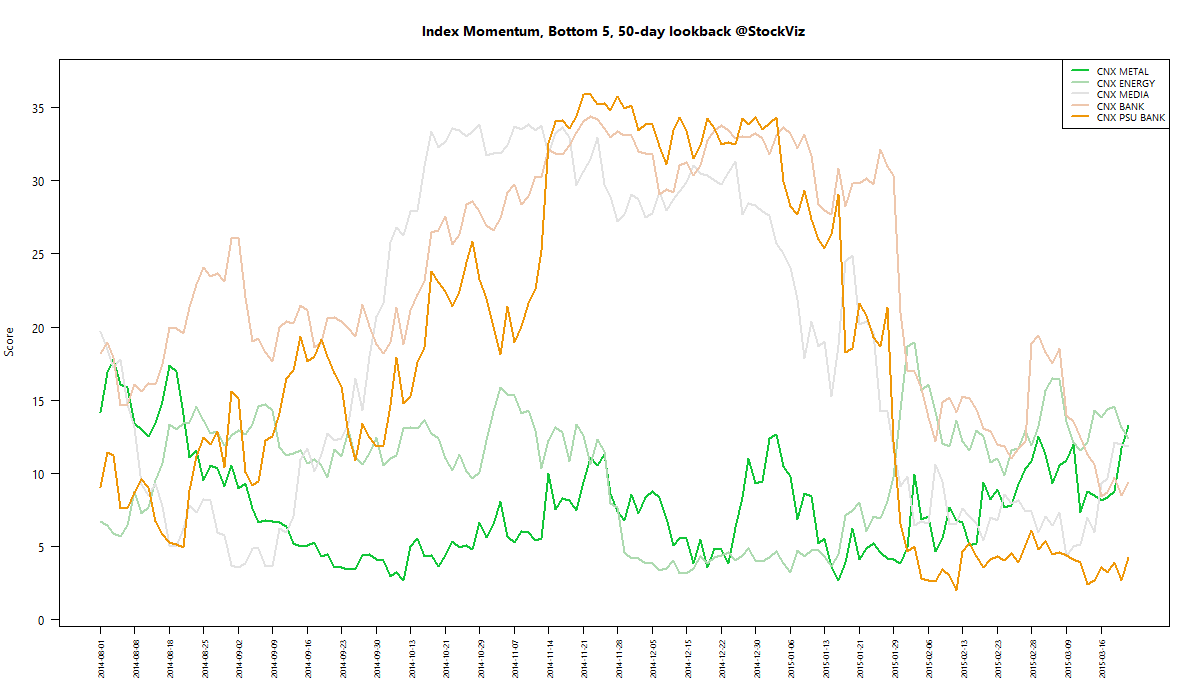
We run our proprietary momentum scoring algorithm on indices just like we do on stocks. You can use the momentum scores of sub-indices to get a sense for which sectors have the wind on their backs and those that are facing headwinds.

Traders can pick their longs in sectors with high short-term momentum and their shorts in sectors with low momentum. Investors can use the longer lookback scores to position themselves using our re-factored index Themes.

You can see how the momentum algorithm has performed on individual stocks here.

Here are the best and the worst sub-indices:
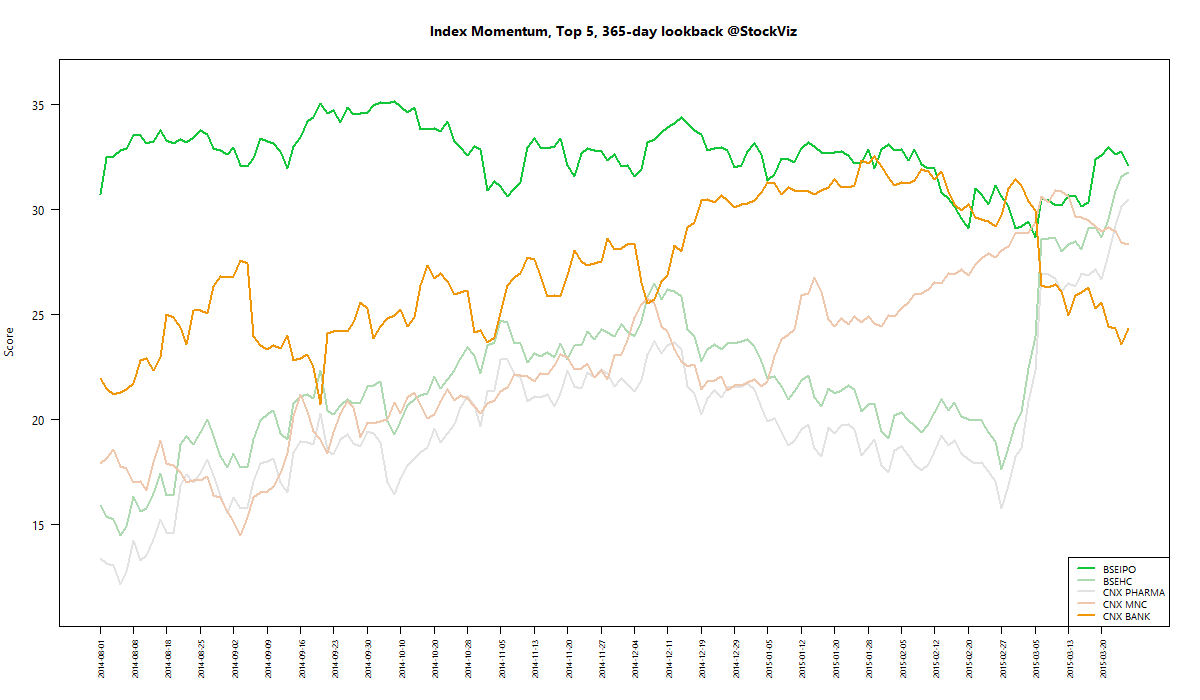
index momentum best 365 2015-03-20 png

index momentum best 50 2015-03-20 png

index momentum worst 365 2015-03-20 png

index momentum worst 50 2015-03-20 png

Refactored Index Performance

50-day performance, from January 08, 2015 through March 20, 2015:

Correlation Update 21.03.2015

Nifty one year daily return correlations

Nifty one year daily return correlations

Nifty one month daily return correlations

Nifty one month daily return correlations

Bank Nifty one year daily return correlations

Bank Nifty one year daily return correlations

Bank Nifty one month daily return correlations

Bank Nifty one month daily return correlations

Midcap one year daily return correlations

Midcap one year daily return correlations

Midcap one month daily return correlations

Midcap one month daily return correlations

A lot of thick blue squares mean that positive correlations are high. Red squares mean negative correlations are high. Whites are the doldrums.