Category: Your Money

Correlation Update 01.08.2015

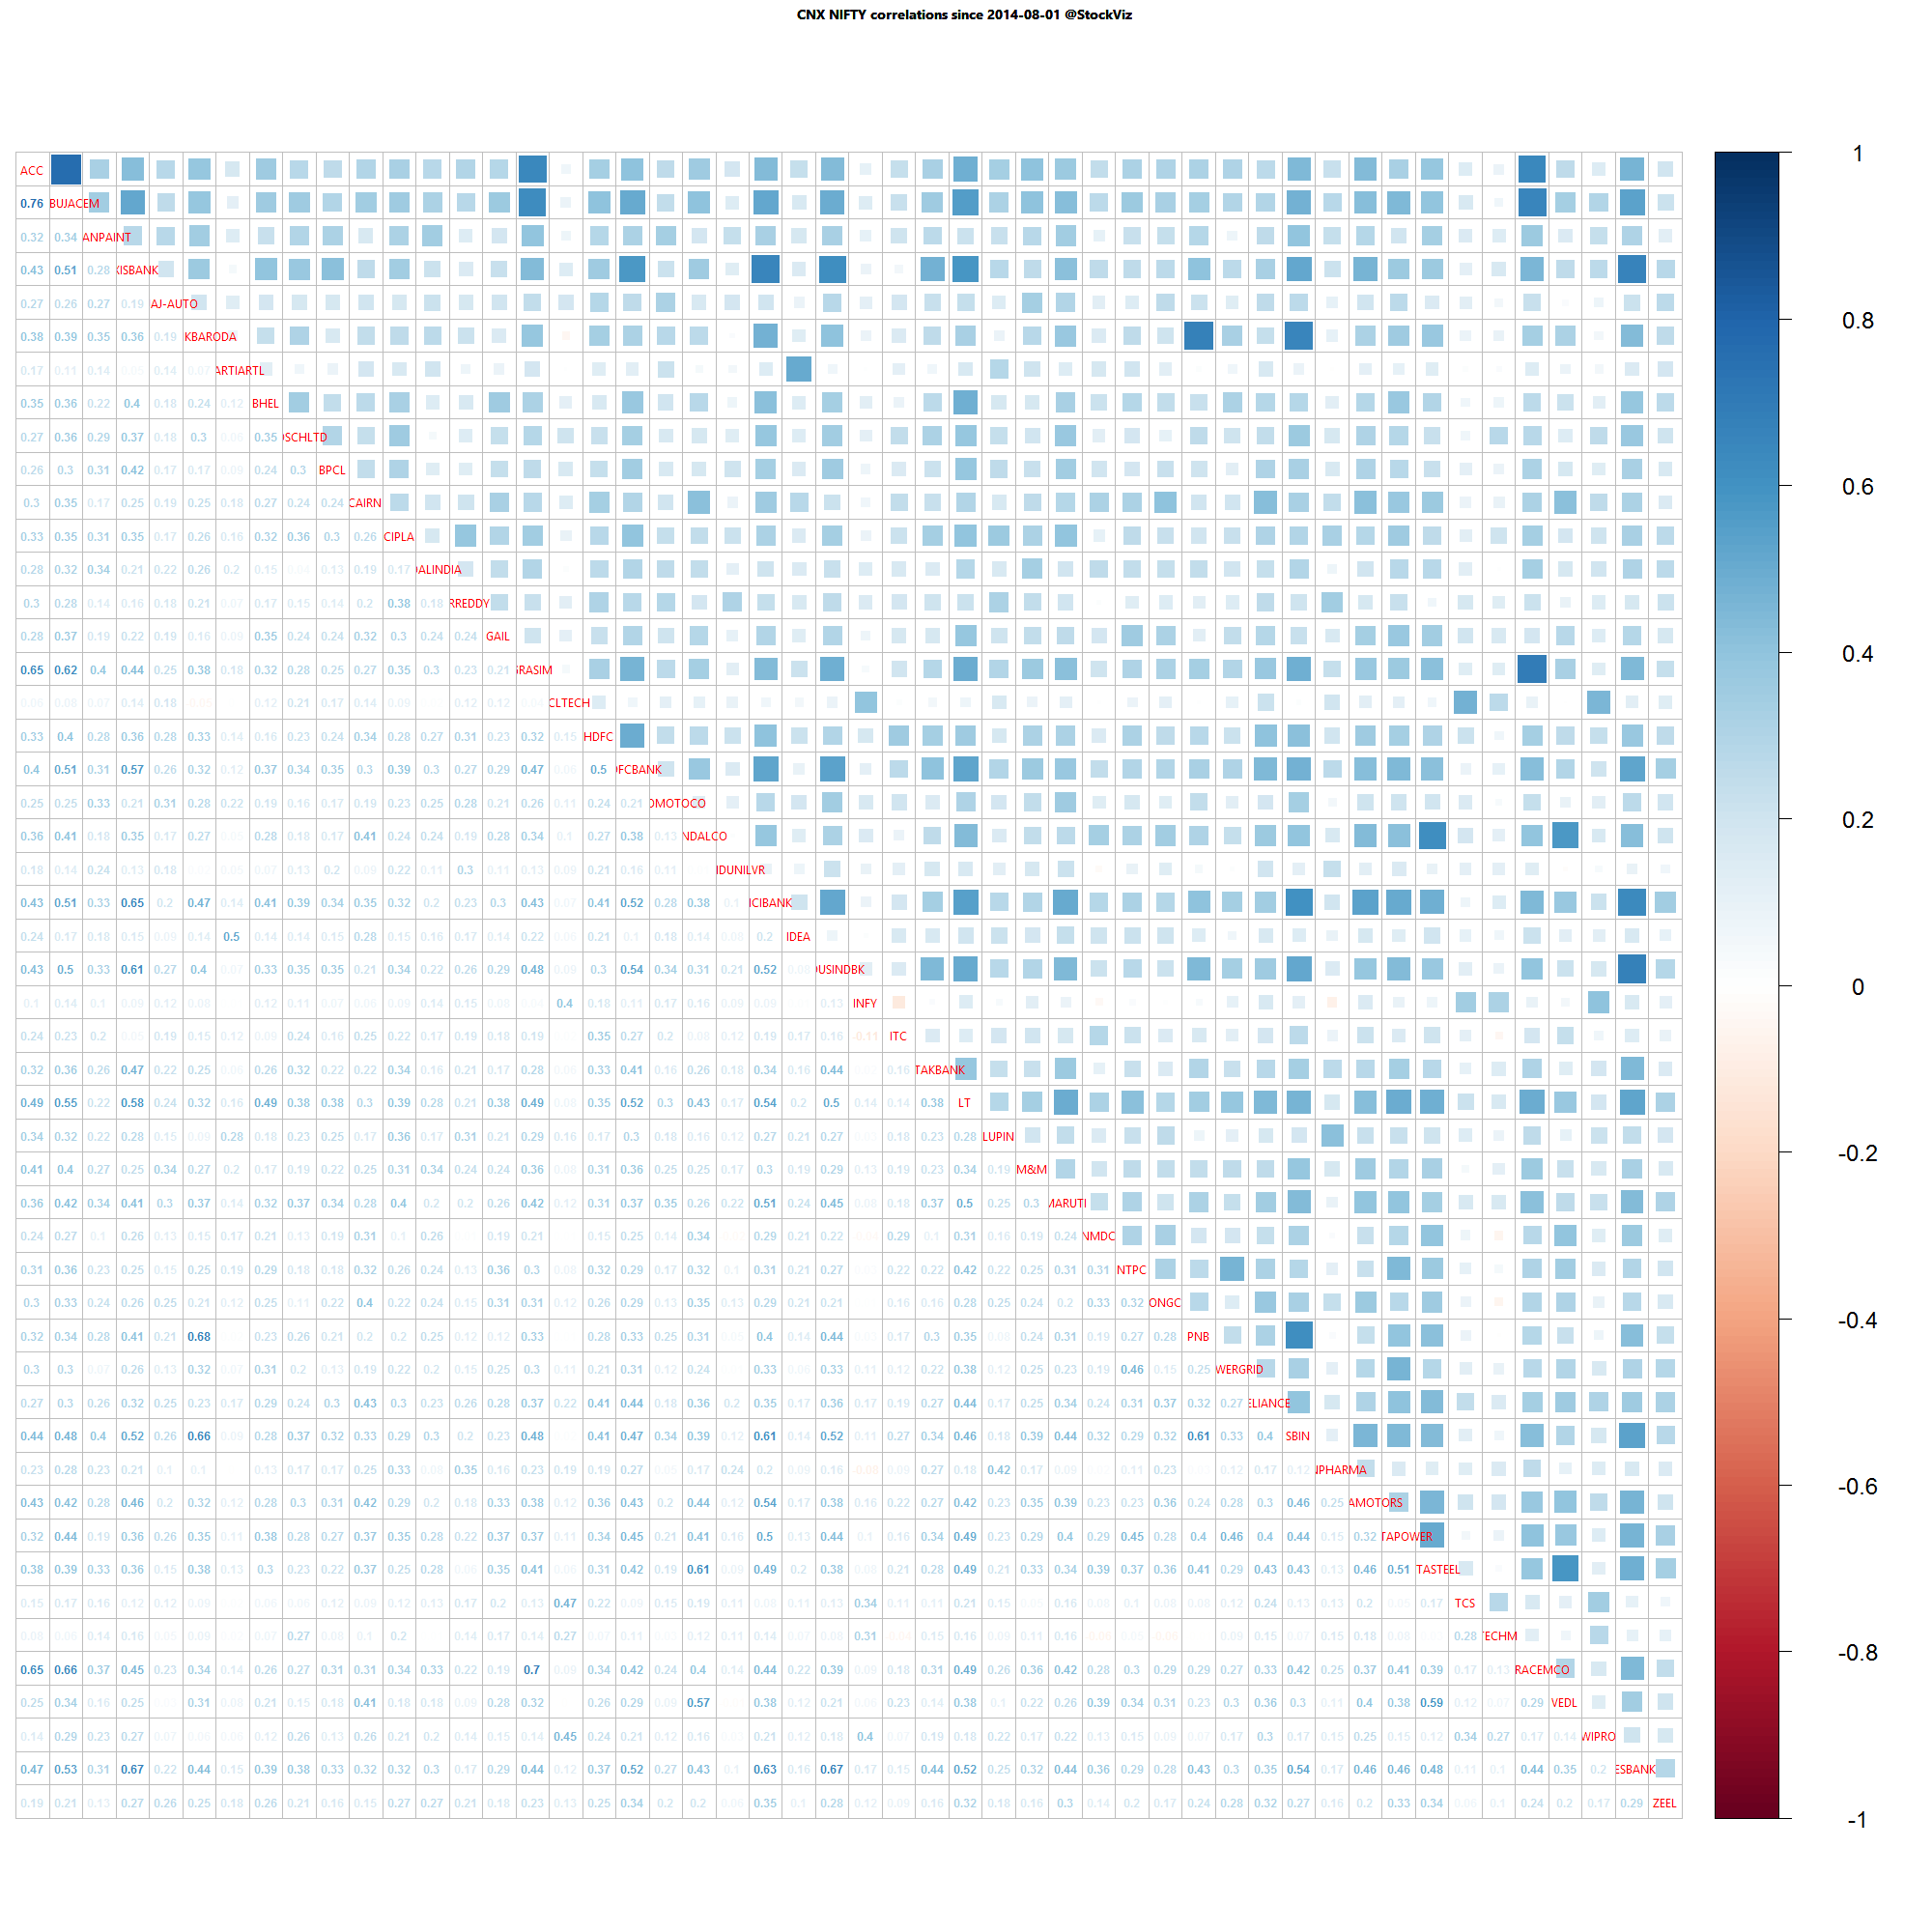
Nifty one year daily return correlations

Nifty one year daily return correlations

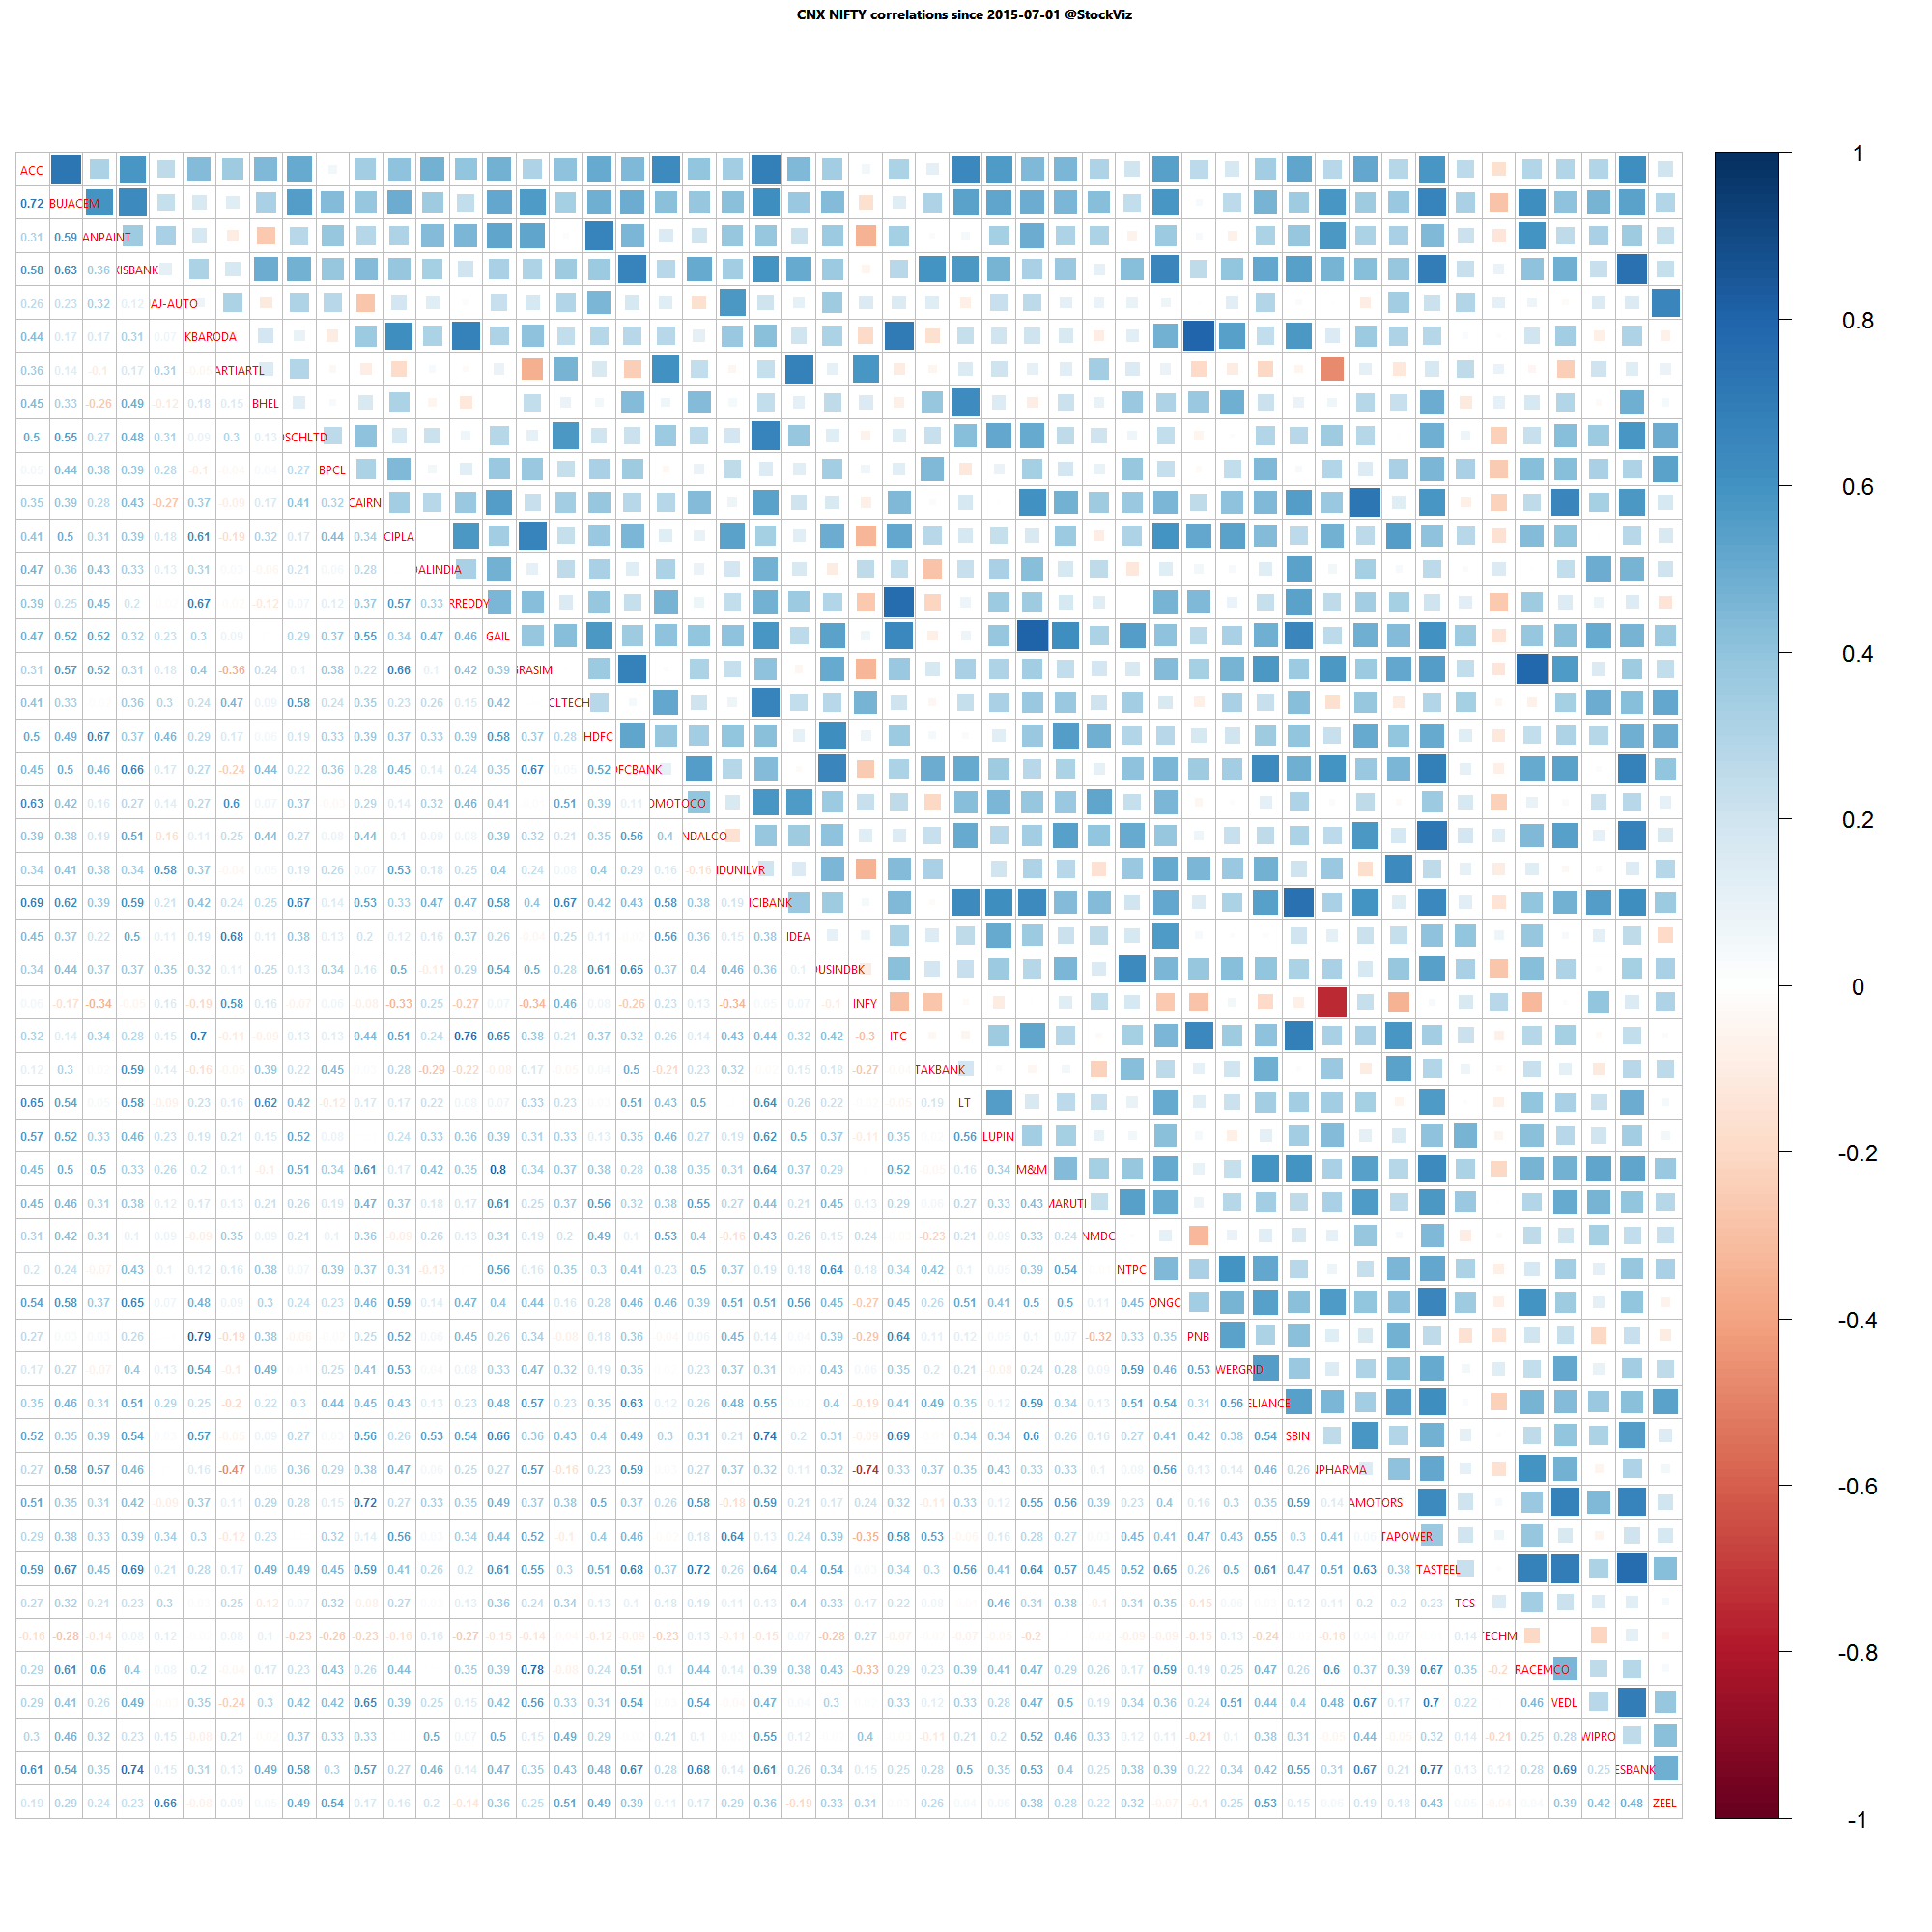
Nifty one month daily return correlations

Nifty one month daily return correlations

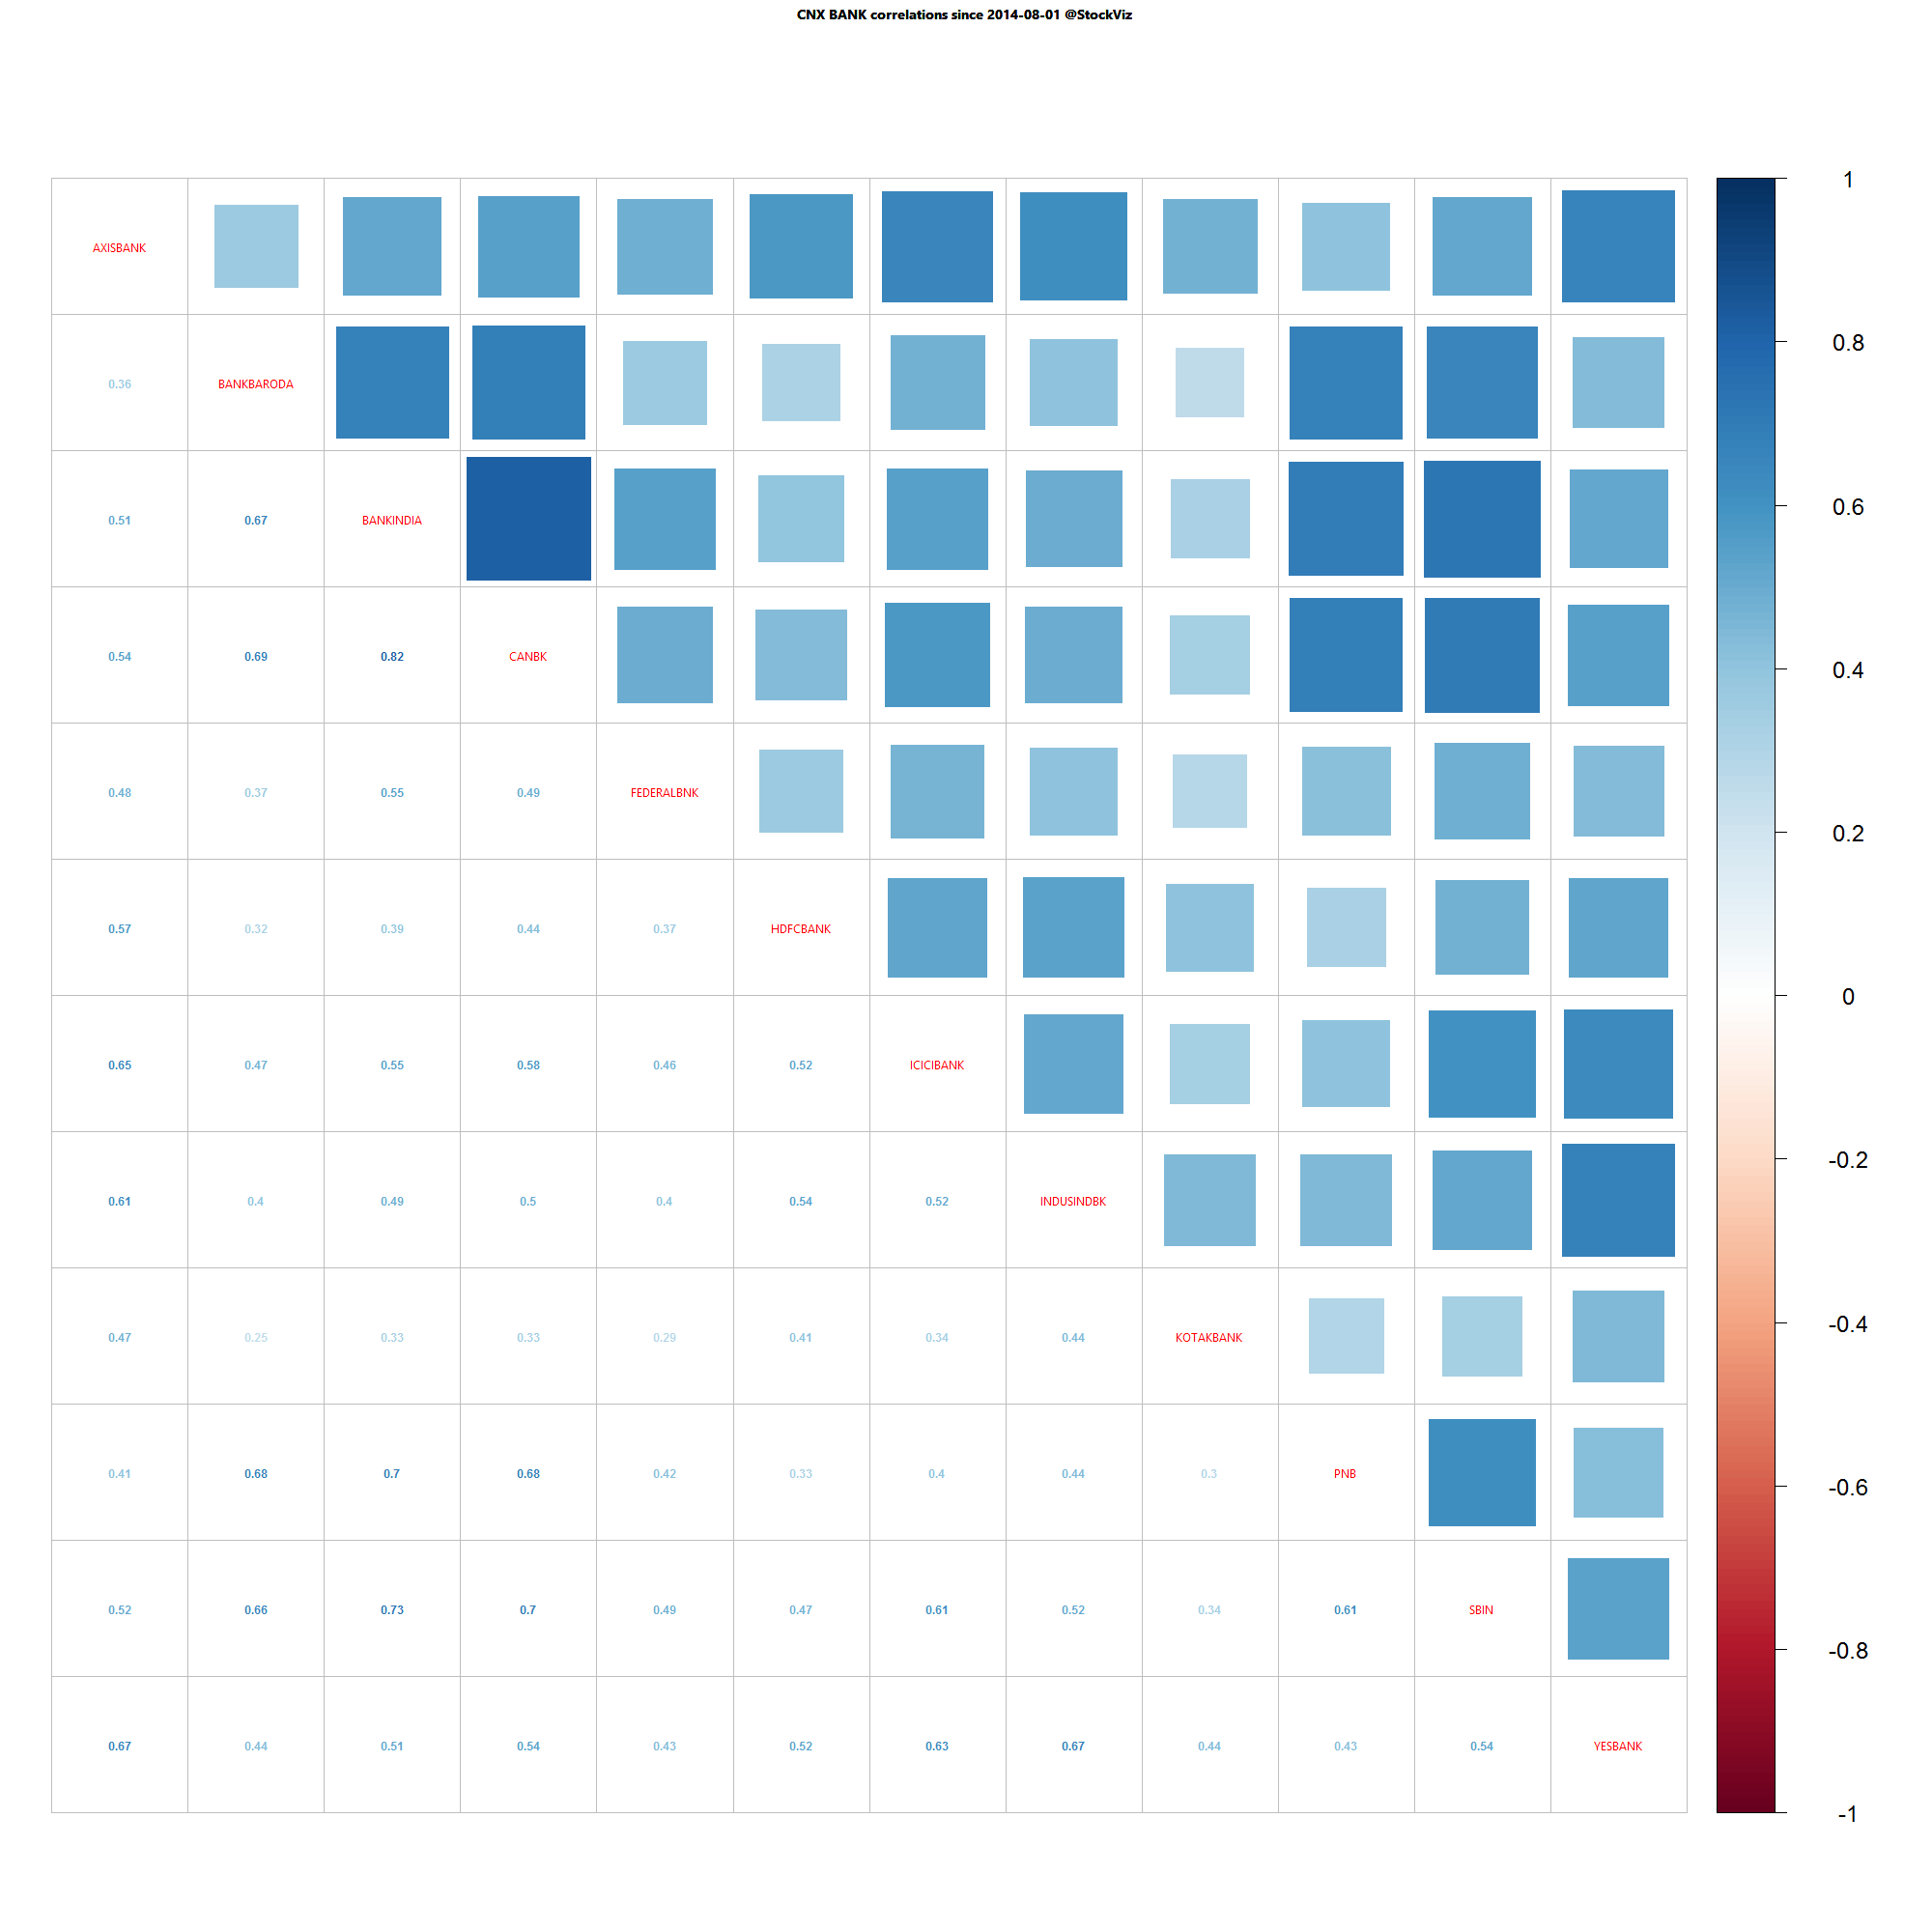
Bank Nifty one year daily return correlations

Bank Nifty one year daily return correlations

Bank Nifty one month daily return correlations

Bank Nifty one month daily return correlations

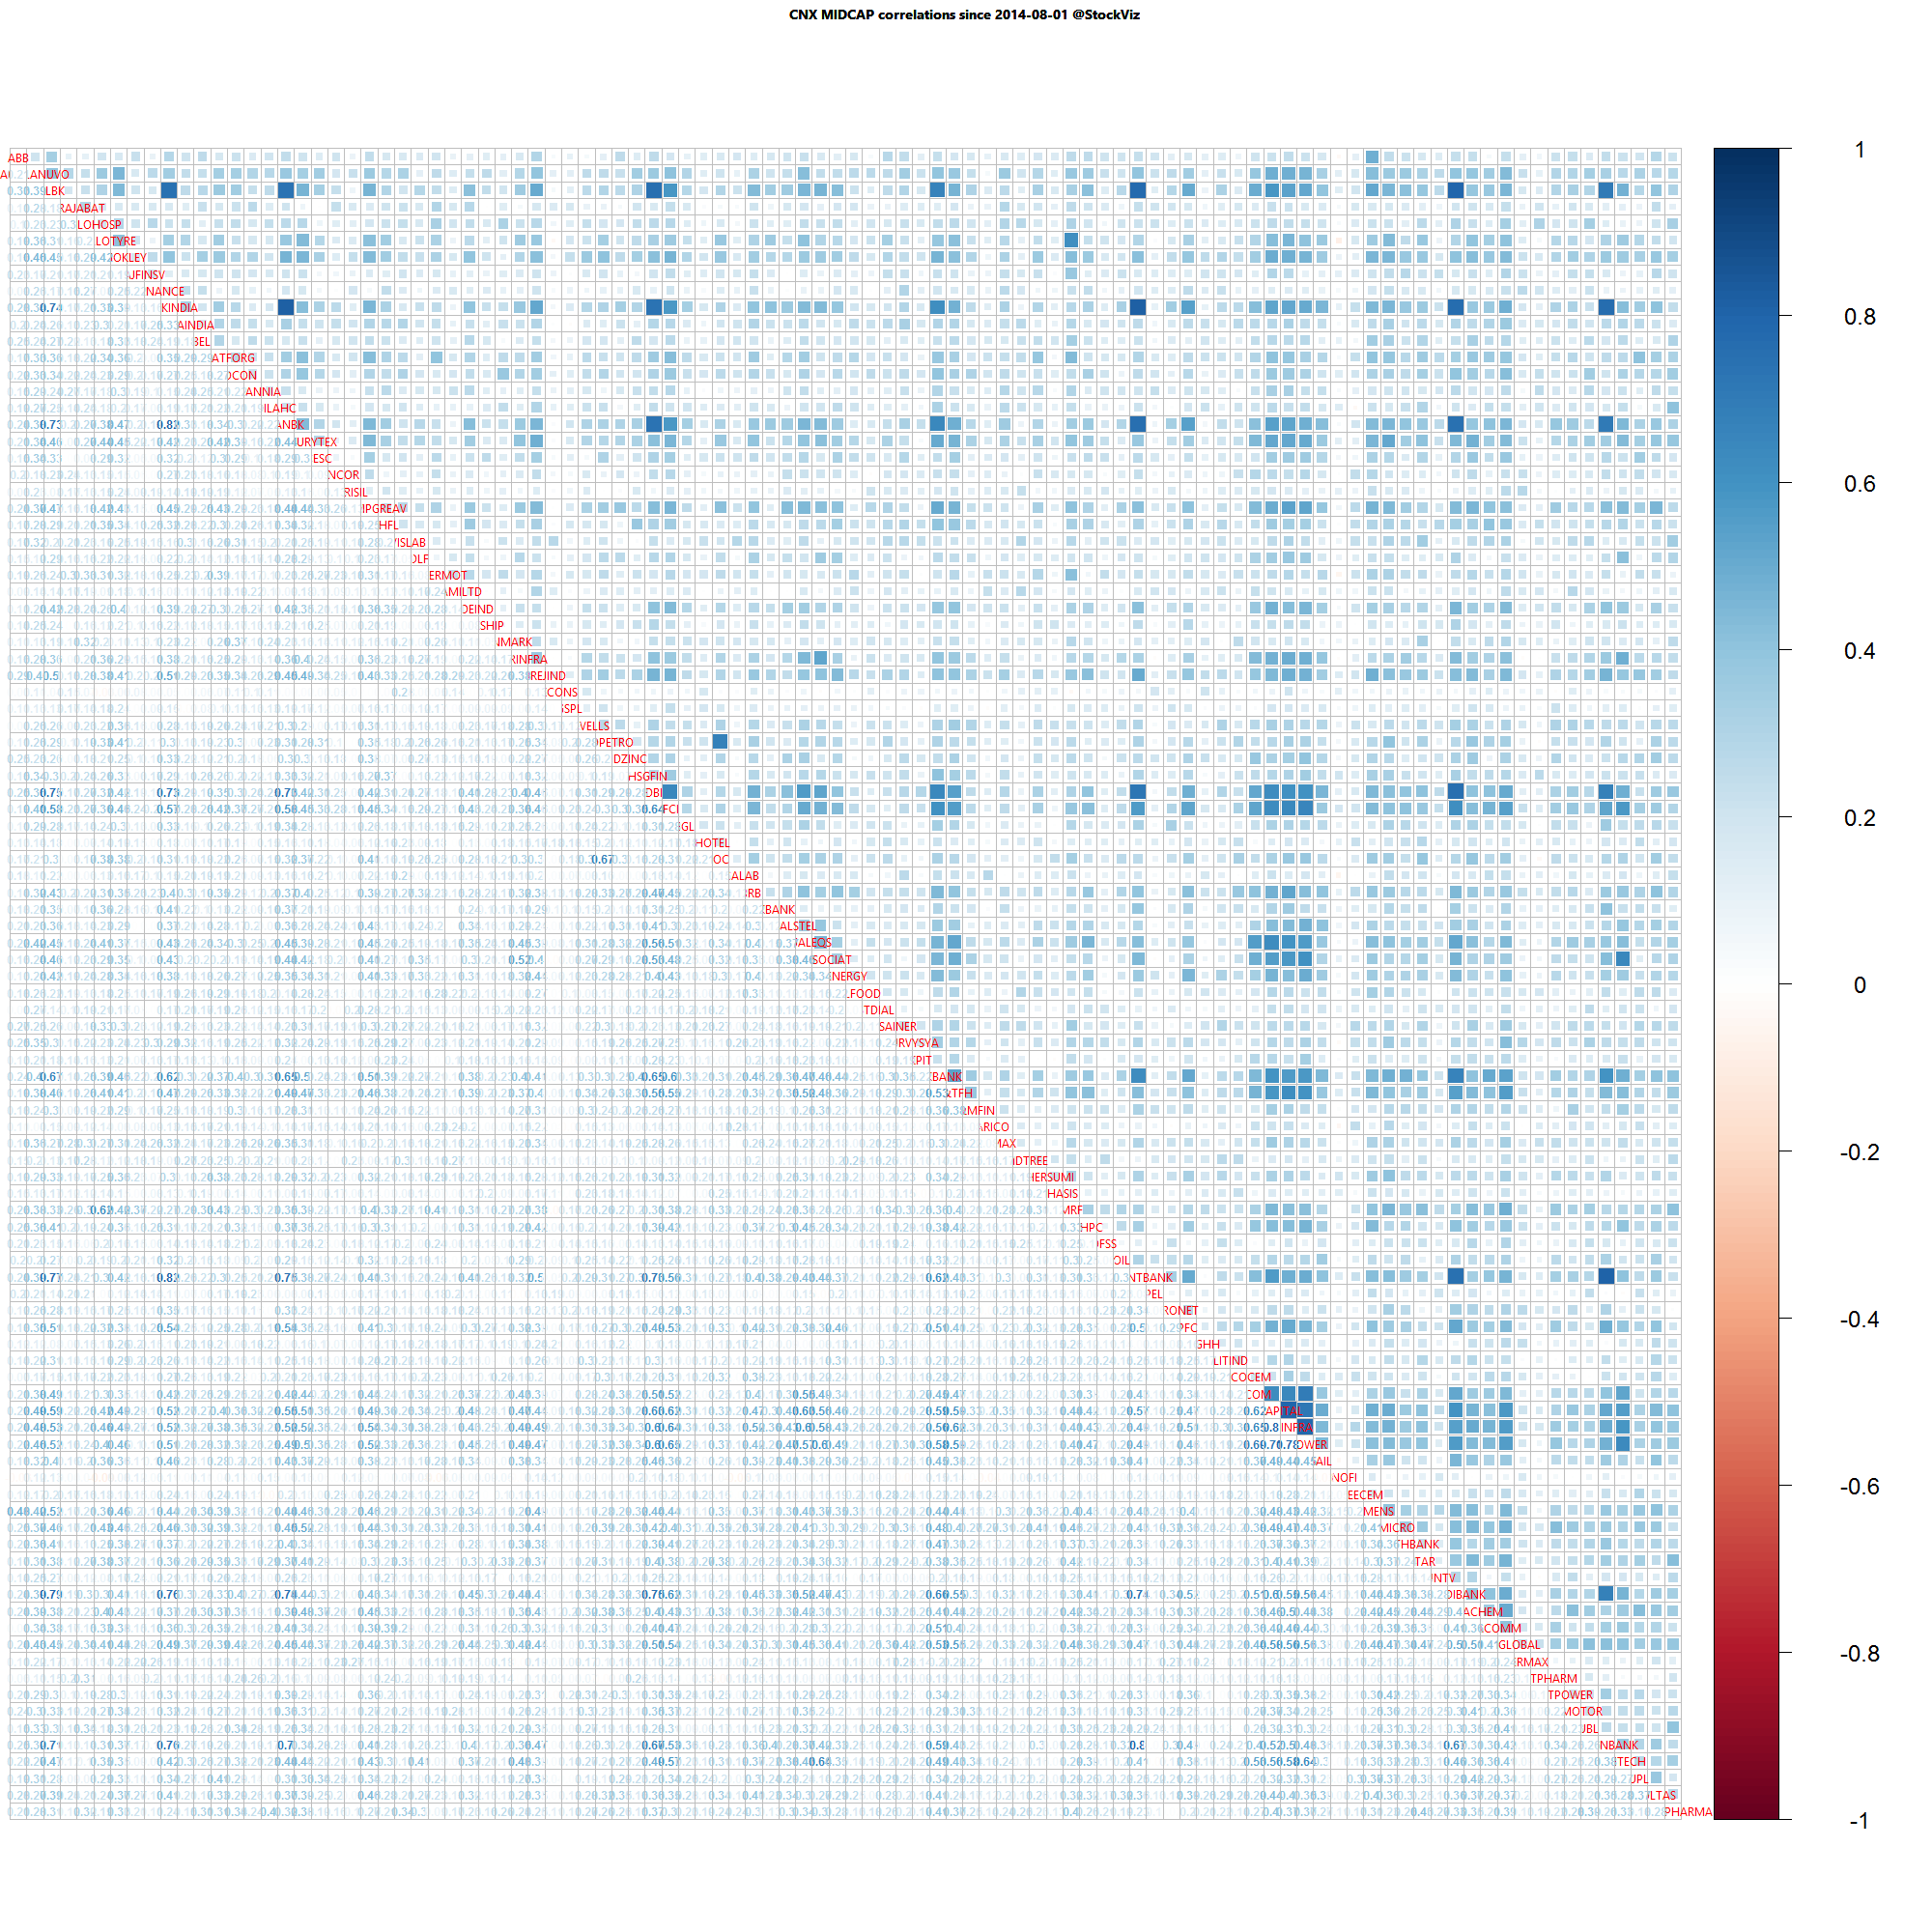
Midcap one year daily return correlations

Midcap one year daily return correlations

Midcap one month daily return correlations

Midcap one month daily return correlations

A lot of thick blue squares mean that positive correlations are high. Red squares mean negative correlations are high. Whites are the doldrums.

Profiting from PE Ratio Obsession

Background

We are not big fans of using the Price-to-Earnings ratio. We saw how funds that use the market PE to time the market are no better than a buy-and-hold strategy (sometimes B&H performs better,) and we followed that up with how every single “ratio” has a caveat. And PE is the dumbest of them all.

However, if a large group of market participants pay attention to single flawed metric, then there should be a profitable arbitrage strategy that exploits that anomaly?

Exploiting PE obsession

Researchers in the US figured out a way to do just that.

Active investors with limited attention and capital constraints use fundamental metrics to screen and sort potential investments. Price-earnings (P/E) ratios are extremely popular, and are typically calculated using four trailing quarters of net income. Changes in the rankings of published P/E ratios may influence investor attention and subsequent excess returns. From 1974-2013, decile long-short portfolios formed on characteristics of P/E rankings which are rebalanced monthly earn value-weighted monthly excess returns of 101 basis points with annual Sharpe ratios of 0.79. Decile long-short portfolios which are rebalanced daily earn value-weighted daily excess returns of 16.99 basis points with annual Sharpe ratios of 2.91. Excess returns are robust to size, value, profitability, investment, price momentum, earnings momentum, short-term reversals, and relative volume. Changes to a stock’s P/E ranking predicts excess returns even when the stock’s P/E ratio itself does not change. The return premium cannot be explained by fundamental risk, clustering of attention at round number P/E ratios, or autocorrelation in the regressors.

We haven’t tested this for the Indian market yet. But this is just too cool not to share!

Paper: Rankings of published price-earnings ratios and investor attention

Weekly Recap: Roller Coaster Investing

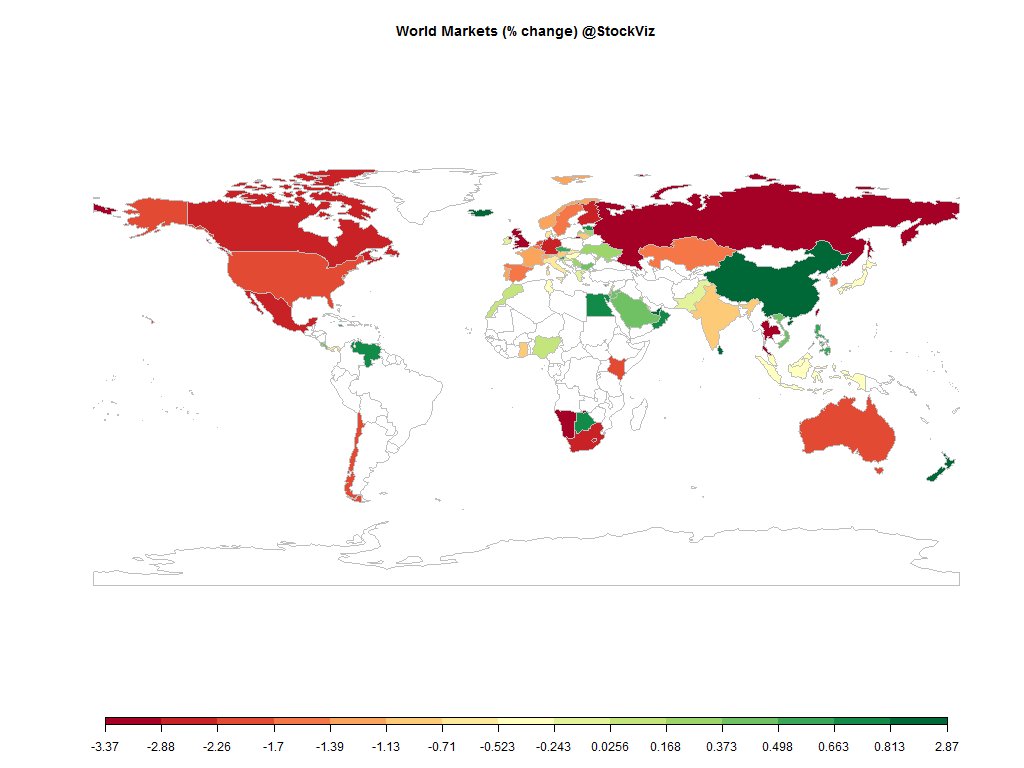
world.2015-07-17.2015-07-24

Equities

Major
DAX(DEU) -2.79%
CAC(FRA) -1.31%
UKX(GBR) -2.88%
NKY(JPN) -0.52%
SPX(USA) -2.03%
MINTs
JCI(IDN) -0.27%
INMEX(MEX) -2.26%
NGSEINDX(NGA) +0.14%
XU030(TUR) -4.70%
BRICS
IBOV(BRA) -6.06%
SHCOMP(CHN) +2.87%
NIFTY(IND) -1.03%
INDEXCF(RUS) -3.30%
TOP40(ZAF) -2.54%

Commodities

Energy
Ethanol -4.06%
RBOB Gasoline -4.46%
Brent Crude Oil -4.02%
Heating Oil -1.74%
WTI Crude Oil -5.35%
Natural Gas -2.77%
Metals
Gold 100oz -3.05%
Palladium +1.49%
Platinum -1.18%
Silver 5000oz -1.35%
Copper -4.80%

Currencies

USDEUR:-1.16% USDJPY:-0.19%

MINTs
USDIDR(IDN) +0.70%
USDMXN(MEX) +2.26%
USDNGN(NGA) -0.03%
USDTRY(TUR) +3.28%
BRICS
USDBRL(BRA) +4.95%
USDCNY(CHN) +0.00%
USDINR(IND) +0.90%
USDRUB(RUS) +2.83%
USDZAR(ZAF) +2.53%
Agricultural
Coffee (Arabica) -4.47%
Coffee (Robusta) -0.56%
Corn -6.67%
Cotton +0.03%
Wheat -7.62%
White Sugar -3.08%
Orange Juice +2.83%
Feeder Cattle -2.46%
Cattle -2.62%
Cocoa -3.88%
Lean Hogs +2.41%
Lumber -4.10%
Soybean Meal -1.83%
Soybeans -2.34%
Sugar #11 -5.94%

Credit Indices

Index Change
Markit CDX EM -0.39%
Markit CDX NA HY -0.72%
Markit CDX NA IG +3.51%
Markit iTraxx Asia ex-Japan IG -0.56%
Markit iTraxx Australia -2.39%
Markit iTraxx Europe -0.14%
Markit iTraxx Europe Crossover +7.87%
Markit iTraxx Japan -1.57%
Markit iTraxx SovX Western Europe +1.59%
Markit LCDX (Loan CDS) +0.00%
Markit MCDX (Municipal CDS) +0.01%
An uneasy week that saw most indices weak. The entire commodity complex came crashing down. Gold, copper, silver, oil, grains… pretty much every commodity was down.

Nifty Heatmap

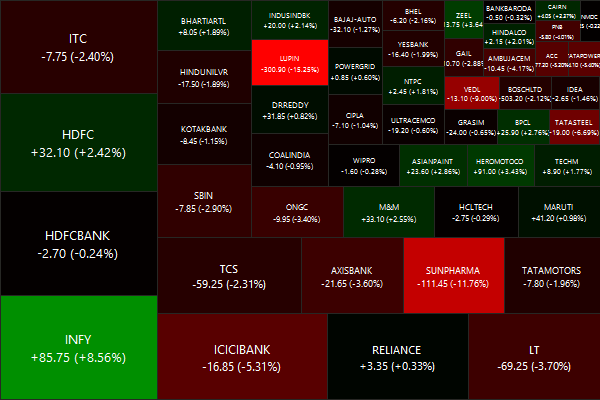
CNX NIFTY.2015-07-17.2015-07-24

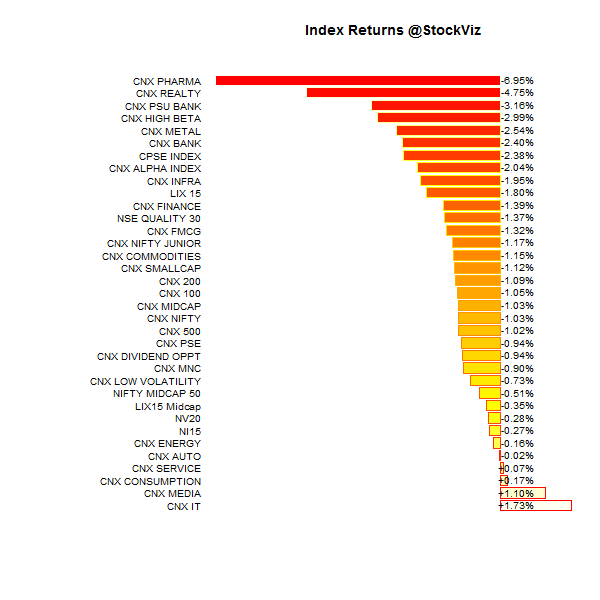
Index Returns

For a deeper dive into indices, check out our weekly Index Update.
index.performance.2015-07-17.2015-07-24

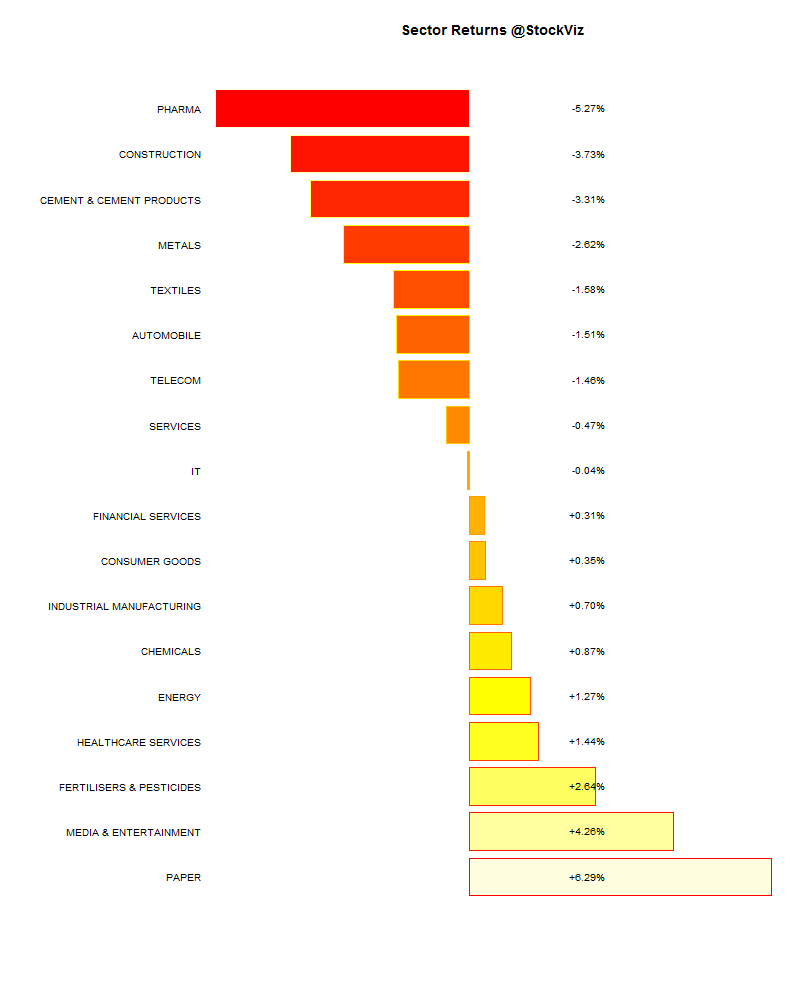
Sector Performance

sector performance.2015-07-17.2015-07-24

Market Cap Decile Performance

Decile Mkt. Cap. Adv/Decl
1 (micro) -1.58% 73/62
2 +0.74% 69/66
3 +8.28% 69/66
4 -0.03% 71/63
5 +1.95% 70/66
6 +0.73% 65/70
7 +0.40% 72/63
8 +1.34% 70/65
9 -0.35% 63/72
10 (mega) +0.01% 70/65
Looks like there was an outlier that bumped up a microcap stock…

Top Winners and Losers

INFY +8.56%
ABIRLANUVO +8.56%
IBULHSGFIN +8.86%
LUPIN -15.25%
SUNPHARMA -11.76%
CONCOR -11.74%
Sunpharma’s warning, Lupin’s disappointment and Infy’s optimism…

ETF Performance

INFRABEES +1.50%
JUNIORBEES -0.66%
NIFTYBEES -1.12%
CPSEETF -2.56%
PSUBNKBEES -2.76%
BANKBEES -2.94%
GOLDBEES -3.13%
Gold got shellacked…

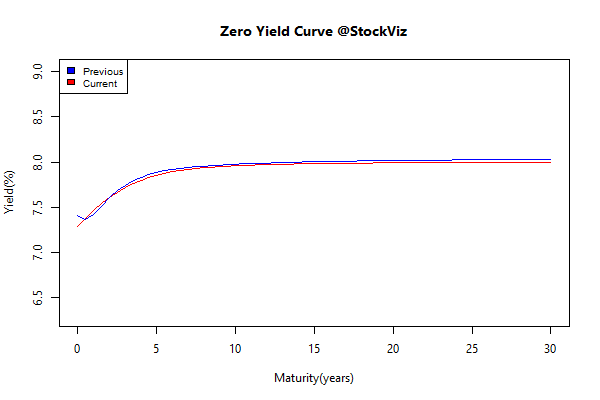
Yield Curve

yield Curve.2015-07-17.2015-07-24

Bond Indices

Sub Index Change in YTM Total Return(%)
0 5 +0.02 +0.12%
5 10 -0.04 +0.35%
10 15 -0.01 +0.22%
15 20 -0.02 +0.34%
20 30 -0.02 +0.36%
The long end of the curve was in the green after a long time…

Investment Theme Performance

A mixed bag. Momentum ended flat as Kitex got whacked…

Equity Mutual Funds

Bond Mutual Funds

Thought for the weekend

Big money is in buying and holding great businesses acquired at reasonable valuations. Owning such businesses will produce gut-wrenching roller coaster rides which the investor has to have the willingness to take. They can’t avoid those rides by jumping out and trying to get back in, and attempts to do so are likely to be unsuccessful. So, the best strategy is to stay put and bear it.

Source: Sanjay Bakshi

Index Update 25.07.2015

MOMENTUM

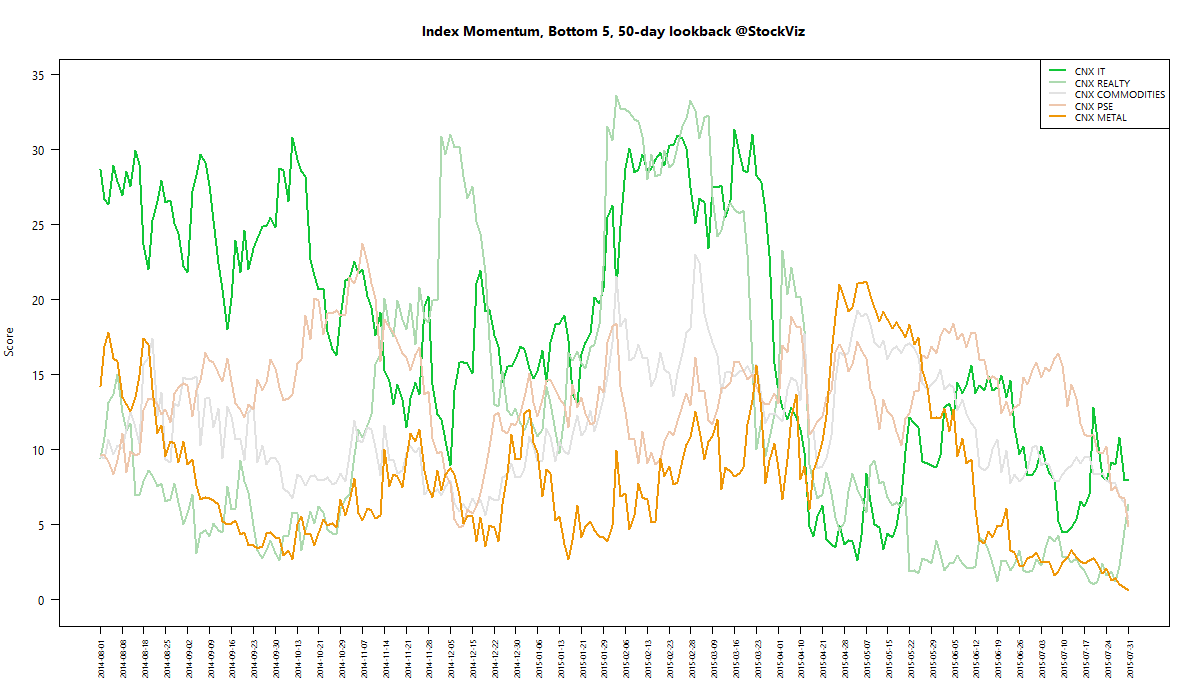
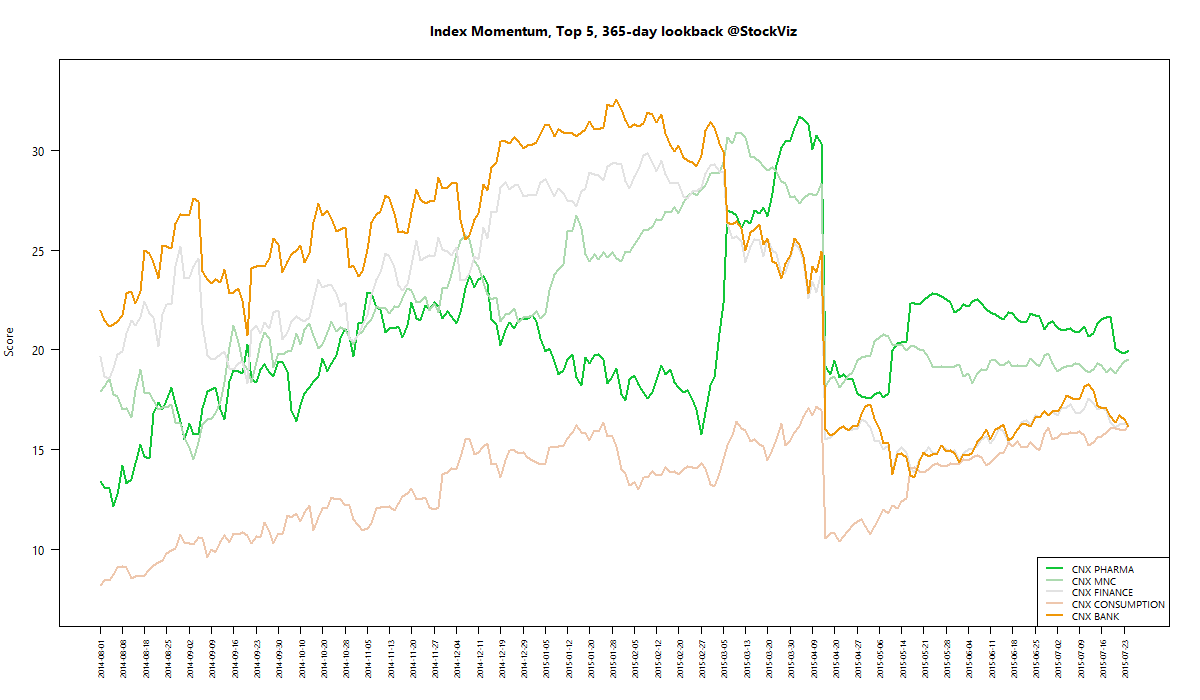
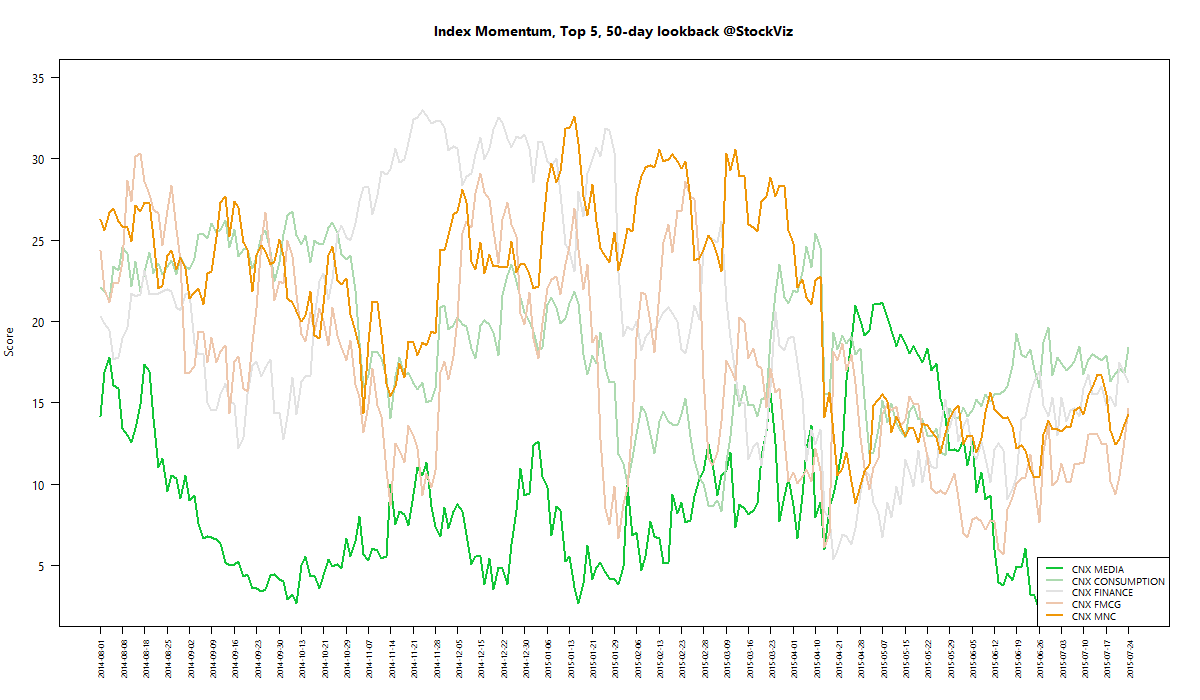
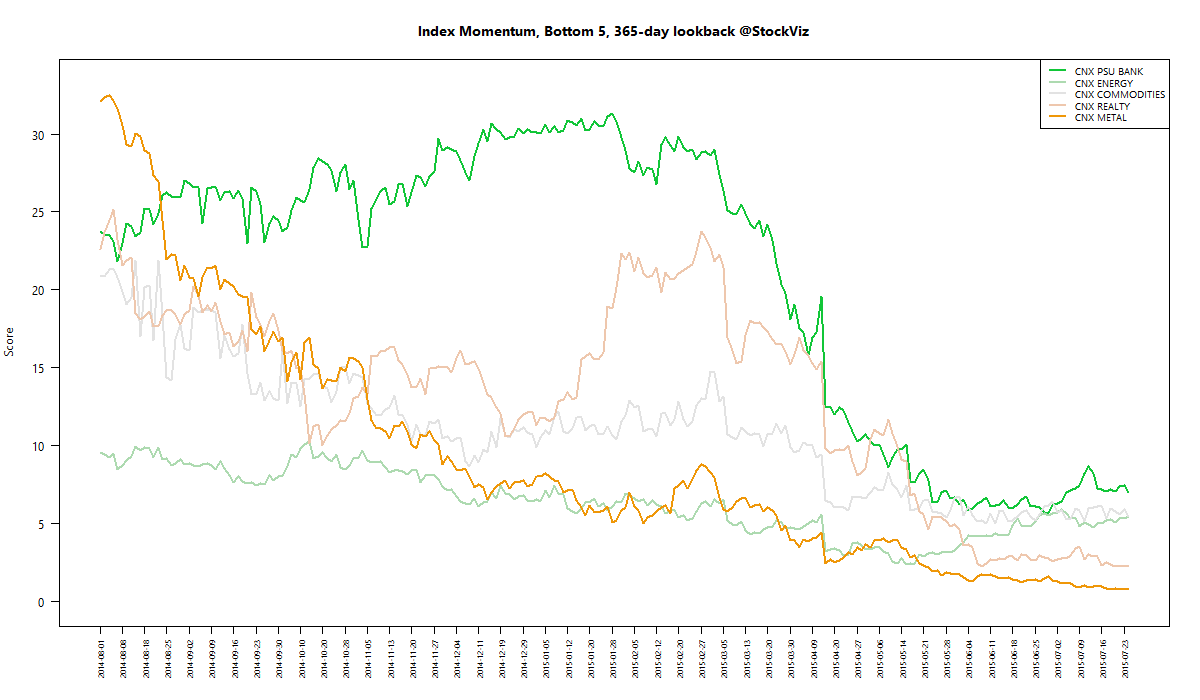
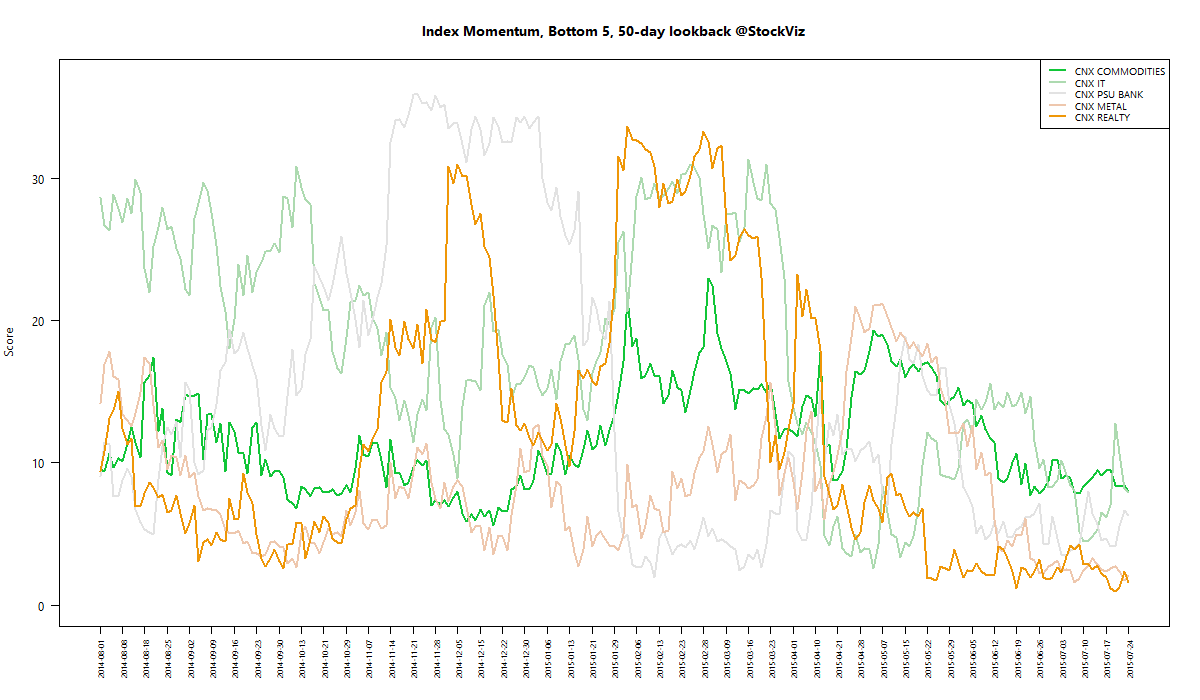
We run our proprietary momentum scoring algorithm on indices just like we do on stocks. You can use the momentum scores of sub-indices to get a sense for which sectors have the wind on their backs and those that are facing headwinds.

Traders can pick their longs in sectors with high short-term momentum and their shorts in sectors with low momentum. Investors can use the longer lookback scores to position themselves using our re-factored index Themes.

You can see how the momentum algorithm has performed on individual stocks here.

Here are the best and the worst sub-indices:

index momentum best 365 2015-07-24 png

index momentum best 50 2015-07-24 png

index momentum worst 365 2015-07-24 png

index momentum worst 50 2015-07-24 png

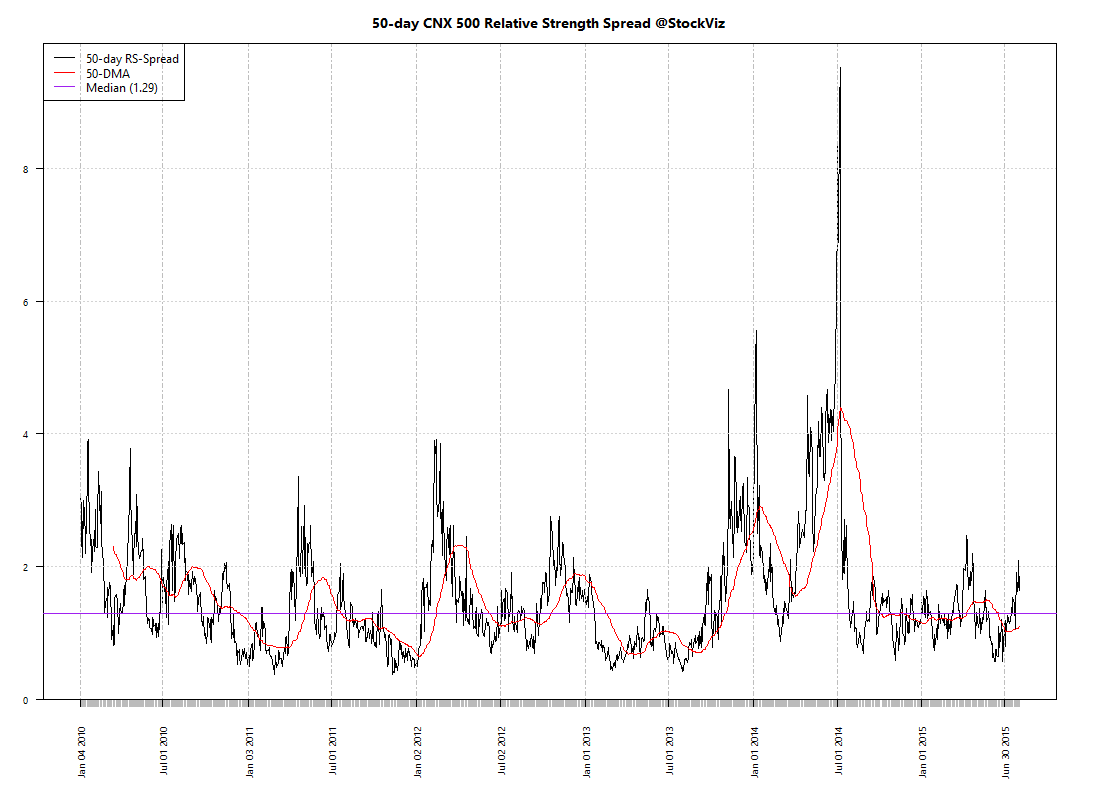
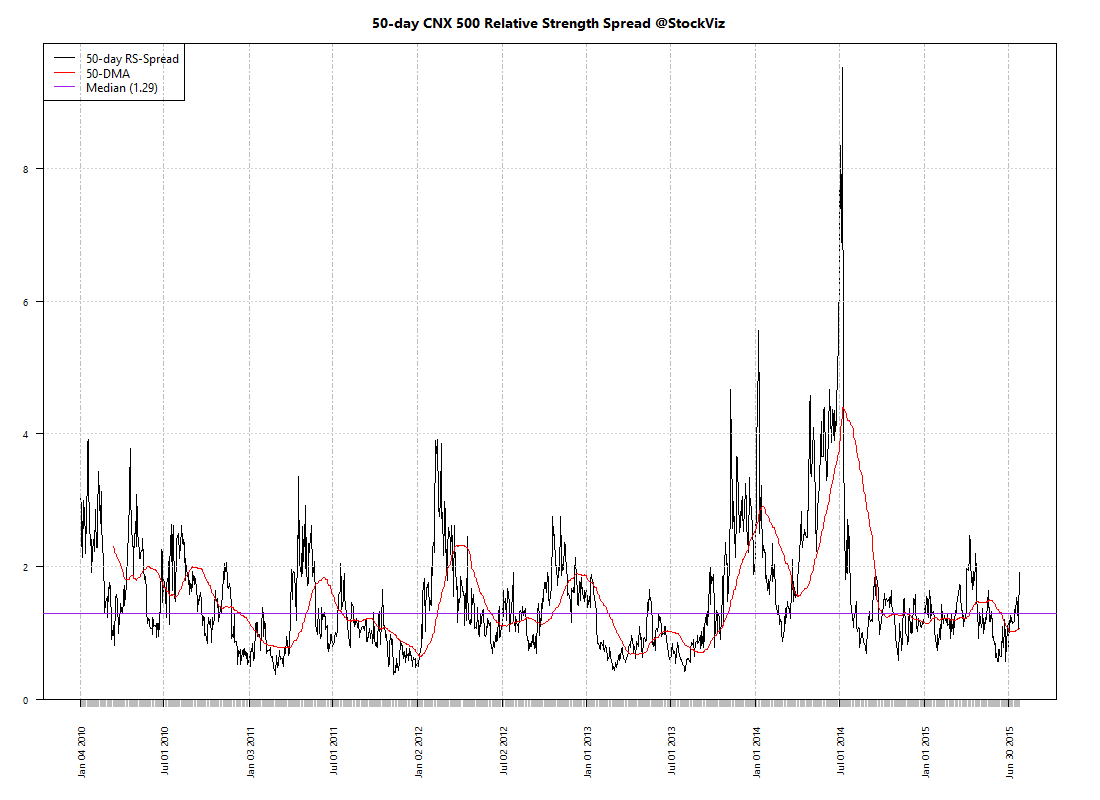
Relative Strength Spread

CNX_500 relative-spread-index 50 2015-07-24 png

Refactored Index Performance

50-day performance, from May 18, 2015 through July 24, 2015:

Trend Model Summary

Index Signal % From Peak Day of Peak
CNX AUTO LONG
6.90
2015-Jan-27
CNX BANK SHORT
9.34
2015-Jan-27
CNX COMMODITIES SHORT
27.83
2008-Jan-04
CNX CONSUMPTION LONG
0.49
2015-Jul-22
CNX ENERGY LONG
25.60
2008-Jan-14
CNX FMCG SHORT
8.93
2015-Feb-25
CNX INFRA SHORT
46.63
2008-Jan-09
CNX IT LONG
88.00
2000-Feb-21
CNX MEDIA LONG
19.72
2008-Jan-04
CNX METAL SHORT
60.84
2008-Jan-04
CNX MNC SHORT
0.95
2015-Jul-16
CNX NIFTY LONG
5.28
2015-Mar-03
CNX PHARMA LONG
11.60
2015-Apr-08
CNX PSE LONG
23.77
2008-Jan-04
CNX PSU BANK SHORT
39.09
2010-Nov-05
CNX REALTY LONG
90.87
2008-Jan-14
CNX SERVICE LONG
6.07
2015-Mar-03
Index momentum seems to have leveled off. Are we seeing a near-term top? NIFTY is still 5% below its April top…

Correlation Update 25.07.2015

Nifty one year daily return correlations

Nifty one year daily return correlations

Nifty one month daily return correlations

Nifty one month daily return correlations

Bank Nifty one year daily return correlations

Bank Nifty one year daily return correlations

Bank Nifty one month daily return correlations

Bank Nifty one month daily return correlations

Midcap one year daily return correlations

Midcap one year daily return correlations

Midcap one month daily return correlations

Midcap one month daily return correlations

A lot of thick blue squares mean that positive correlations are high. Red squares mean negative correlations are high. Whites are the doldrums.