Category: Your Money

Calculating Returns The Correct Way

You often hear this whenever someone is trying to sell you something: “Don’t worry, this investment will double in 5 years” or “You will not lose money on this.” But how can you tell if it’s the right investment for you? When you look at any investment, be it real estate, gold or stocks, you need to consider two things: risk and reward.

So lets dissect the first statement: what does doubling in 5 years really mean? Your cashflow looks something like this:

image
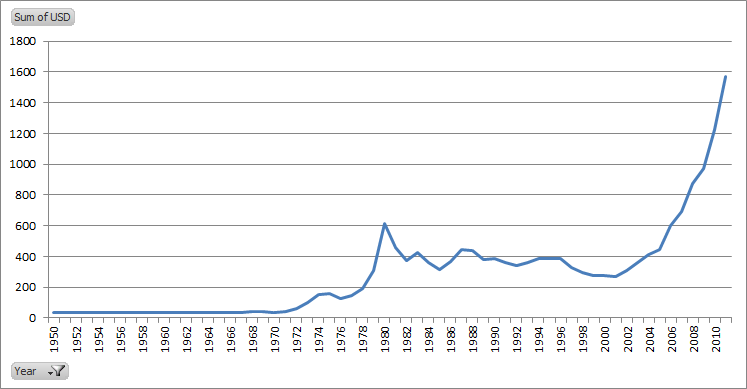
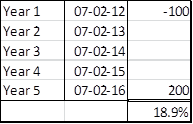
Spend 100 now, get 200 back 5 years from now. If you run this through the XIRR function on Excel, it shows that your reward is a 19% Internal Rate of Return. Sound good? Would you take this rate of return on gold? Yes. How about teak plantations? Perpetual motion machine?

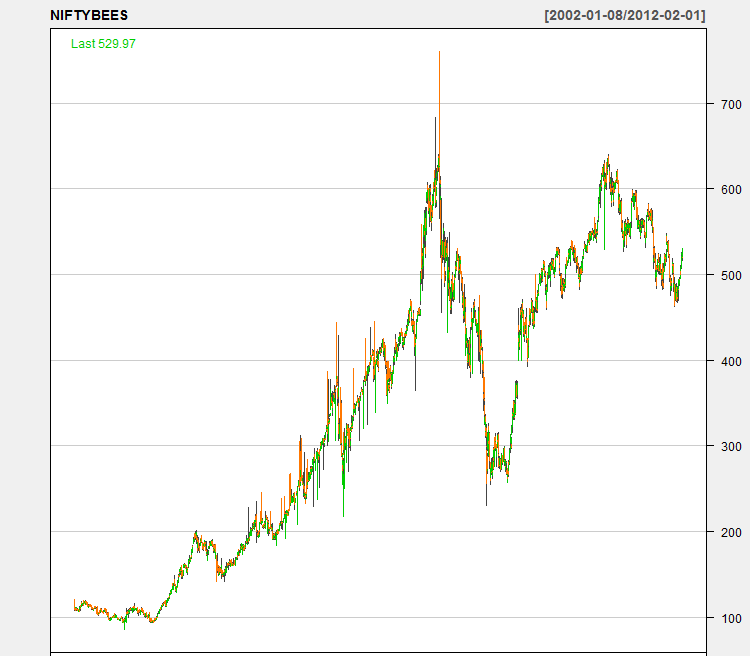
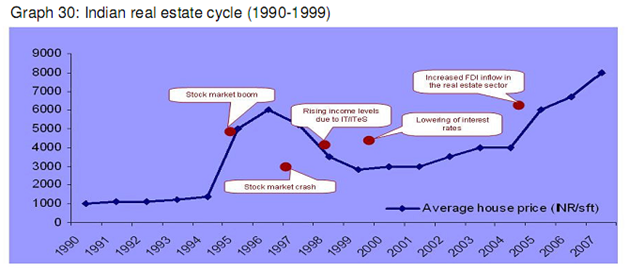
Here’s where risk plays a part in helping you gauge whether something is a good investment or not. Gold, at a 19% IRR is way better than land at the same IRR. Land at 19% is better than teak plantations at the same rate and so on. The way you figure out if you are being compensated for the risk you are taking is by comparing it with the risk-free rate for the same time period. For example, if you keep the same money in a bank fixed deposit, you’ll earn about 9% for 5 years. So the additional risk that you are taking to get to the 19% return is worth 10%.

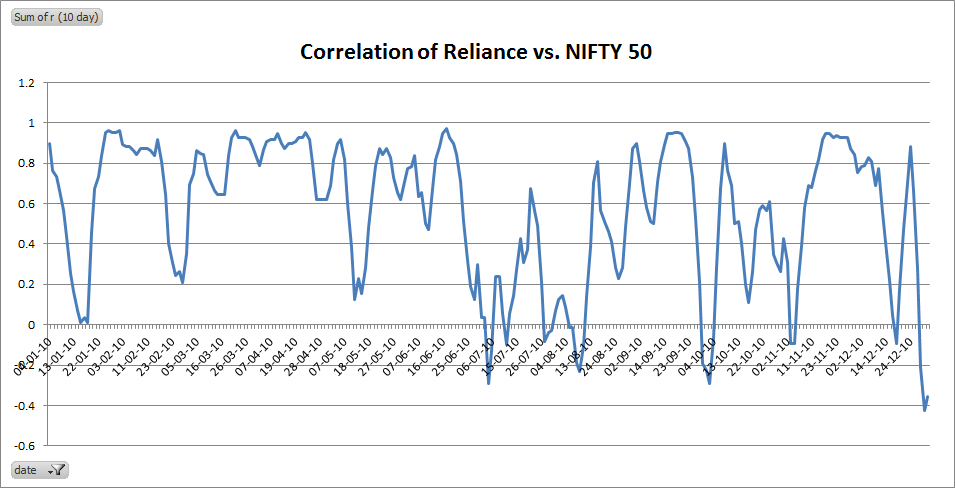
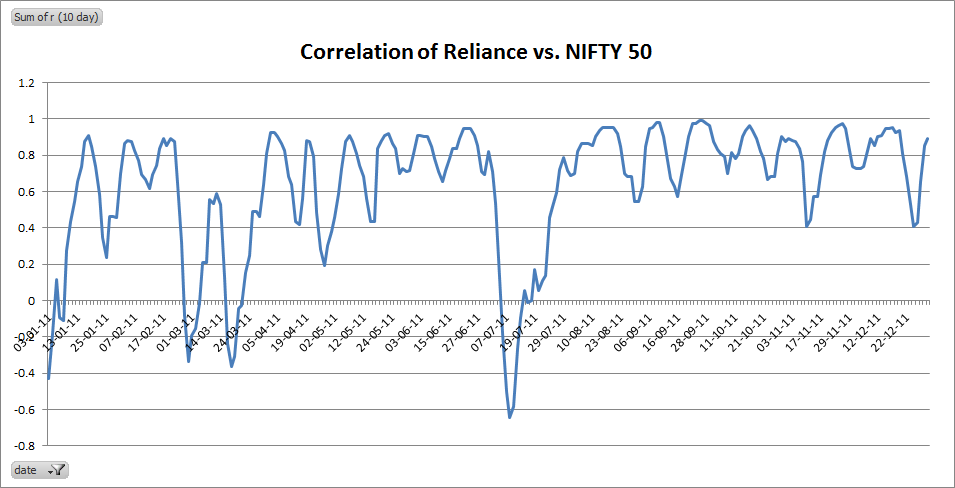
Negative returns are those that grow less than the base rate. Getting 5% when the risk-free rate is 9% is losing money. If a stock goes up by 10% while the NIFTY 50 goes up the 12%, that’s a bad stock pick. You always need to compare the returns you get to a risk-free or passive investment in order to figure out if it makes sense. In order to compare investments across different areas, people smarter than me have come up with a variety of metrics (each of which are flawed in its own unique way) and the concept of “risk adjusted returns” which I will attempt to explain in layman terms in the future.

Tomorrow’s post will discuss the effect of inflation and transaction costs on real returns. If you have any questions, please email me: abhi@stockviz.biz

The Reliance on Correlation

Our previous discussion of correlation in the NSE looked at a years worth of data for the NIFTY 50 components to see how individual stocks correlated with the index. There are three ways to look at correlation:

  1. Highly correlated stocks can be substituted with each other. For example, if the price of stock A is highly correlated with the price of stock B (r approaching 1), then investors should be indifferent between owning A or B.
  2. Correlation can be used to expose relative value. For example, in the above example, if A pays more dividends than B, then owning A is better than owning B.
  3. Correlation as a trading tool. In the above example, say on a particular day A drops (or rises) more than B, then you can put on a trade betting on mean reversion – that ultimately A & B will start behaving similarly.

For example, lets have a look at RELIANCE over the NIFTY 50 index. I created a series of 10-day correlations (r)

For 2006:

image

For 2007:

image

For 2008:

image

For 2009:

image

For 2010:

image

and lastly for 2011:

image

It looks like RELIANCE is usually highly correlated to the NIFTY 50 and the range is somewhere between 0.7 and 1.0. Lets have a look at the histogram to get a better idea:

image

You need to ignore the deviations around stock splits and dividend ex-dates (for example, on 26-Nov-2009, RELIANCE issued a 1:1 bonus so the displacement that you see surrounding that date should be ignored) to truly appreciate what’s going here.

The charts show that there are significant number of instances when the correlation breaks down but it always moves back into the range. Looks like betting on convergence seems to be a no-brainer.

Have a trade idea? Let me know!

India proves too hot to handle for Norway’s Telenor

Telenor-pirat

Telenor-pirat (Photo credit: Hanne LK)

This is the story of how Norway’s equivalent of India’s BSNL got involved in a $40bn telecom scam. The Indian Supreme Court cancelled 122 2G licenses given on a no-bid basis in 2007. Yes, we are talking about something that happened 5 years ago for technology that’s 10 years old. But the fascinating part is that the spectrum was first sold to a real estate company called Unitech about for $365.42 million which then turn around and sold a 60% stake in its wireless division to Norway’s Telenor for $1360 million! I’m sure some people were feeling pretty smart about turning in a 270% profit for their “navigating” skills.

The minister, A. Raja, who sold the spectrum is a nobody from South India representing a grand total of one million voters. It must be a pretty fascinating journey for him coming in #2 in Time magazine’s 2011 list of “Top 10 Abuses of Power” list (just behind the Watergate scandal).

The underpriced spectrum giveaway unleashed a price war where SMS and voice tariffs in India were hammered down to the lowest in the world. Telenor had planned to invest about $3 bn in India and is said to be almost 2/3rds there. So that’s $2 bn that just got vaporized. Besides, they had out sourcing agreements with a whole bunch of Indian BPOs. Wipro is said to have $550 million worth of deals.

Its funny how Telenor, one of the top performers on the Dow Jones Sustainability Indexes for the 10th year running, got dipped in Indian curry.

Sources:

Telenor History, Nilgiris Lok Sabha Constituency), A Raja, 2G Spectrum Scam, Uninor, IT BPOs Hit

Wife loves Gold. Mom loves Real Estate. Stocks are for Gamblers.

Risk taking is inherently failure prone. Otherwise, it would be called sure-thing taking. –Jim McMahon (American Football Player)

The most favored assets for the Indian middle class remains gold and real-estate. And this is not a post-global-financial-crisis story, it has remained so since my grandmother’s time. The oft cited reasons are that these are “safe” i.e.: they will not depreciate in value. And evidence over the past 20 years suggests that it has indeed been so. But will it be forever into the future?

So lets see what happened over the last few years:

Devaluation: in 1980 1 USD bought about 8 INR. Now it buys about 50 INR.

image

The stock market had its share of controversies, roller-coasters and outright fraud.

image

Increasing urbanization post 1990 lead to a real estate boom in the cities.

image

And Gold went parabolic.

image

So basically, if you ask your mom, wife or uncle, the underlying belief would be that these trends are going to continue forever.

Please allow me to make a counter-point: What is the bid-offer for all these “investments”? For gold ornaments it about 20% (try selling a bunch of old jewelry). For real estate (land) it’s a 3-6 month process and trying to sell a 5 year old residential flat might give you a heart attack.

Stocks and ETFs, on the other hand, are liquid. If you want to buy gold as part of an investment portfolio, buy GOLDBEES or if you want to buy real estate as an investment, buy a basket of RE stocks. I am not advocating an “either/or” scenario. Its just that conventional wisdom has such a strong recency bias that you need to verify why it so by taking a step back every once in a while.

Spotted: Some Golden Crossings!

golden cross • swirl

Image by origamidon via Flickr

The January rally has sprouted some Golden Crosses that investors should take note. A Golden Cross is when the 50-day moving average edges atop its 200-day moving average. It indicates that the intermediate-term uptrend has overtaken the longer-term trend. Here are some stocks that formed the Golden Cross the past month: CAIRN, PIRHEALTH, TATACOMM, WIPRO.

The GC marks the spot when a bounce within a bear market transitions to a bull market. All sustained bull markets, by definition, come with the 50 DMA above the 200 DMA.

It looks like the NIFTY has some ways to go before the cross, so its not time yet to break out the champagne. However, Hang Seng index (tracked by the HNGSNGBEES) seems to have crossed over to the bull camp.

Go Bulls!