Category: Your Money

Weekly Recap

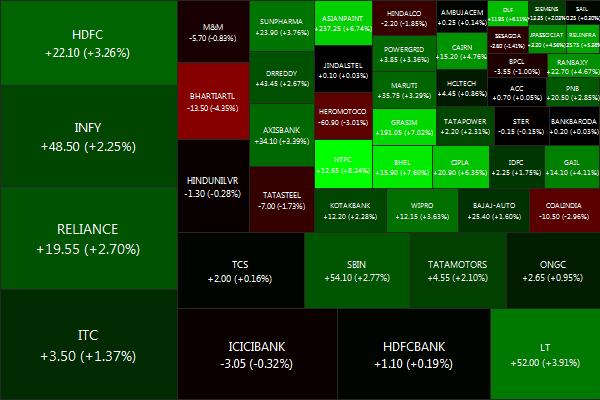
NIFTY.2012-08-06.2012-08-10

The NIFTY ended on a positive note, drifting up +1.47% for the week.
Biggest losers were BHARTIARTL (-13.79%), SBIN (-5.86%) and RANBAXY (-4.91%).
And the biggest winners were STER (+8.61%), M&M (+8.00%) and HINDUNILVR (+6.67%).
Advancers lead decliners 37 vs 13
Gold: +0.07%, Banks: +0.12%. Infrastructure: -0.09%,

IIP numbers that came out this week point to continuing slowdown in investments.

The only bright spot is that FII inflows continue to remain firm. Foreign investors pumped in closed to $2 billion in July. This, combined with hope that the government will announce a slew of fiscal policies to tackle the burgeoning deficits, uncontainable inflation and slowing growth has kept the market drifting higher.

Also, remember that Europe is on summer vacation. Summitry and politics have been postponed to September. If the global macro situation worsens next month, we can no longer rely on FIIs to support the market.

Will we be ready by September to stand on our own two feet?


Daily news summaries are here.

KG D6: Time to end the off-field drama

From being a prized asset to a pain in the neck for Reliance Industries (RIL) [stockquote]RELIANCE[/stockquote], the government, investors and other stakeholders, KG-D6, the country’s biggest gas discovery, has been mired in several off-field controversies than on-field exploits. Production was expected to touch 80 mmscmd by April this year as per the original development plan after all the 31 wells are drilled and brought to production. However, in the last few months, output has dipped to below 30 mmscmd, sparking a ugly row between the government and operator of the eastern offshore block, Mukesh Ambani-owned RIL. This will be the lowest level since RIL began production from KG-D6 block in April 2009.

imageWhile a drop in pressure in the wells and increased water and sand ingress pulled down per-well gas output, the flagging Krishna-Godavari (KG)-D6 fields has been subjected to several other distractions like sharp downward revision in provable reserves by partner Niko Resources, tussle between RIL and the government after the centre refused to clear the operator’s investment proposals of over $1.5 billion and delays in regulatory approvals forcing the company to defer investments.

Under the production sharing contract, the government allows companies to recover their cost from revenues and then share profits with the government.

Last November, RIL sent an arbitration notice to the government over recovering its investments in the KG basin after the oil ministry disallowed the cost recovery saying RIL failed to meet drilling commitments, accusing it of violating the production sharing contract.

Some voices in the street also believe that RIL is deliberately allowing production to drift downwards as it is unhappy with the gas price of $4.2/ mmbtu that stays till 2014.

The ugly battle has created a climate of uncertainty and loss of confidence among global oil & gas majors, forcing them to stay away from India’s hydrocarbon sector.

imageInstead of adopting a confrontationist stance, the oil ministry and the company need to bridge the gap and work in tandem for the sake of the country’s energy security. Sagging output from KG-D6 has forced companies to import gas at almost double or triple rates. While KG-D6 gas is available at $4.2/mmbtu plus taxes and marketing margin, imported gas varies anywhere from $8.5/ mmbtu to $14/mmbtu.

While the government must get rid of its bureaucratic hurdles and cut down on red tape, RIL must ensure greater transparency in terms of the problems facing the basin, the costs undertaken, etc. Both the sides have taken steps in this direction. While the oil ministry has conditionally approved RIL’s KG budget for the last three years, the Mukesh Ambani-controlled company has agreed to provide the Comptroller and Auditor General of India (CAG) access to records of the KG D6 block. This paves the way for the company to obtain green signal for its integrated field development plan (IFDP), which is crucial to revive the declining KG-D6 production.

technical analysis chartThe conditional approval will not only facilitate investments but also lead to an amicable resolution of the pending arbitration between RIL and Oil Ministry over reduction in KG – D6 cost-recovery.

For RIL, its fortunes and growth outlook are linked to quick recovery in gas production from KG-D6 basin. Last fiscal (FY12) saw the company’s share price slump by 28.6% against a 10.5% fall in the Sensex during the same period, reflecting investors’ unease over the standoff. If RIL is to regain its aura as the darling of D-Street, it needs to step up the gas and ramp up declining production.

Weekly Recap: Hopium

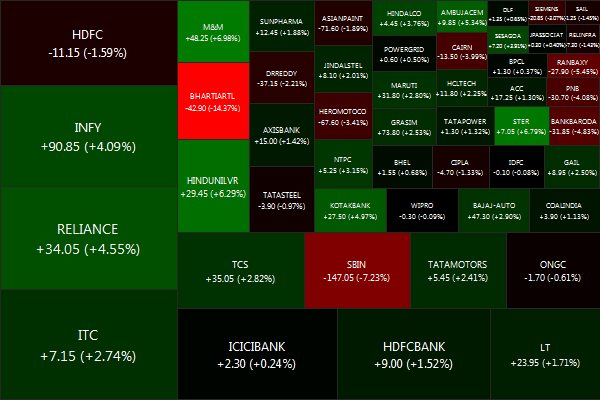
NIFTY.2012-07-30.2012-08-03

The NIFTY ended on a bullish note, shooting up +2.25% for the week.
Biggest losers were BHARTIARTL (-3.56%), COALINDIA (-2.80%) and HEROMOTOCO (-2.53%).
And the biggest winners were NTPC (+8.48%), BHEL (+8.35%) and GRASIM (+7.83%).
Advancers lead decliners 42 vs 8
Gold: -0.41%, Banks: +1.64%. Infrastructure: -1.21%

Friday’s overseas action will boost the Monday open of the NIFTY. The Dow shot up +1.74% to 13103, S&P +1.94% and Crude +4.63% to $91.16 on good unemployment numbers. Europe apparently read the fine print overnight and decided it liked what Mr. Draghi said: Stoxx 50 +4.8%, Germany +4%, France +4.4%, Italy +6.2%, Spain +5.8%, U.K. +2.2%.

Daily news summaries are here.

Have a nice weekend!

Weekly Recap

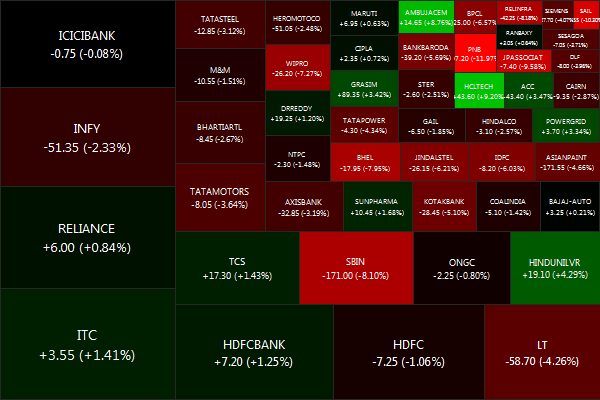
NIFTY.2012-07-23.2012-07-27

The NIFTY ended on a bearish note, melting down -2.16% for the week.
Biggest losers were PNB (-12.76%), SAIL (-10.88%) and JPASSOCIAT (-10.16%).
And the biggest winners were HCLTECH (+7.90%), AMBUJACEM (+7.69%) and HINDUNILVR (+4.16%).
Decliners eclipsed advancers 37 vs 13
Gold: +2.10%, Banks: -3.32%. Infrastructure: -1.75%

Its all in the hands of central bankers and policy makers in Europe now. Comments from European Central Bank President Mario Draghi sent shares flying over the last couple of days. (source, source) Here’s what the market is expecting (and Europe better deliver):

  • using Europe’s rescue funds buying government bonds on the primary market
  • ECB purchases of government bonds on the secondary market to ensure transmission of its record-low interest rates
  • ECB rate cuts and long-term loans to banks
  • granting a banking license to Europe’s permanent rescue fund, the European Stability Mechanism
  • reduce Greece’s debts by a further 70-100 billion euros by making the ECB and national central banks take losses on their holdings of Greek government bonds

Meanwhile, the breaking of the 5100 NIFTY support (before the Draghi rally) shows that the market has given up on anything positive coming out of our current government. Will we see the August lows again?

Daily news summaries are here.

Bollinger Bands

Bollinger Bands is one of the most widely used volatility indicators. The band is developed by John Bollinger and as the name suggests these are bands (ranges) above and below the price movements. The bands widen when the volatility increases and narrow when volatility decreases. They can be used to identify M tops and W bottoms or to determine the strength of the underlying trend.

The band uses 20 day SMA’s for the calculation of the middle band and for the upper and lower band, SMA plus or minus 2 standard deviations of the past 20 days prices. A simple moving average is used because the standard deviation formula also uses a simple moving average. 95% of the price data should fall between the two bands. The prices are considered to be overextended on the upside (overbought) when they touch the upper band. They are considered to be overextended on the downside (oversold) when they touch the lower band.

image

“W” Bottoms

Arthur Merrill developed 16 patterns with a basic W shape. A W bottom forms in a downward and involves two reaction lows. In particular you should look for W bottoms where the second low is lower than the first, but holds above the lower band. There are a four steps to confirm a W bottom with Bollinger bands.

  1. A reaction low is formed (usually below the lower band, but not necessary)
  2. Bounce towards the middle band
  3. There is a new price low in the security, this low holds above the lower band (shows less weakness on the last decline)
  4. The pattern is confirmed with strong move off the second low and a resistance break.

“M” Tops

According to Bollinger, tops are usually more complicated and drawn out than bottoms. M top is very similar to a double top, though the highs might not always be equal. The second high can be lower or higher than the first high, but Bollinger suggests looking for a sign of non-confirmation when a security is making new highs. A non confirmation occurs with three steps:

  1. A reaction high is forged above the upper band
  2. Pullback towards the middle band
  3. Prices move above the previous high but fail to reach the upper band

The inability of 2nd set of price to reach the upper band shows waning movement, which can foreshadow a trend reversal. Final confirmation comes with a support break or bearish indicator signal.

Walking the bands

Moves above or below are not signals per se, but rather act as tags. A move to the upper band shows strength while a move towards the lower band shows weakness. According to the momentum oscillators overbought and oversold signals do not necessarily provide a bullish or bearish signal. Hence the prices can actually walk the band with numerous touches during a strong uptrend and not face the trend reversals.

During this period, prices won’t close above upper band if in a downtrend or won’t close below the lower band if in an uptrend. Such a pattern of the prices staying within the bands (in sync with the underlying trend is called walking the trend.

Let us now look at an example of the above 3 signals and understand how it looks like when it is happening.

image

In the above chart you can see how we have the W bottoms and the M tops at work. With the top you can see the pullback move (the 3rd spike) and how it was unable to cross the last high and also the upper band.

In the above chart you can see how in the walking the bands for the underlying uptrend the prices are not able to close past the lower band, and hence they keep under the band all this time. image

In your trades, Bollinger bands can be of great help in understanding the price moves. According to Bollinger, the prices for 89 – 90% of the time should be within the bands, the rest can act as your cue for next move.

Utilize them to see how volatile the last 20 days have been to make an informed judgment about your scrip.

Bollinger Bands can be used to decide on option trades as well. Narrowing Bollingers indicate that volatility is falling. If the bands have narrowed significantly over their 2-3 month average, it could be time to buy volatility on that stock. Compression of Bollinger Bands is usually signal of a coming volatility surge.