Category: Your Money

Strategy Performance Roundup

We have been tracking different investment strategies through our Themes – a handy way to create, track and allocate capital to different investment strategies. As our frequent readers know, we do a “doodh ka doodh pani ka pani” theme whenever analysts come out with portfolio recommendations. Add to the mix our own value and quantitative strategies, and we have a fairly wide array of investment options for investors to choose from.

Here’s a roundup of how the different Themes performed, and the performance of ETFs over the same time-frame. Because at the end of the day, if the Nifty ETF out-performs the bheja-fry, why bother?

Three Months

From 2013-9-13 to 2013-12-13

Value strategies are usually perceived to require a long time to pan out. But our Quality-to-Price portfolio left the nearest competitor in the dust. Also, you got rewarded for going down the market-cap tables.

Should you have invested in ETFs, these are the returns over the same period.

BANKBEES +11.56%
JUNIORBEES +10.57%
PSUBNKBEES +10.08%
NIFTYBEES +5.64%
INFRABEES +2.82%
GOLDBEES +1.71%
Not bad, but not very encouraging to the efficient market hypothesizers.

Two Months

From 2013-10-15 to 2013-12-13

Mid-caps continued to out-perform large-caps. But cheap stocks were probably getting fully-priced at this point.

Should you have invested in ETFs, these are the returns over the same period.

PSUBNKBEES +15.93%
BANKBEES +9.91%
JUNIORBEES +4.38%
NIFTYBEES +1.53%
GOLDBEES +0.20%
PSU Banks caught a bid after getting hammered relentlessly for over a year. But even the Junior Nifty couldn’t beat a quantitative or hand-crafted portfolio.

One month

From 2013-11-14 to 2013-12-13

Should you have invested in ETFs, these are the returns over the same period.

BANKBEES +5.11%
PSUBNKBEES +4.72%
NIFTYBEES +2.01%
INFRABEES +1.50%
JUNIORBEES +0.61%
GOLDBEES -2.82%
Very little to talk about here except point out that during all three periods, gold was the worst investment to make.

Conclusions

Well, three months is a very small window to draw any meaningful conclusions but here are some observations:

  1. Quantitative Value had 2 in the top 5 performers over the last 3 and 2 months. It is as close to “Investing Without Emotions” that you will ever get.
  2. ETFs turned in some very meh returns.
  3. Banks and mid-caps have been out-performing.
  4. Gold lost its luster – but don’t tell that to Indian house-wives 🙂

The Little Book of Behavioral Investing: You Gotta Know When to Fold Them

Learning about traits that make us bad investors has been an enlightening but uncomfortable sojourn. Uncomfortable because too often, I’m guilty of the very behavior Montier discourages. A lifetime of bad habit is hard to correct! But the quality Montier explores in Chapter 15 of The Little Book of Behavioral Investing: How not to be your worst enemy will, I believe, prove the hardest of them all.
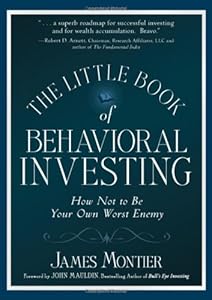
Cover of "The Little Book of Behavioral I...

Have you heard the story of a speaker addressing a large crowd and saying “Half the people here are stupid.” Not surprisingly, the audience roars in resentment. He reframes, “Half the people here are intelligent.” The crowd is mollified though the implication of both statements is the same.

“Loss aversion,” the topic under discussion, has a similar psychological premise. Even professional golfers and capuchin monkeys suffer this weakness; not that they’re comparable but Montier gives us illustrative examples of both. Let me share the primate story with you.

An experiment was conducted where two testers played a game with capuchins:

Case 1: Give the monkey a grape. Flip a coin. On one outcome (heads or tails), give a bonus grape to the monkey.

Case 2: Give the monkey two grapes (bonus). Flip a coin. On one outcome, take one grape away from the monkey.

Case 1 is positioned as a gain and Case 2 as a loss. Even though both will lead to the monkey winning or at least retaining two grapes at a 50% probability, the capuchins returned predominately to the first experimenter. They exhibited loss aversion. And we’ve not evolved enough to get rid of this bias.

But it’s not just loss aversion that plays with our judgment. We are also blessed with a myopic point of view, making us too focused on the short-term. It’s why so many traders glue their eyes to online stock dashboards, watching stock prices every second. If you’re one of this group and still not a nervous wreck, hear this: You’ve got it wrong.

Cebus apella group. Capuchin Monkeys Sharing

It’s unpractical to expect your portfolio stocks to do well in the short-term. Joel Greenblatt who advises investors to follow his magic formula recalls that “the magic formula portfolio fared poorly relative to the market average in five out of every 12 months tested. For full year periods the magic formula portfolio failed to beat the market average once every four years.” But it produced long-term gain.

You’d think loss aversion would have us cutting our losses wherever possible.  But that’s not the case. There’s a distinct difference in behavior “after loss” versus the “risk of incurring a loss”. People don’t believe a loss will materialize till it actually hits them. This is the disposition effect. It’s why investors stick with stocks they’d do better to sell.

The endowment effect – the tendency to overvalue something when we own it – makes it worse. A losing stock on my portfolio? There’s hope yet. A losing stock in the market? Stay away.

Here are some startling facts from Terry Odean’s examination of data from a discount brokerage:

  • Investors held losing stocks for a median of 124 days versus 102 days for winning stocks.
  • On average, individual investors sold 15% of all winning positions and only 9% of all losing positions.
  • Winners sold outperformed losers that continued to be held by an average of 3.4% per annum.

This is loss aversion at work compounded by over-optimism, over-confidence and the self-attribution bias. And these stats hold good for both professional and individual investors.

The solution again is the resilient investment plan covered in Chapter 2. Stop losses alleviate the disposition effect in that selling or buying decisions are preempted by prior valuations rather than volatile data and reports. Of course, you must distinguish between cigar-butt stocks and compounders here. The former category includes stocks bought real cheap and sold when they’re near their intrinsic value. The latter is stocks that will gain intrinsic value over a longer period. These are the ones to stick with.

So, sometimes you take a call when new data comes up. But most times, you stick with your investment plan and sell at the right time.

Monica Samuel is doing a chapter-wise review of the book: The Little Book of Behavioral Investing: How not to be your worst enemy by James Montier. You can follow the series by following this tag: tlbbinvesting or by subscribing to this rss feed: tlbbifeed

Weekly Recap: *This* Much

weekly nifty performance heatmap

The euphoria of anti-Congress soon gave way to the reality of stagflation: Nifty ended the week -1.46% (-2.19% in USD terms)

Index Performance

Risk off… Infra and Banks took it on the chin.

weekly index performance chart

Top Winners and Losers

HCLTECH +4.84%
SSLT +5.27%
INDHOTEL +6.97%
BHEL -9.80%
PFC -9.72%
ADANIENT -9.47%
High beta, industrial and power stocks got thrashed…

ETFs

GOLDBEES -1.00%
NIFTYBEES -1.71%
JUNIORBEES -2.20%
BANKBEES -2.92%
INFRABEES -3.98%
PSUBNKBEES -4.50%
I think this is the first time I’m seeing ALL ETFs in the red… there really was no place to hide except for IT.

Advancers and Decliners

advancers and decliners

Yield Curve

Rate hike priced in. The only silver lining is that it has a positive slope…

india yield curve

Investment Theme Performance

*Contributed Themes

Sector Performance

weekly sector performance

Thought for the Weekend

One forecast that is almost certain to be correct is that market forecasts are almost certain to be wrong. As a species, you humans are terrible about making predictions. Forget forecasting big events that are not in your control, such as the economy or the market, you cannot even forecast your own behavior. If you could, the fitness and diet industries would be bankrupt.

Source: Why Do Forecasters Keep Forecasting?
Related: Forecasting is a Sham – Prepare – Don’t Predict!

Apollo Tyres: Buyer’s Remorse, Part Deux

We had written about Apollo Tyre’s acquisition of US based Cooper Tyre & Rubber here. It looks like the delay is causing Cooper to shit the bed…

Cooper Tire says in a new court filing that Apollo Tyres still doesn’t have an agreement in place with the United Steel Workers. The company also says it doesn’t know for sure when its Q3 financials will be finished due to issues it can’t control. (SA)

cooper tire chart

While the market seem to like Apollo Tyer’s trying to back out of the deal…

APOLLOTYRE chart

Stay tuned!

Morgan Stanley’s Heads or Tails Portfolio

Morgan Stanley has created two sets of investment portfolios to “play” the poll results (MoneyControl)

Heads

The first is if there is a strong election result. Is basically a basket of high-beta, high-leverage, cyclical, strong short momentum stocks likely to outperform as the market gains conviction in a strong poll result.

Theme: Morgan Stanley’s Strong Election Picks Dec-2013

This portfolio’s beta is around 1.14. But if you are going to be bullish, why hold yourself back? The Market Fliers Theme does a better job of pushing the pedal to the metal, so to speak, with a beta of 1.84. High beta has been flying lately, the theme is +14.89% since inception, vs. the Nifty’s +4.31%

Tails

And the second is if there is a fragmented election result. Basically a good quality GARP basket, low PEG, high ROE, low beta and strong long-term momentum.

Theme: Morgan Stanley’s Fragmented Election Picks Dec-2013

This portfolio’s beta is around 0.54. But if you are going to play defense, commit! The Market Elephants Theme, with a beta of 0.27, barely has a pulse but beats the Morgan Stanley portfolio on both Sharpe and Information Ratio.

So, dood ka dood, paani ka paani!