Fair value
Equity futures have a ‘fair-value’:
Futures Price = Cash Price [1+r (x/360)] – Dividends;
where x = days to expiration of the futures contract
Fair value is the theoretical assumption of where a futures contract should be priced given such things as the current index level, index dividends, days to expiration and interest rates. The actual futures price will not necessarily trade at the theoretical price, as short-term supply and demand will cause price to fluctuate around fair value. Price discrepancies above or below fair value should cause arbitrageurs to return the market closer to its fair value. – CME
Cash-futures Basis
You can see this in action when you plot the NIFTY index value with its futures:
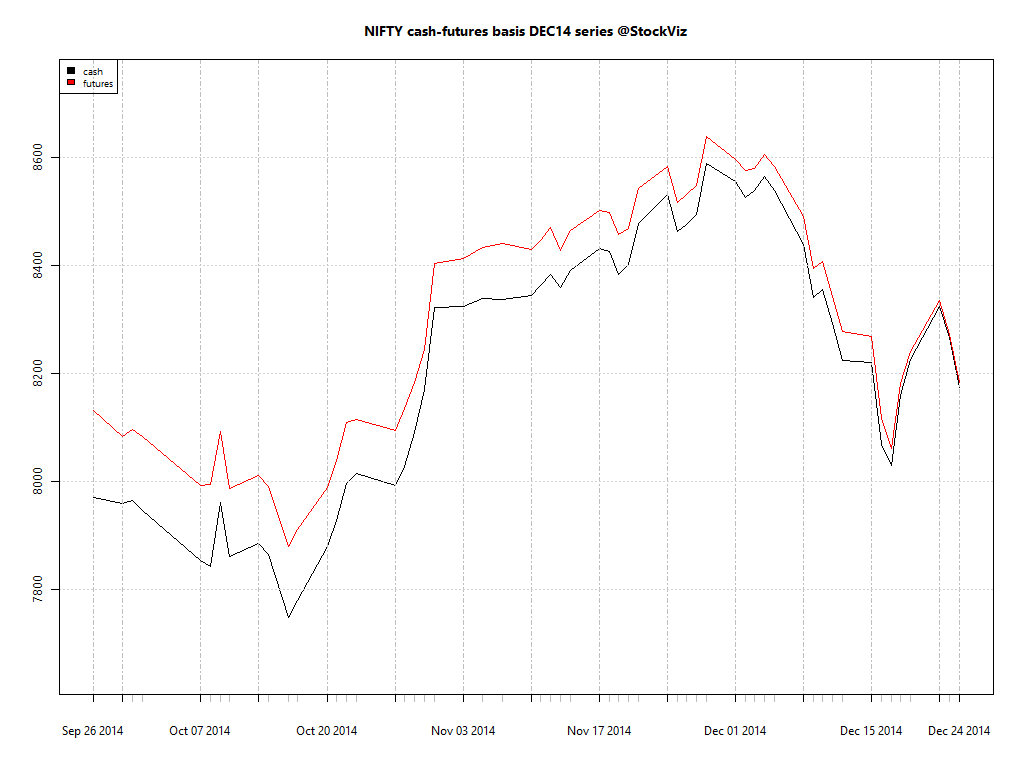
Initially, x/360 is large, so futures’ trade rich to cash. As expiry approaches, futures and cash prices converge. This is the natural order of things.
Interest Rate
You can go one step further and back out the interest rate baked into these prices:
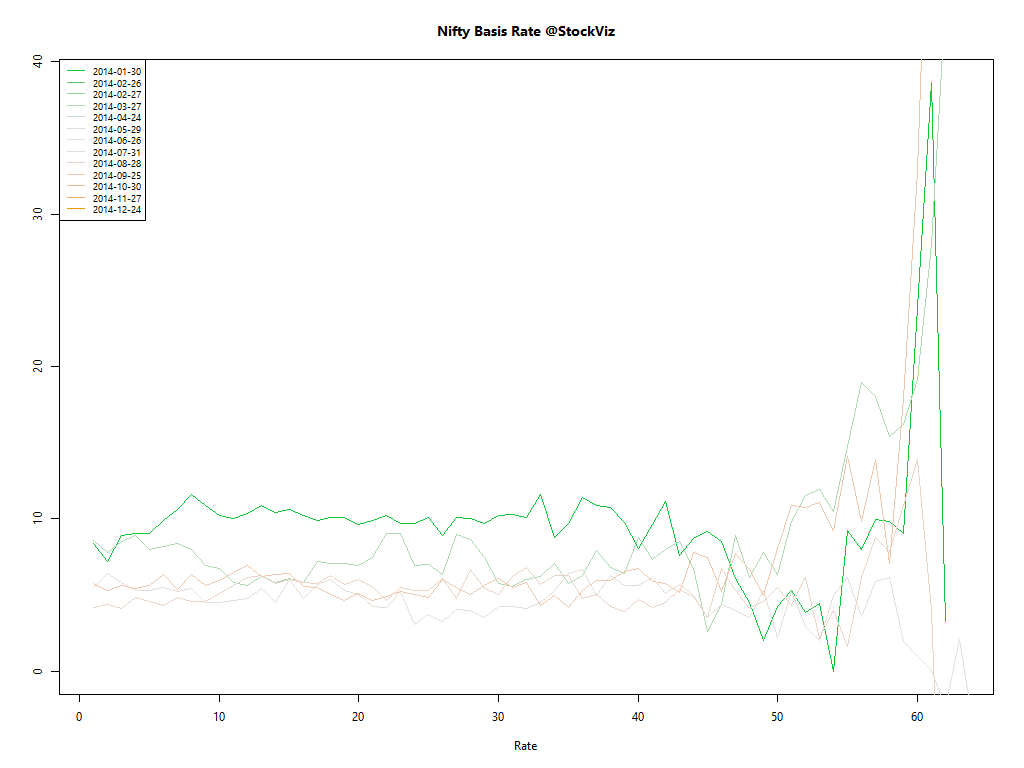
r is usually within a tight band; roughly around where short-term rates are.
So if you ever wondered why futures are trading higher than cash, now you know!