Category: Investing Insight

Investing insight to make you a better investor.

State of PMS – November 2016

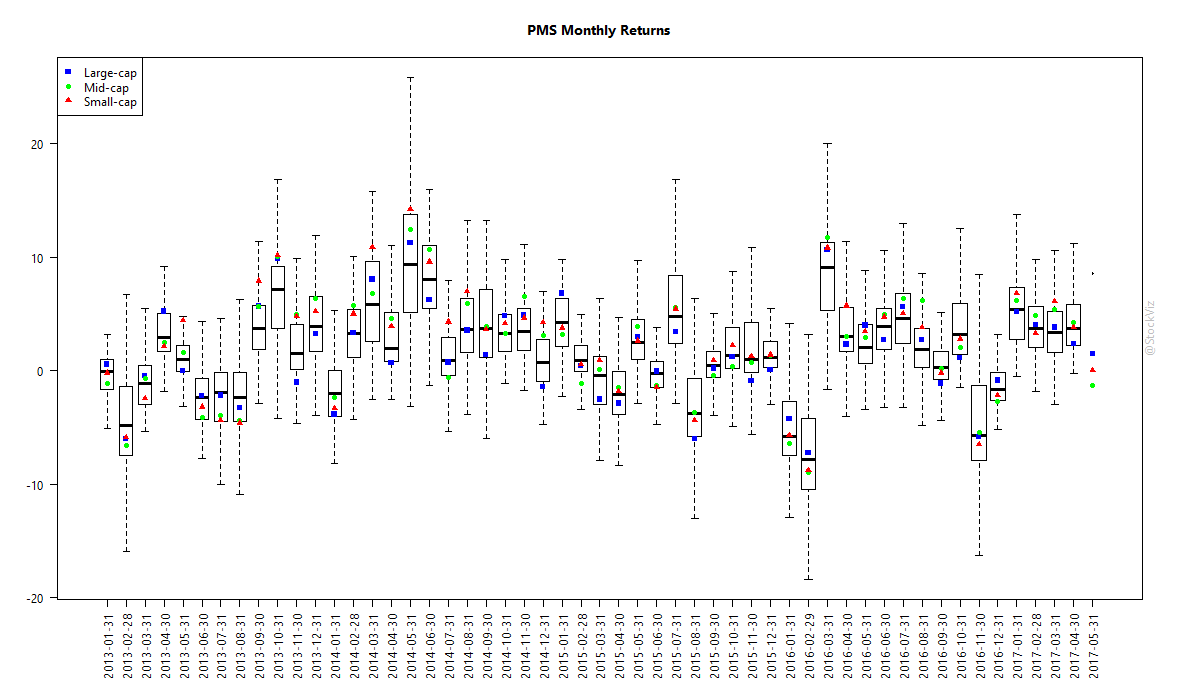
As of November this year, there are about 170 SEBI registered Portfolio Management Service providers. Until recently, their performance data was not widely available. Thanks to continued pressure from publications like MoneyLife and others, SEBI has finally published PMS details on its website. We plan to download that data and publish two key pieces of information every month:

  1. Performance diffusion – what is the range of performance put in by various PMSs.
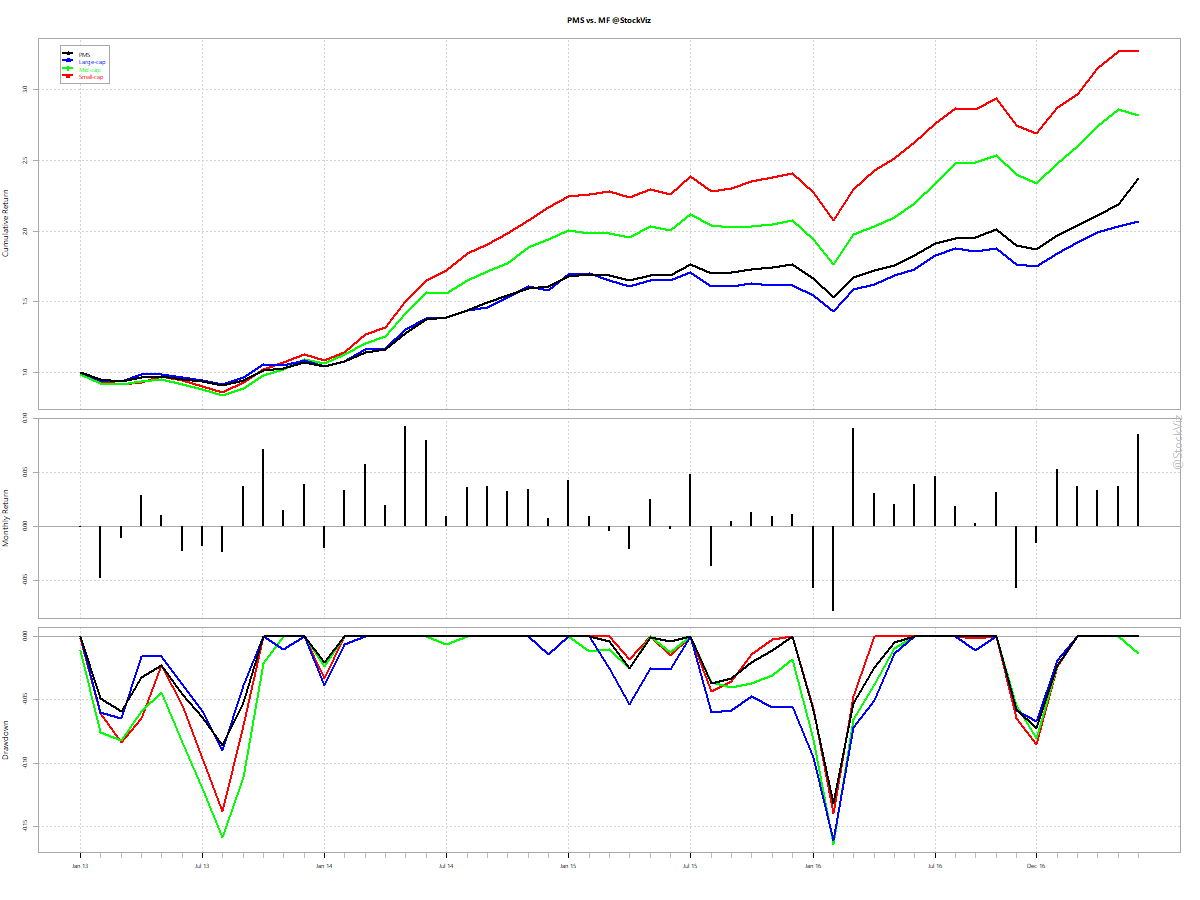
  2. Cumulative performance – how do different PMSs compare with their cheaper mutual fund counterparts.

Monthly Performance Diffusion

On an average, there is no great benefit to investing in a PMS vs. a mutual fund. The numbers here do not include performance management fees, profit share and brokerage of PMS whereas mutual fund NAV includes everything. Plus, gains from PMSs are taxed as if it were the investor’s own trading account – with the full impact of churn – whereas mutual funds do not attract capital gains tax if held for more than a year.

pms-monthly

Cumulative Returns

What if an investor just held onto a mutual fund instead of going through a PMS?

pms-mutualfund

On an average, a PMS is unlikely to beat a large-cap mutual fund after fees and taxes.

Hopefully, SEBI keeps the performance updates going on its website. With results like this, PMSs will have a strong incentive to defy SEBI’s data collection programs. Fingers crossed!

Investing in Gold

The almighty dollar

Although India and China account for a bulk of world gold consumption, the price of gold continues to be set in London and New York. When you buy gold in India, you are exposed to two things:

  1. The dollar price of gold.
  2. The USD/INR exchange rate.

Even at times when the price of gold goes down in dollar terms, if the rupee goes down more, then you still have a profit in your hands. This partly explains why Indians are crazy about gold – it is the easiest way to get short the rupee.

Dollar returns of gold

If you look at the returns of the S&P 500 vs. gold since 1970’s, gold comes out a winner.

gold-sp500-usd

Not to say that it was easy to own. Gold peaked in the 80’s and remained out of favor till 2008!

gold-sp500-usd-annual

Rupee depreciation

The dollar returns of gold is only a small part of the story. The bigger picture here is that of rupee depreciation. Let us see how USDINR compares with USD vs. a board basket of currencies:

inr-usd

See the blue line? That is how much the US Dollar has appreciated against the rupee. The green line is the dollar vs. other currencies with which America does business with.

With this in mind, let’s compare the returns from gold in USD vs. gold in INR:

gold-inr-usd-cumulative

Notice the troughs of Gold/INR is shallower than those of Gold/USD?

gold-inr-usd

When you have a depreciating currency in hand, you can’t get rid of it fast enough. And the easiest way to do that in India is to buy gold. Our government can’t print more of it, can’t set its price and is fairly liquid.

Gold vs. NIFTY50

Since 2000, Rupee-for-rupee, gold had given better returns than the NIFTY 50.

gold-inr-nifty-cumulative

It is only the recent under-performance that has the anti-gold lobby all fired up.

gold-inr-nifty

The long arch of the depreciating rupee is a more powerful force than what equity-only investors will have you believe.

Ways to invest in gold

Until recently, the only way to buy gold was to buy physical gold. However that is a very expensive proposition. Then came the gold ETF – GOLDBEES – that allowed investors to hold paper gold in demat form and provided instant liquidity. This year, the government came out with Sovereign Gold Bonds that is pretty good alternative. Here’s a handy table that looks at different aspects:

goldbond

SGBs not only pay the price of gold at maturity but actually pay the investors an annual coupon. Currently, investors get 2.5% on their investment in SGBs. Contrast this to gold ETFs where investors have to pay asset management fees to the the fund house. From an asset allocation perspective, SGBs are a better deal than Gold ETFs. Go with gold bonds!

NPS Tier II: Bogleheads Rejoice!

Did T2 kill NIFTY 50 ETFs and Index funds?

Instead of looking at NIFTY 50 ETFs or index funds, why not invest in NPS Tier II Class ‘E’? Unfortunate nomenclature aside, it is hard to beat the 0.01% management fee and the flat Rs. 190/- annual account maintenance fee. Compare that to how much you would pay if you go through:

  1. broker: brokerage + STT + stamp duty + SEBI turnover fee + service tax.
  2. direct through AMC: expense ratios between 0.26% and 1.03% (!)

As of 28th October 2016, 5-year returns across different pension fund managers are between 12.5% and 11.4%. A rough comparison with Birla Sun Life’s Index Direct Fund points to a 10.10% return over the same time-frame. Directly attributable to the lower fee structure of NPS.

The same treatment extends to corporate and government bond funds (Class ‘C’ and Class ‘G’, respectively) as well. Class ‘C’ 5-year returns have been between 11.2% and 12%. Birla Sun Life Corporate Bond Fund (direct) points to a 11% return over the same time-frame. Direct plan expense ratios for corporate bond funds are around 1%. What exactly are you getting for paying 100x more than through NPS?

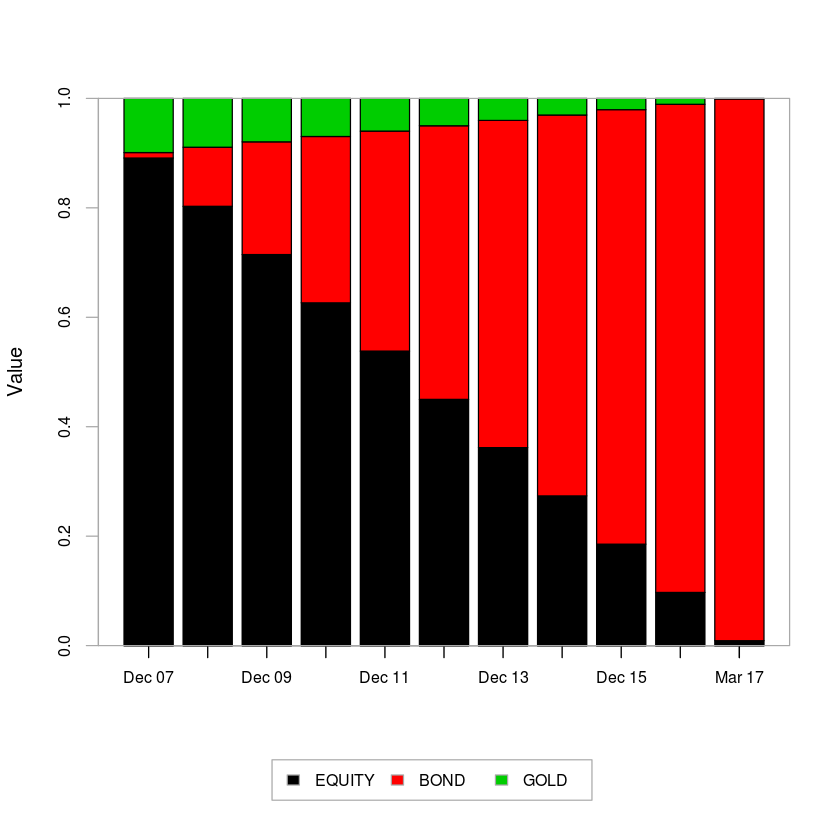
If you are a Boglehead saving for retirement, you will love the ‘Auto’ feature (Class ‘A’) that automatically shifts the asset allocation from Equity to Debt as you near retirement. All for 0.01%.

If low fees and index investing is all that you care about, then NPS Tier I (tax efficient but with an annuity requirement at the end) and Tier II (just like any other investment ‘folio’) is something you should seriously consider.

Appendix

NPS charges (FAQ)

NPS SCHEME – E (Tier-II) performance (source)

nps-t2-class-e

NPS SCHEME – C (Tier-II) performance

nps-t2-class-c

Expense ratios of index fund (direct plans)

index-fund-expense

Expense ratios of corporate bond funds (direct plans)

corp-bond-fund-expense

Total Returns

Price vs. Total Return indices

Investors often use the NIFTY 50 index as a benchmark while comparing investments. It is probably fair if you are making price comparisons. However, investment vehicles like mutual funds reinvest the dividends that they get on their holdings. So a more appropriate benchmark there is the NIFTY Total Return (NIFTY 50 TR) index.

The NIFTY 50 TR index is an index with the same constituents as the NIFTY 50 but with dividends reinvested back into the index.

total returns index equation

The Dividend Impact on Returns

To give you an idea of how dividends impact long-term returns, here’s a cumulative wealth chart of the NIFTY 50 TR Index vs. the Nifty 50 (Price) Index:

nifty-tr-returns

From the beginning of the year 2000 through to the end of August-2016, the Total Return was roughly 6x while the Price return was 4.5x. Here is how dividend reinvestment has boosted returns through the years:

nifty-dividend-returns

A 1.6% dividend boost sounds trivial until you look at the cumulative effect of it over the years.

Should benchmarks be handicapped?

When you see mutual fund returns compared with “price” indices (all NIFTY indices are price indices unless they are explicitly mentioned to be total return,) you should handicap those returns by ~1.5-2% every year to get an idea of whether the fund actually outperformed the index.

It is tragic that the NSE has maintained a total return index only for the NIFTY 50. With the rising popularity of other asset classes and strategies, it makes sense to provide a Total Return index for every Price index that they publish. We briefly touched upon this while we looked at the MNC asset class. The NIFTY MNC Index, being a price index, missed a lot of performance information. We had to compare an MNC Fund to another Midcap Fund to get a better idea of relative performance. (Read the whole thing here: The MNC Fund Gravy Train, Part II)

Code for the above charts are on Github