Category: Investing Insight

Investing insight to make you a better investor.

Market-cap Deciles and Illiquidity

Our previous post used AMFI’s classification of stocks by market-cap to analyze liquidity dynamics. What if we broke down the universe of stocks into their market-cap deciles and then applied the same illiquidity metric to them?

If you look at the full sample, median liquidity tracks market-cap.

Mid/small caps have an embedded illiquidity premium. While index/mutual funds are obligated to honor their NAVs on redemption, there is no guarantee that direct equity investors can exit without taking a direct hit. Liquidity flees during market stress.

During bull markets, the taps are open. December 2017 was the absolute zenith of the mid/small cap mania. Liquidity was ample.

A month later, the hangover began. Erstwhile small-cap momentum stocks would hit their lower-circuits within a few seconds of the open. The market-clearing price for some of them were a cool 40%-50% away from where they finished 2017. It was weeks of watching the portfolio slowly bleed away.

All this to say, understanding liquidity dynamics is as important as understanding the fundamental and technical aspects of the stocks you own.

Index Fund/ETF Tracking Difference

Previously, we had pointed out the wide gulf between ETF closing prices and NAVs. While that continues to exist, the underlying funds themselves don’t track their indices correctly. This tracking difference is the absolute difference between the returns of the fund and the underlying index.

In an ideal world, an index fund or ETF returns should only trail its benchmark by its expense ratio. However, that is not always the case. Some indices are tough to replicate in the actual market due to liquidity issues. Sometimes reference bonds get called away. Proxies don’t exactly replicate the underlying, and so on and so forth.

Thankfully, AMFI (tasked by SEBI) publishes these metrics on their website for all to see.

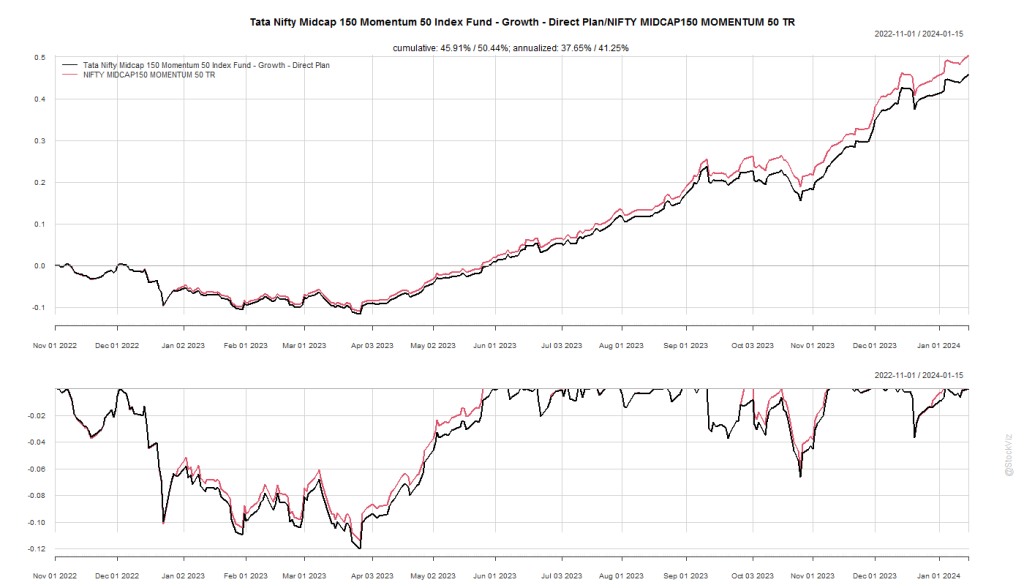
The differences are hard to notice in short-term data…

… but they add up.

Investors should be aware that not all index funds/ETFs and indices are the same and proceed with caution.

Market-cap Classification and Illiquidity

Twice a year, AMFI is tasked with categorizing the universe of stocks into “large/mid/small” and funds with specific market-cap mandates are allowed to invest in only the corresponding set of stocks (amfiindia, sebi). We have a report that shows these changes over time (stockviz).

Given the massive flows involved, what is the prospective impact on liquidity as stocks get promoted and demoted between these classes?

We measure illiquidity using Amihud’s (Illiquidity and stock returns, 2002) illiquidity measure ILLIQ.

Between market-cap classes, the differences in liquidity is large enough to warrant a log-scale:

With this large disparity in mind, we can now look at the impact of migrations.

Large-cap Exits

Mid-cap Promotions

Mid-cap Demotions

Small-cap Promotions

It appears that stocks that get promoted from mid-caps to large-caps turn a bit illiquid. Otherwise, most migrations have negligible impact on their forward six-month illiquidity measure.

Code and charts on github.

Rolling MADs

Our previous posts introduced portfolios based on Moving Average Distance (Part 1, Part 2). To answer questions regarding the stability of the moving average lookbacks, we ran a rolling window, picked the “best” MA lookbacks and walked the portfolio forward by a month. We expanded the window through 12 to 60 months in 12 month increments.

Turns out, most of them fall within the 20/200 region.

The data-mined parameters create portfolios that perform on par with the 21/200 used in the paper. While we are always skeptical about magical parameters that make the research work, at least in this case, the magic is not too far fetched.

You can follow along the live version of the original strategy here: MAD 21/200

Multiple MADs

Our previous post introduced a paper that used a moving average crossover to create a portfolio of stocks. While the backtest using the parameters in the paper looks good, the presence of these “magic” lookback parameters gives us pause. Did the authors just try a bunch of different parameters and published what worked? What if we do an exhaustive search through all possible combinations?

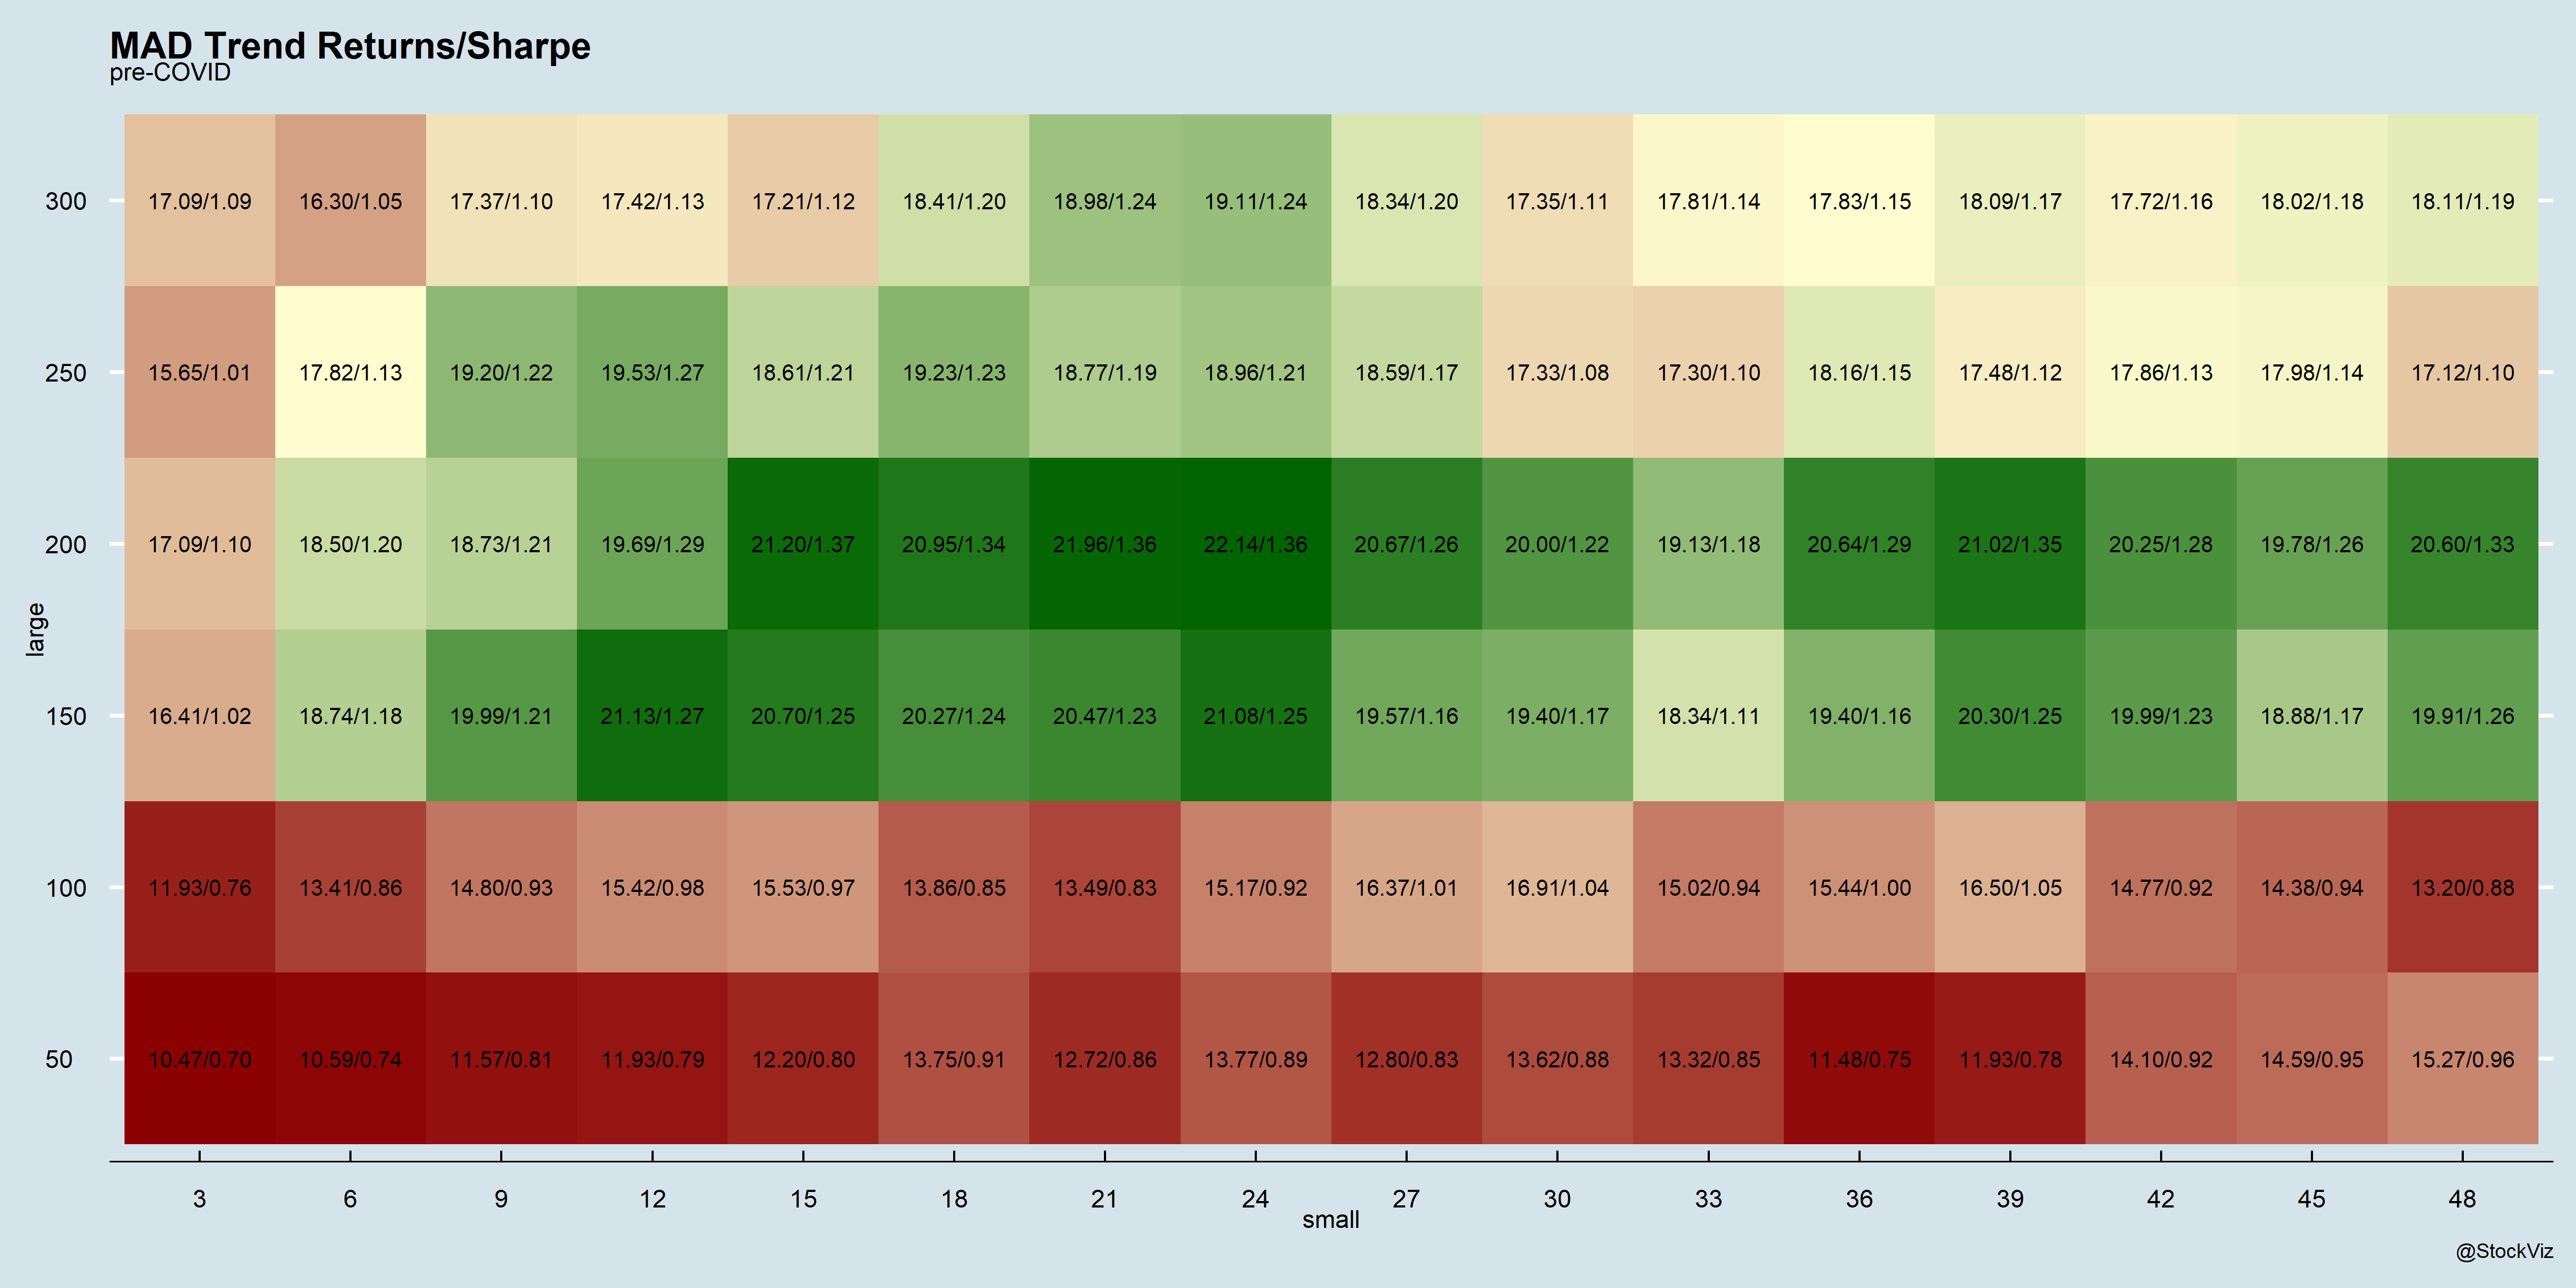
Here are the annualized returns and Sharpe ratios pre-COVID:

The magic 21/200 lookbacks look legit. However, the post-COVID picture looks different:

The magic parameters don’t quite figure in the top 5. However, even if you used the data-mined set, you would be ok?

Also, the paper used a “sigma” parameter as a threshold to activate the crossover. Getting rid of it seemed to have lopped 10% off the post-COVID returns.

You can follow along the live version of the original strategy here: MAD 21/200

Code and charts on github.