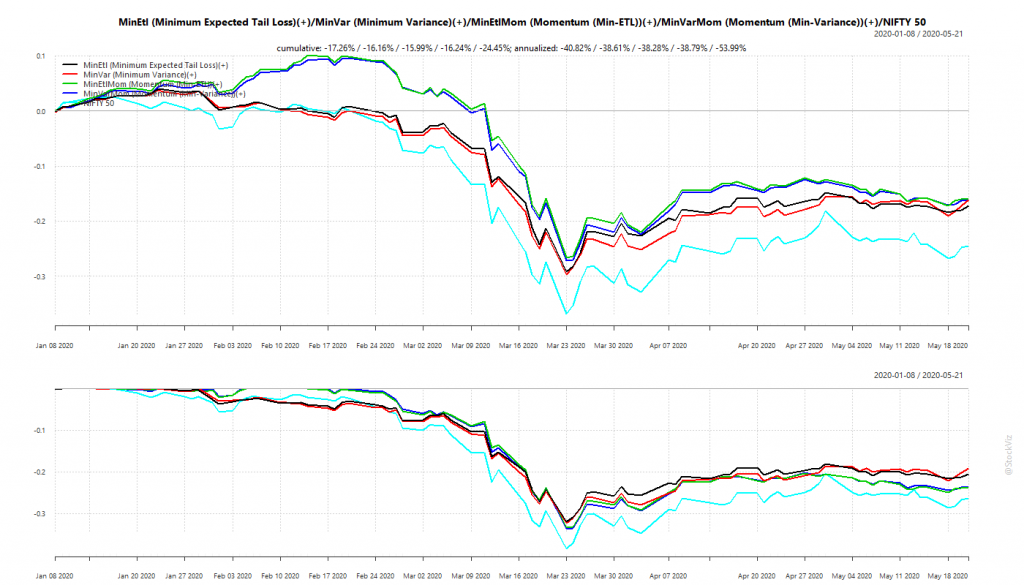
We had discussed portfolios optimized for minimum volatility back in January (see: Low Volatility: Stock vs. Portfolio) and had setup Themes that track such strategies. Broadly, these fall into ETL (Expected Tail Loss) and Min-Var (Minimum Variance) optimized portfolios that either take in the entire universe of stocks or only those that have a high momentum score. So, we have Minimum Expected Tail Loss, Minimum Variance, Momentum (Min-ETL) and Momentum (Min-Variance).
We expect optimized portfolios of momentum stocks to perform better during market up-trends. During bears, we expect them to have lower drawdowns than the market. The Corona Virus Panic put these portfolios in through the wringer. Glad to report that they came out largely unscathed.
Minimum Volatility Portfolios vs. NIFTY 50
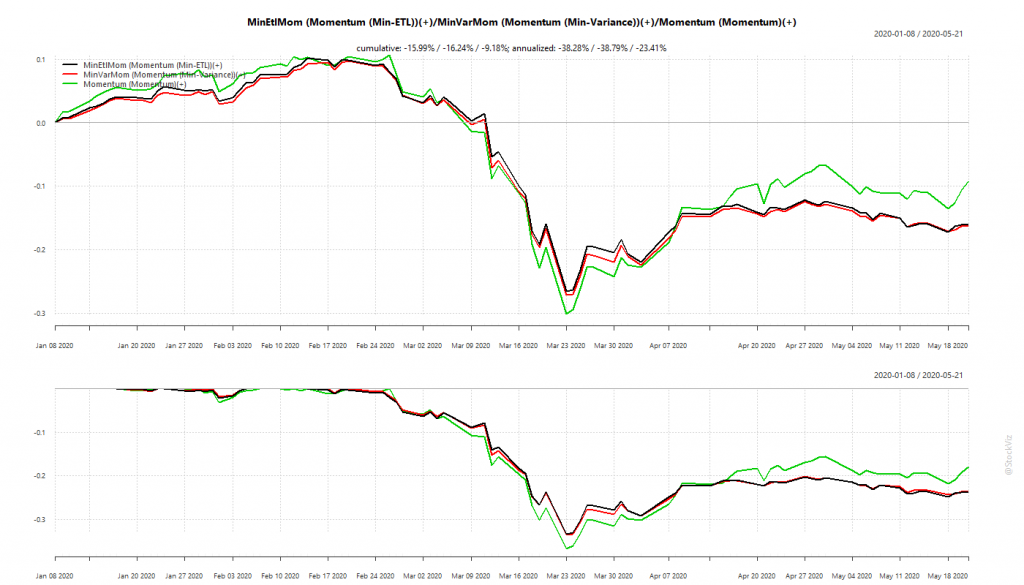
Our back-tests showed that optimized momentum portfolio would under-perform “raw” momentum during up-trends but should have lower drawdowns during down-trends.
Momentum: Optimized vs. raw
Optimized momentum portfolios saved the investor about 3-4% in drawdowns compared to the “raw” momentum portfolio. May not sound like much in this instance but think about the cumulative effect over multiple market corrections when you invest for the long-term.
Overall, optimized portfolios delivered what they promised.
WhatsApp us at +91-80-26650232 if you are interested in knowing more about these strategies.
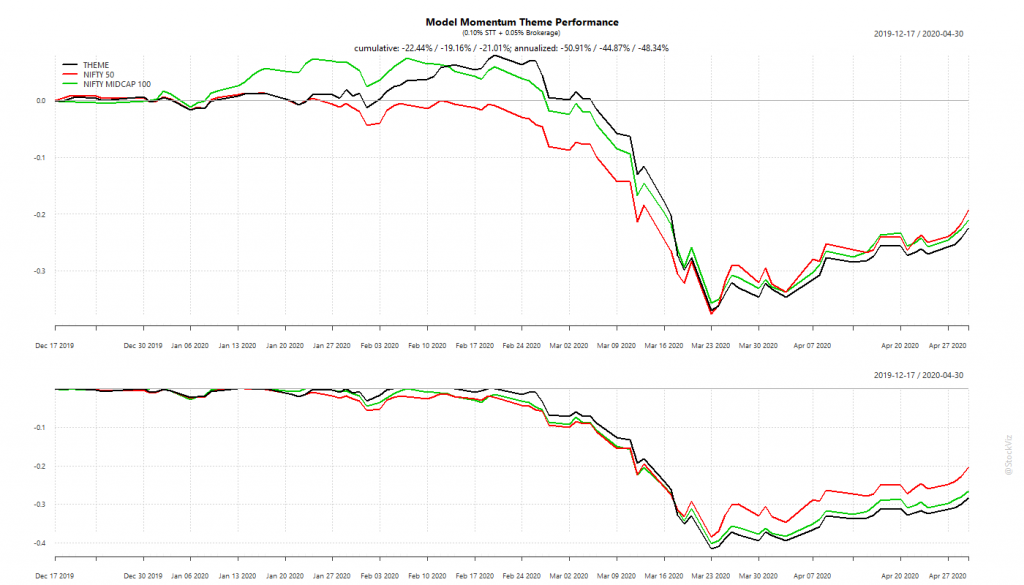
Last Decemeber, we had presented a back-test of a factor rotation strategy that would go long the factor portfolio that performed best over a look back period. The Themes based on this backtest have finally completed 90 days in the market. Here’s a quick update on their performance.
Indian Factor Momentum
We went with two flavors here. One that went long a portfolio of stocks in NSE’s strategy indices – Factor Momentum (Indices) – and another that went long one of our factor portfolios – Factor Momentum (Themes).
Factor Momentum (Indices)
Factor Momentum (Indices) performance after brokerage and STT
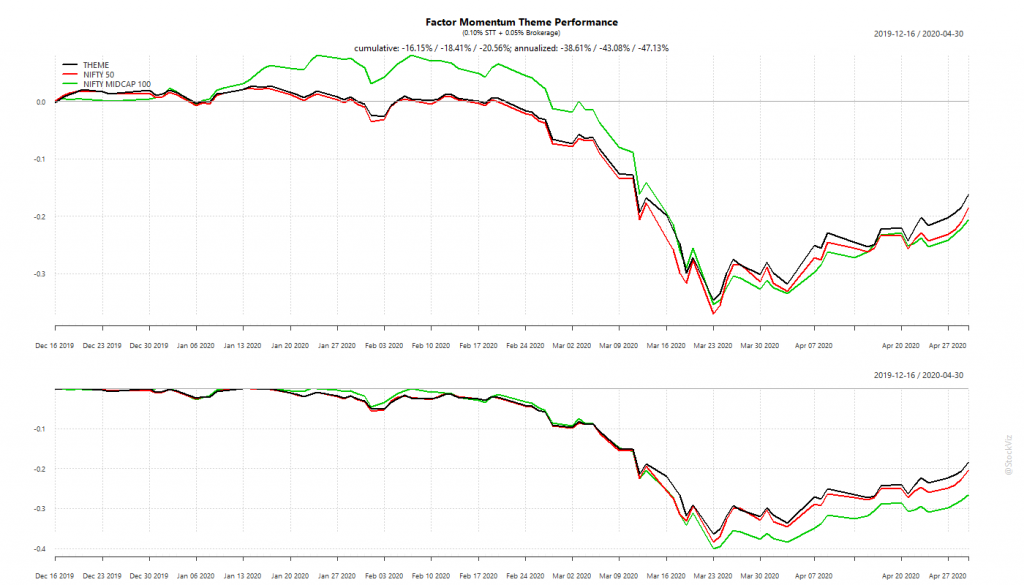
Factor Momentum (Themes)
Factor Momentum (Themes) performance after brokerage and STT
Thoughts on Performance
Both portfolios crashed as much as the large and midcap indices during the Corona Virus Panic. However, it appears that the recovery from the crash has been lead the Index variant. For a while, it did look like the Theme variant out-performed the indices but it may have been because of the randomness introduced by the smaller number of stocks in the portfolio.
US Factor Momentum
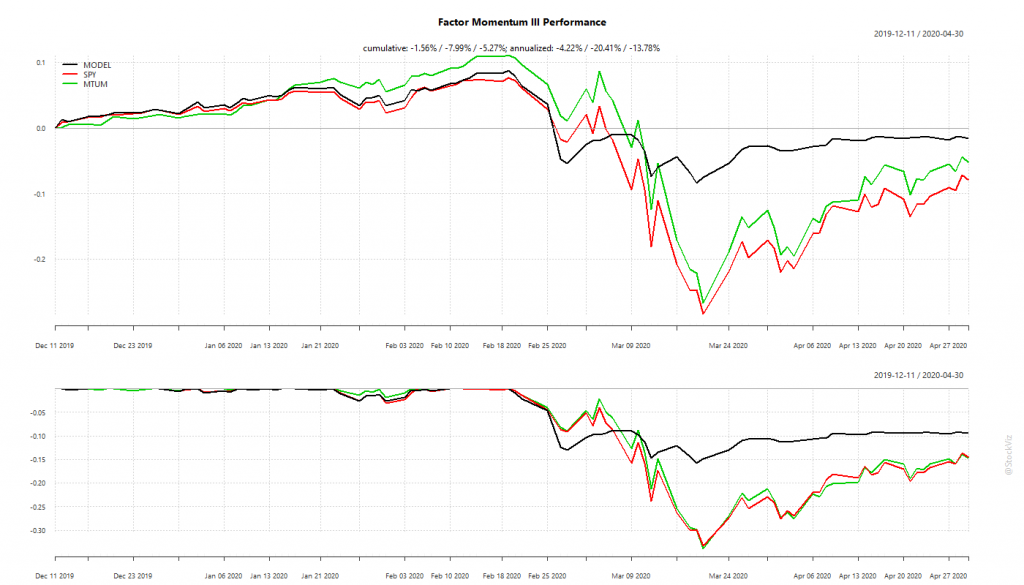
Factor Momentum III
The US context is wildly different from India. With brokerage costs at zero and with the ability to trade fractional shares, the portfolio can be efficiently rebalanced with a one-month look-back (Factor Momentum III.) Given the steepness of the fall during the Corona Virus Panic, the shorter lookback helped it quickly adjust to the market and keep drawdowns to less than 10% compared to SPY’s 30%+
WhatsApp us at +91-80-26650232 if you are interested in knowing more about these strategies.
We often hear about portfolio hedging – how you can short NIFTY futures or buy puts – to reduce portfolio losses. The chapter, Hedging with Futures on Varsity, is a good introduction to the mechanics involved. However, real life involves tradeoffs.
How much to hedge?
This one is pretty straightforward. A fully hedged portfolio means that your total returns are driven purely by excess returns. Given that excess returns are typically not more than 5%, it may not make sense for most investors. So, most do a partial hedge. And a partial hedge means that when volatility strikes, you are still exposed to downside risks.
The other problem with hedges is that most investors think of risk in terms of absolute draw-downs (not volatility.) i.e., “My portfolio is down 15%,” not “My portfolio lost half of what the market lost.” So hedging first requires a change in how investors perceive risk.
Portfolio betas are not invariant
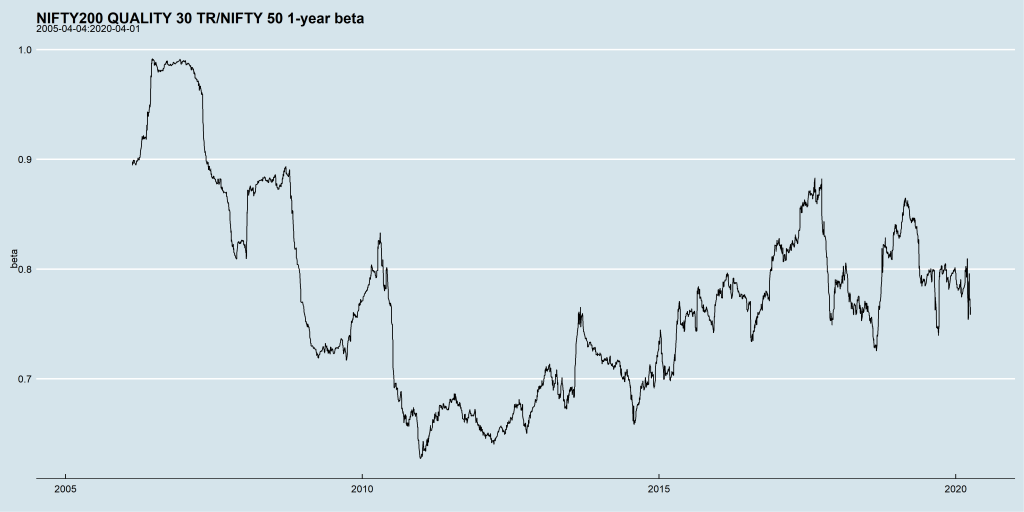
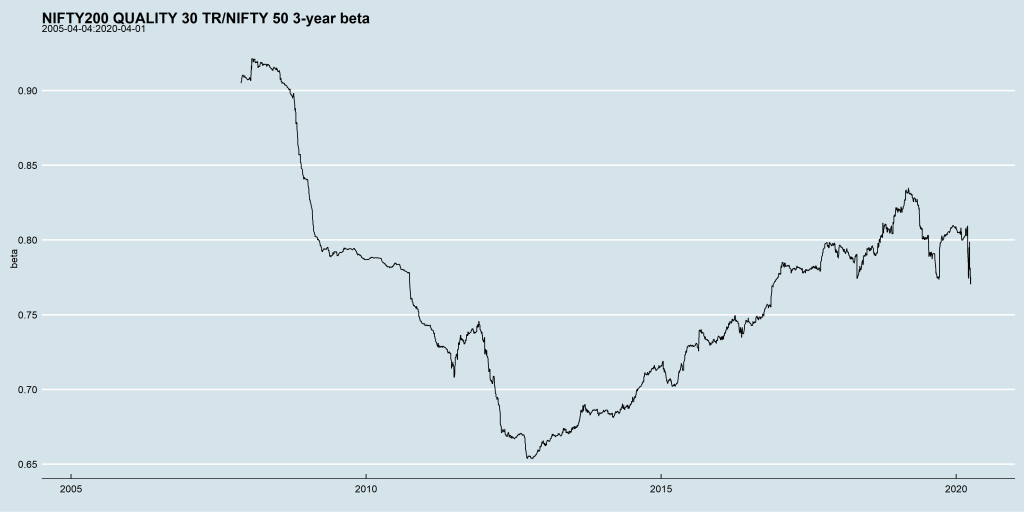
Suppose you want to be long quality stocks but want to hedge part of the portfolio by shorting the NIFTY, then how do you go about calculating the portfolio’s beta? Your assumptions of the risk-free rate and the look-back period will greatly influence the final value. Also, beta is not a static number that you can assume and keep unchanged through time.
1-year beta3-year beta
Hedging costs increase with volatility
Volatility is huge part of derivative pricing. When you trade futures, you have to post margin to your broker and options have an implied volatility baked into their premiums. So irrespective of how you choose to hedge your portfolio, you will find that when volatility arrives, hedging costs increase.
For example, the margin requirement for a single lot of NIFTY futures in late December was roughly Rs. 1,05,000/- With NIFTY ~12,100, that is roughly 11.5% of notional. But now, because of the virus induced spike in volatility, the margin requirement has gone up to about Rs. 1,50,000/- with NIFTY ~8250, or 24.25% of notional.
So, when you want your portfolio to be hedged the most, the cost of doing so has more than doubled. To fund this, you now have to choose between reducing the hedge ratio (and taking on more market risk) and liquidating the long-side of the portfolio to the extent of the deficit (while selling in a down market.)
Take-away
There are no simple answers and each investor needs to arrive at these trade-offs based on their risk perception and tolerance.
The first part of this series discussed how SMA strategies can help manage draw-down risk while investing in indices. However, index investing doesn’t cover the whole breadth of strategies that investors typically run. Managing risk in a portfolio of stocks is quite different from managing risk on an index as a whole. One of the most basic strategies one can employ on a portfolio is that of a trailing stop loss on component stocks.
Trailing Stop Loss
In a TSL, a high watermark is tracked from the purchase price and an exit is triggered if the price falls below a certain percentage from it. You can read more about the mechanics here.
Some of the things that need to be thought through when using a TSL on a portfolio of stocks:
What is the exit criteria? Should it be 5%, 10%… 15%? If you set it to low then you end up trading a lot; too high, and it may not make a difference.
What is the re-entry criteria? Suppose you exit a stock today but it still checks all the boxes for inclusion in the portfolio, will you re-purchase it tomorrow?
Are you going to replace an exited stock with another one that fits the inclusion criteria or are you going to hold cash?
A TSL only considers price to decide on an exit. So the most obvious place to apply it is in momentum portfolios.
Momentum
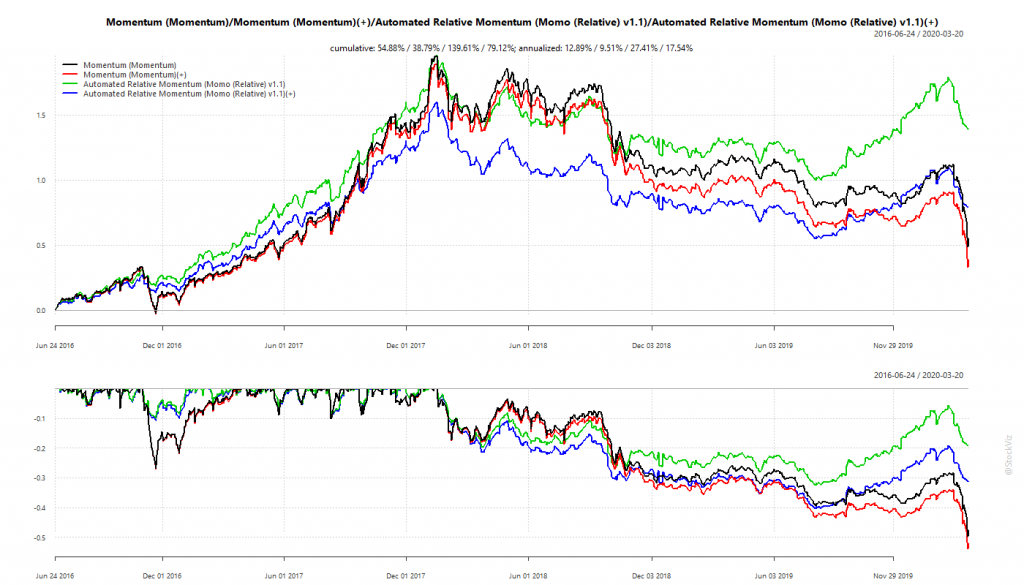
Momentum stocks are prone to cliff risk. Back in 2016, we setup a momentum portfolio that has a 5% TSL on each of its components to see if we can reduce the severity of drawdowns of our more basic Momentum strategy. We called it Momo 1.1. Here are the cumulative returns and drawdowns of Static and Momo strategies, with and without considering transaction costs:
Momentum: Static vs. Momo
The red line is Static Momentum and the blue line is the Momo version of it, after considering an STT of 0.1% and brokerage of 0.05%.
As you can see, the after-cost returns of Momo trailed that of Static’s for quite some time. If you are a regular investor who has to pay capital gains tax (not someone who’s main business is stock trading,) then it is really painful to watch most of the notional gains evaporate into taxes.
This is because Risk Management Is Not Free. It involves trading off near-term profit to reduce potential risk in the future.
It took the sudden plunge in equities this year to bring out the value of having a risk-management process in place. The after-cost, annualized returns of Momo, since late June 2016, comes in at 17.54% while that of Static’s is at 9.5%. Moreover, because of the dynamic nature of Momo, it is currently 75% in cash, while Static is 100% in stocks.
Momo on US stocks
In early 2018, we ported the Momo strategy discussed above to US stocks.
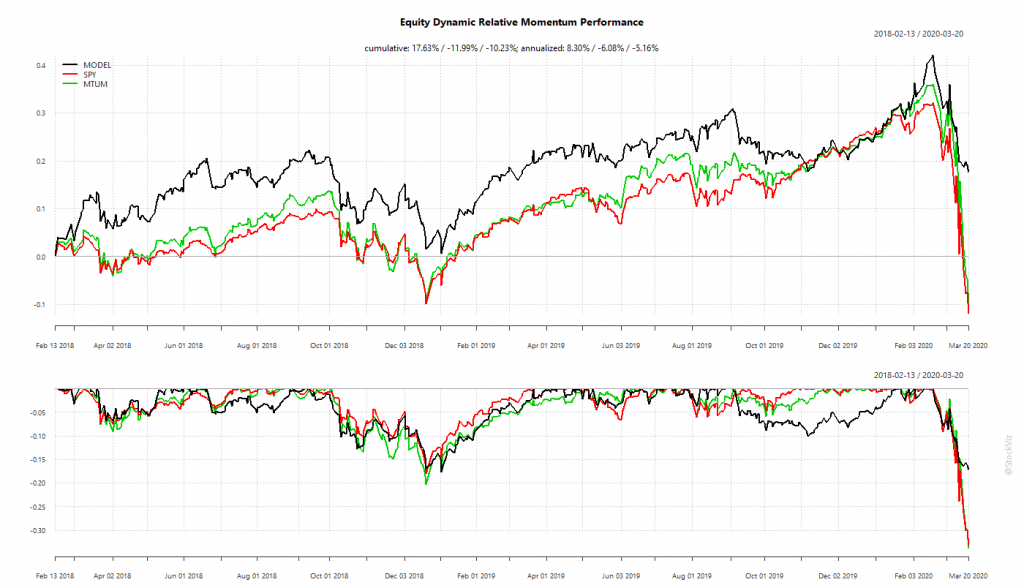
Momo: US stocks
Once again, we see trailing stop losses saving our hides and, more importantly, preserving our returns. Momo comes in at an annualized 8.30% vs. S&P 500’s -6.08% during the same period. Its portfolio is currently 75% in cash. At zero brokerage and no STT in the US, you pretty much get to eat all of those returns.
Investment Horizon
When we looked at the performance of Momo back in May 2019, we had concluded that, maybe, investors were better off with the Static version (see Part I, Part II.) We had traced the subsequent performance of stocks that were thrown out because of a stop loss and had found that:
During the bull phase, when the whole market was shooting higher, stop-lossed positions recovered from their losses.
During the bear phase, it does look like stop-losses helped – the subsequent returns of stop-lossed positions were skewed left.
However, in aggregate, they did not add value after taking costs into account.
It boils down to the kind of risk you are trying to avoid and the time-horizon involved. If we were to add subsequent performance of these strategies to the above data-set, we may have reached a different conclusion.
Take-away
Risk management is not free. You pay upfront to mitigate risks in the future that may not befall.
It is not always obvious if the risk management strategy is “working” and whether is is “worth it.”
It makes sense to add a trailing stop loss to the components of a momentum portfolio given the high cliff risk of the strategy. However, the timing of these cliffs cannot be predicted.
Taxes form a large chunk of costs when using a TSL based risk-management strategy.
Now that we are in the middle of a massive virus induced selloff, investors are once again interested in risk management. Similar to how flood insurance is mostly bought after a flood, investors end up paying a hefty premium for fighting the last war. Our experience with offering strategies that try to manage downside risk has been that investors flock to it after a drawdown, only to get disappointed by its returns once the market recovers and getting rid of it right before the next one. Rinse, Repeat.
Risk management is not free
No matter how you hedge your risk (buying options, sell futures, trend-following,) it costs money. There is no system where risk management makes the investor money. So, by definition, hedged investment returns will trail buy-and-hold for long periods of time.
Drawdowns and Returns are sides of the same coin
Equity risk premium exists because of tail-risk that cannot be modeled.
Nothing “normal” about it!
No matter what your time-horizon, there are always periods when you will be deeply in a hole.
Hedging instruments are not perpetual
Equities are perpetual but hedging instruments like futures and options have definite terms. They have their own peculiarities based on risk that is already being priced in vs. true tails.
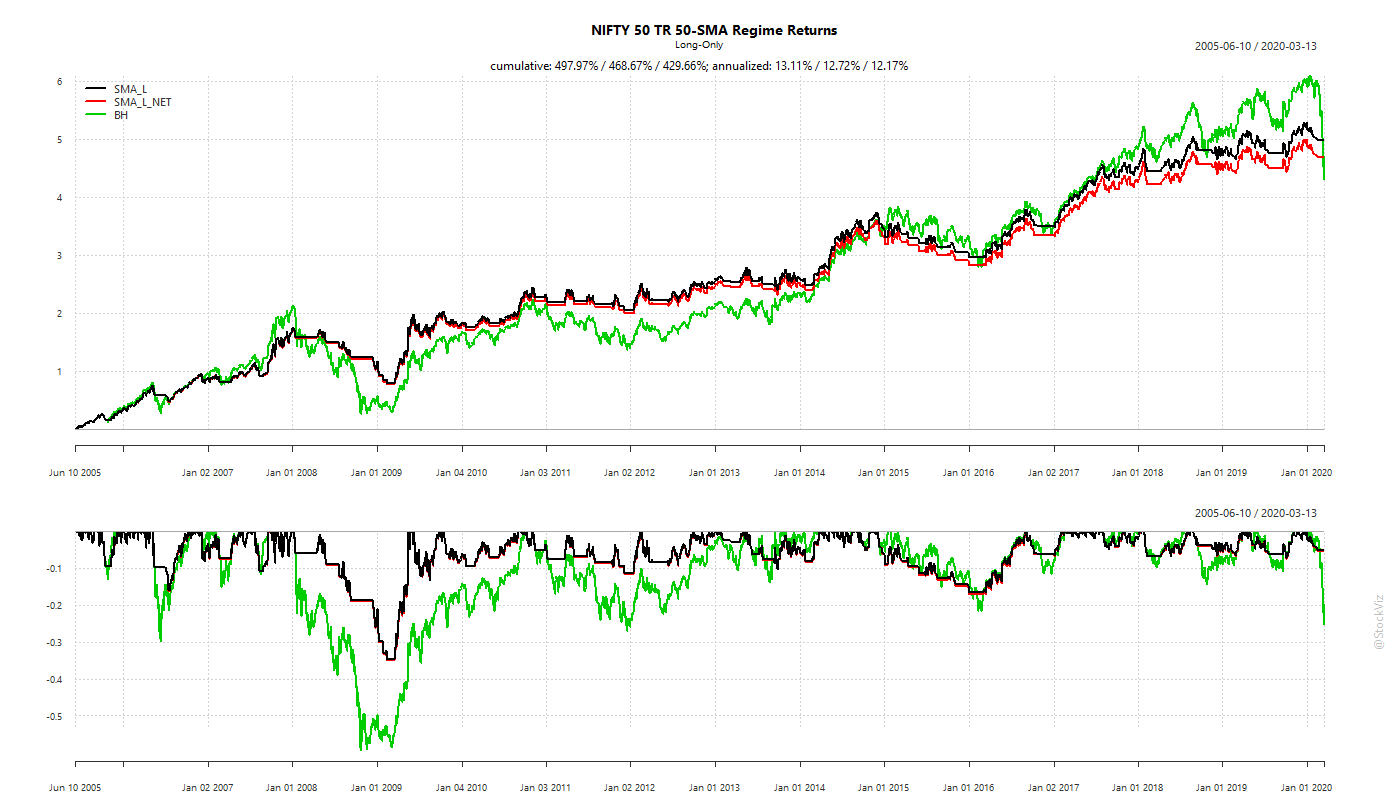
Simple Moving Averages can help
Being long an index only when it above an SMA is one way to overcome the problems highlighted above. It doesn’t involve hedging instruments, so you don’t have to worry about derivative pricing, expiry, etc. The odds are in your favor in terms of the trend being your friend.
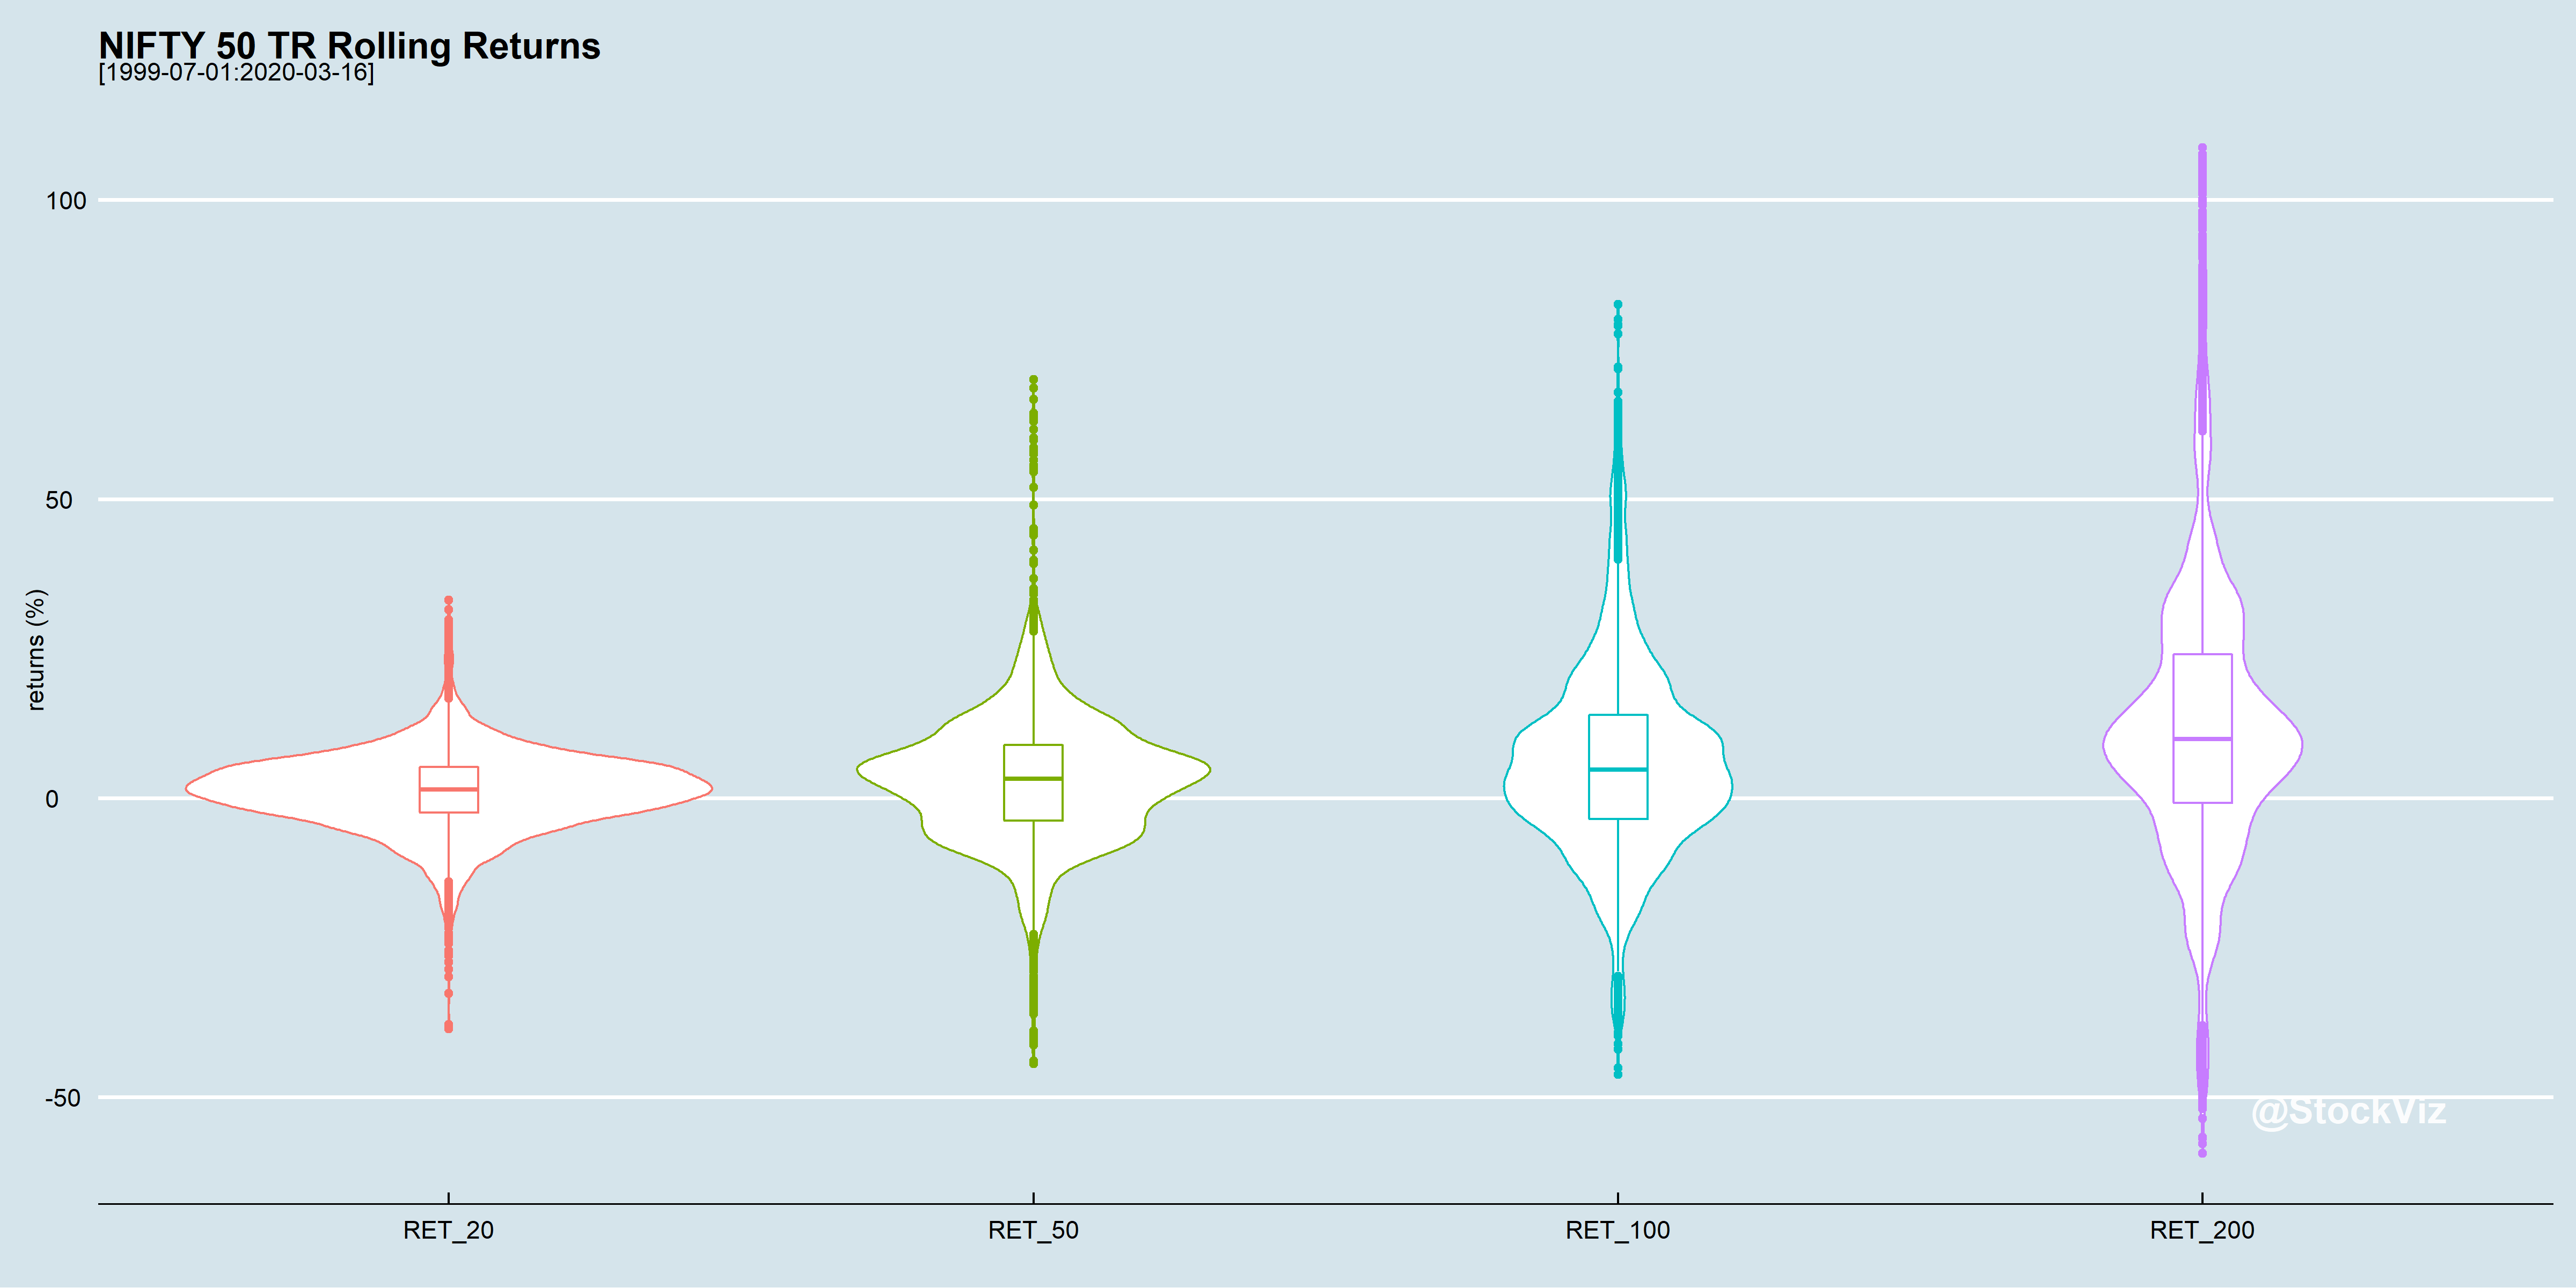
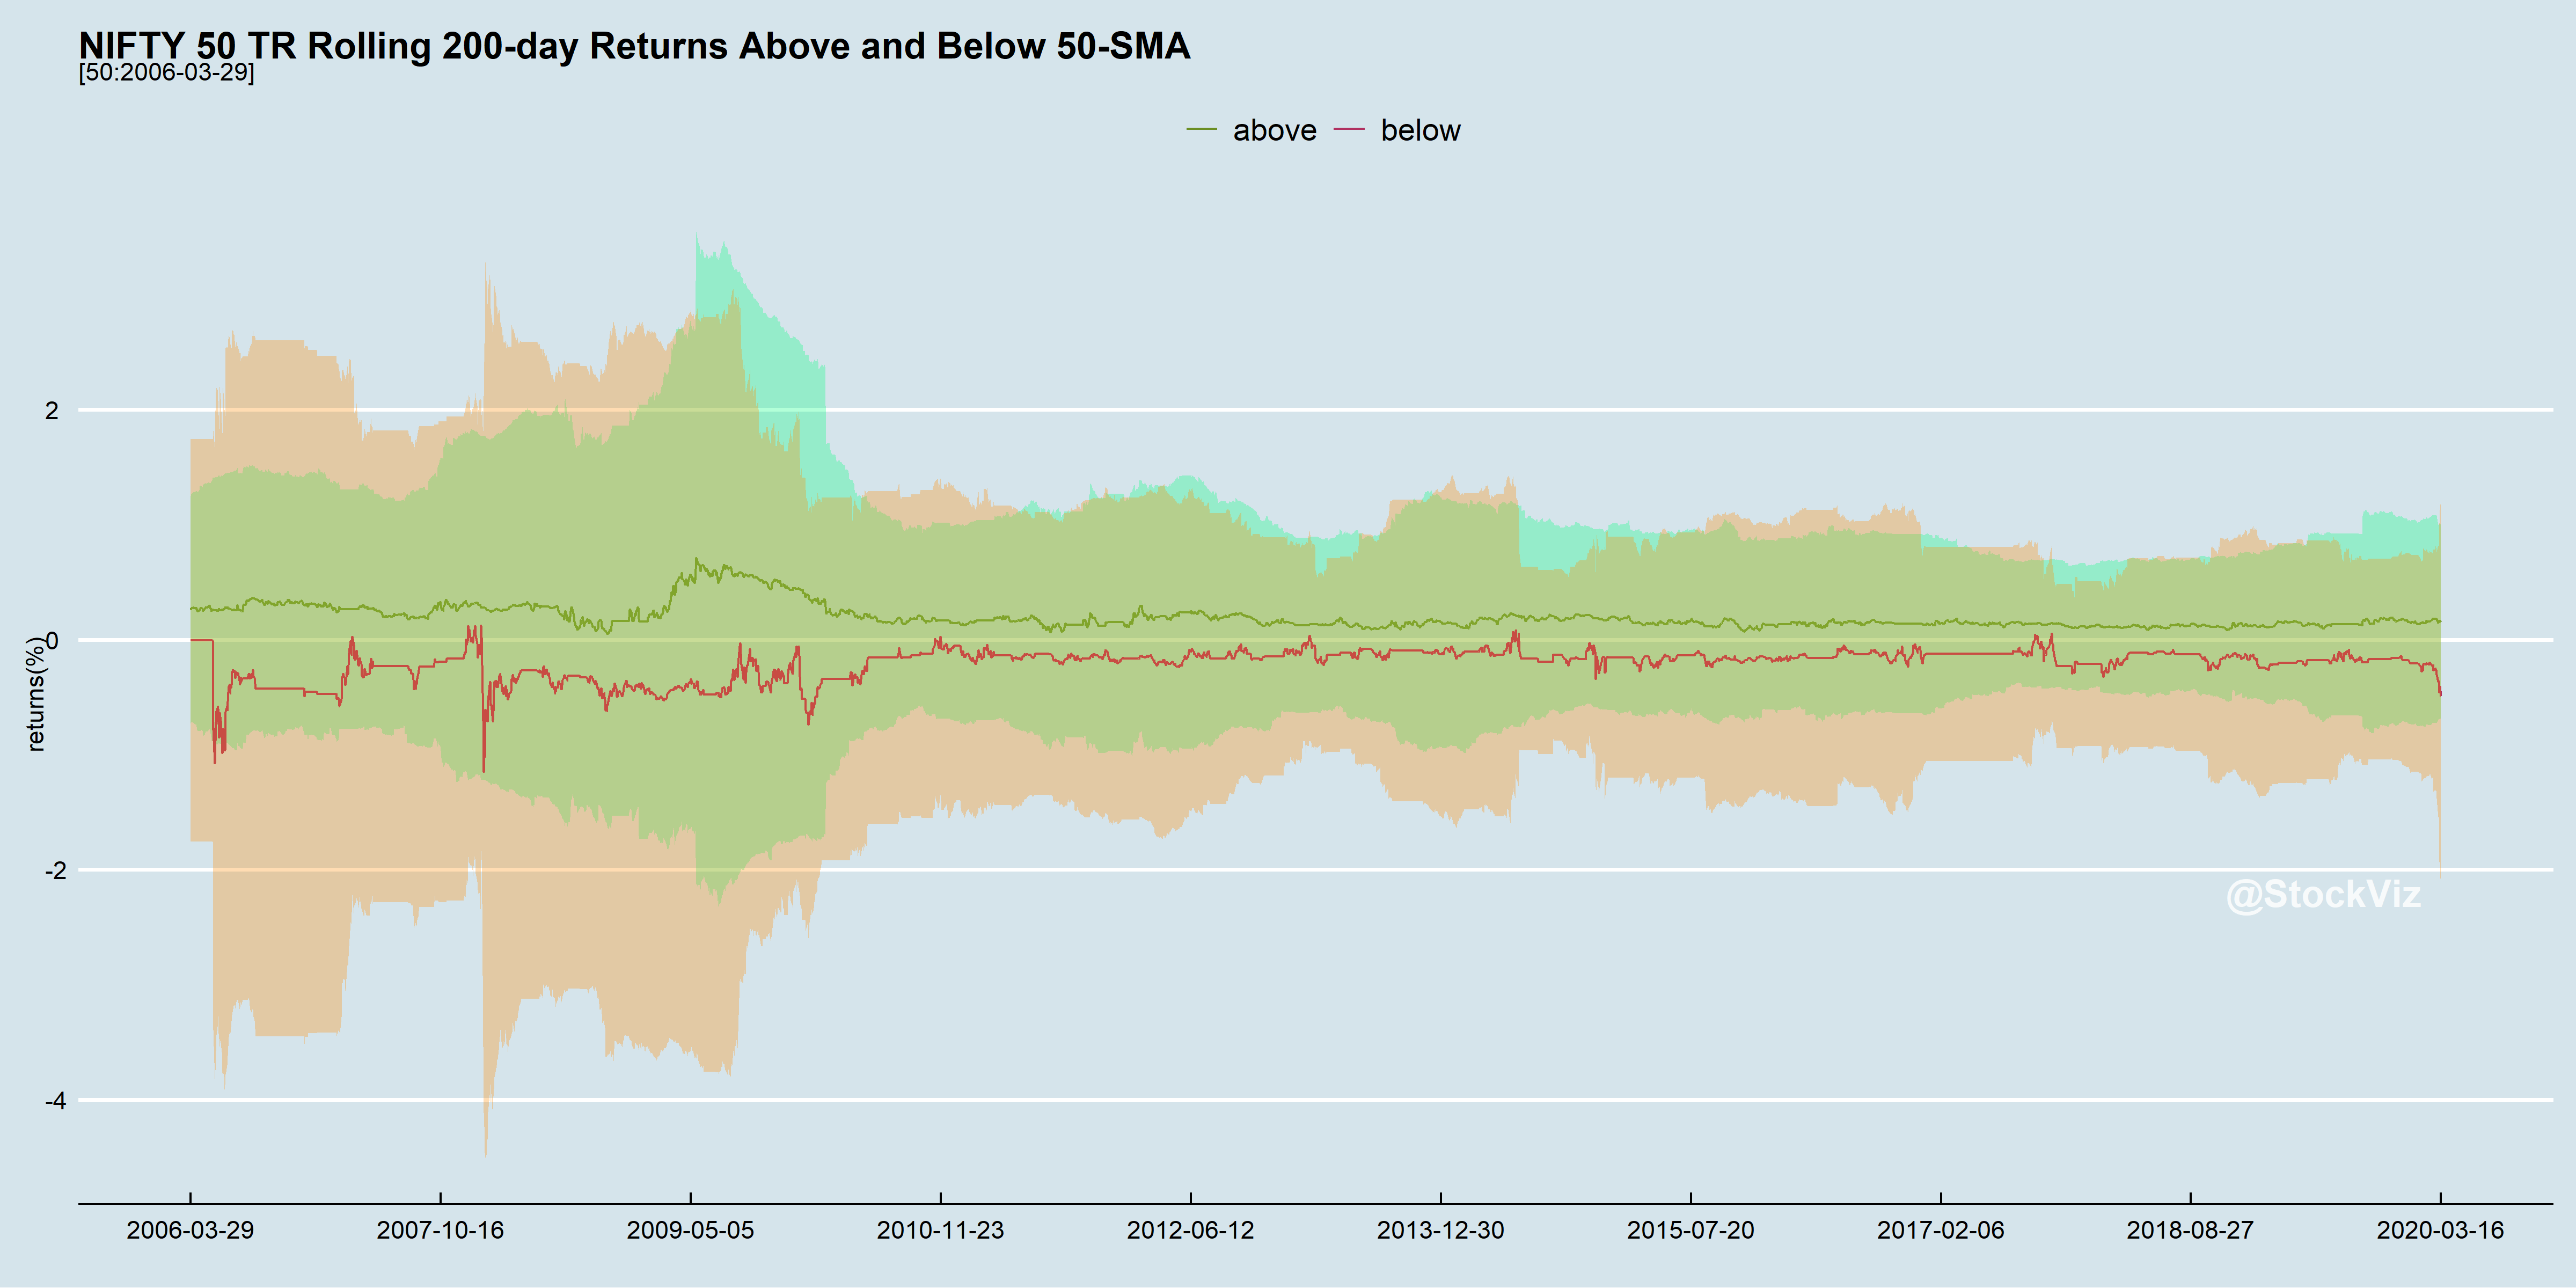
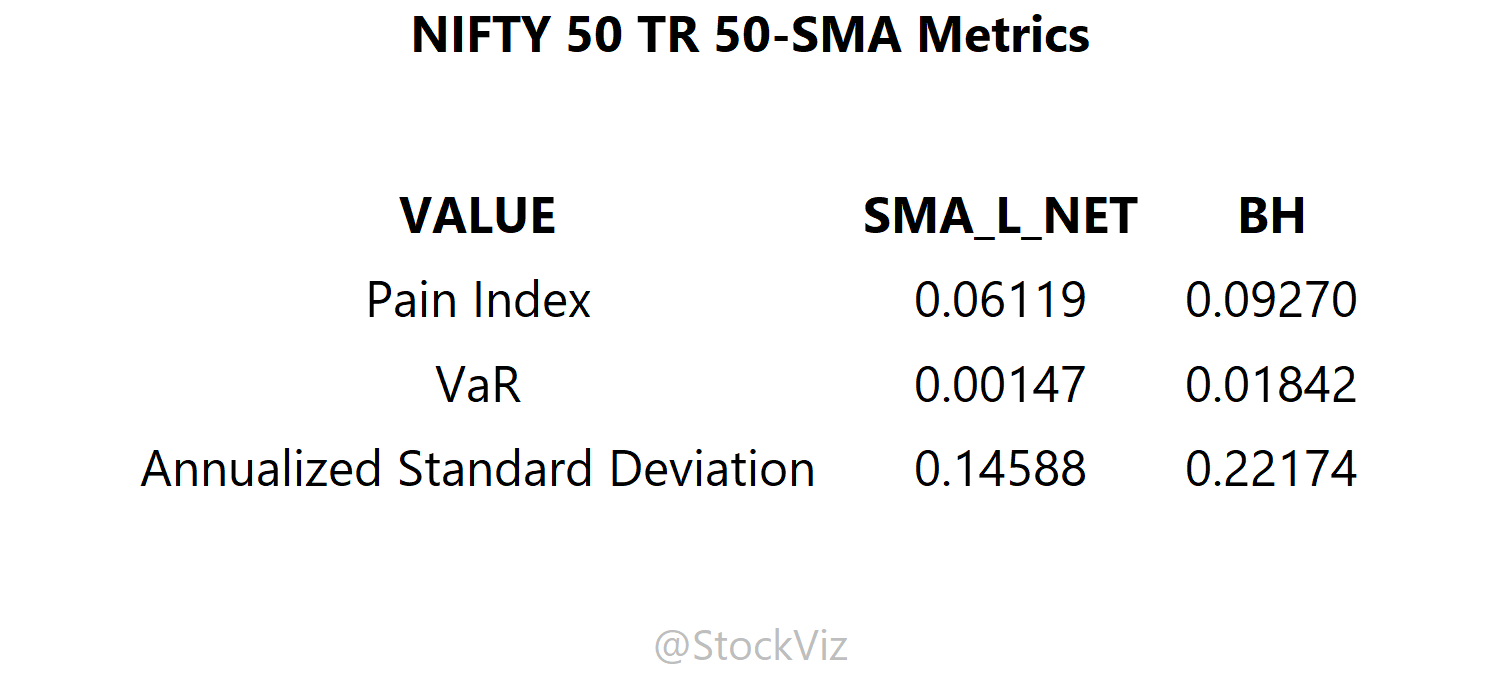
On average, it pays to be long only when the NIFTY is above its 50-day SMA
Most of the large daily moves occur when the index is below the SMA. Higher volatility is not necessarily bad if the drift is higher. But most investors rather sit out the volatility than dive in get their guts punched.
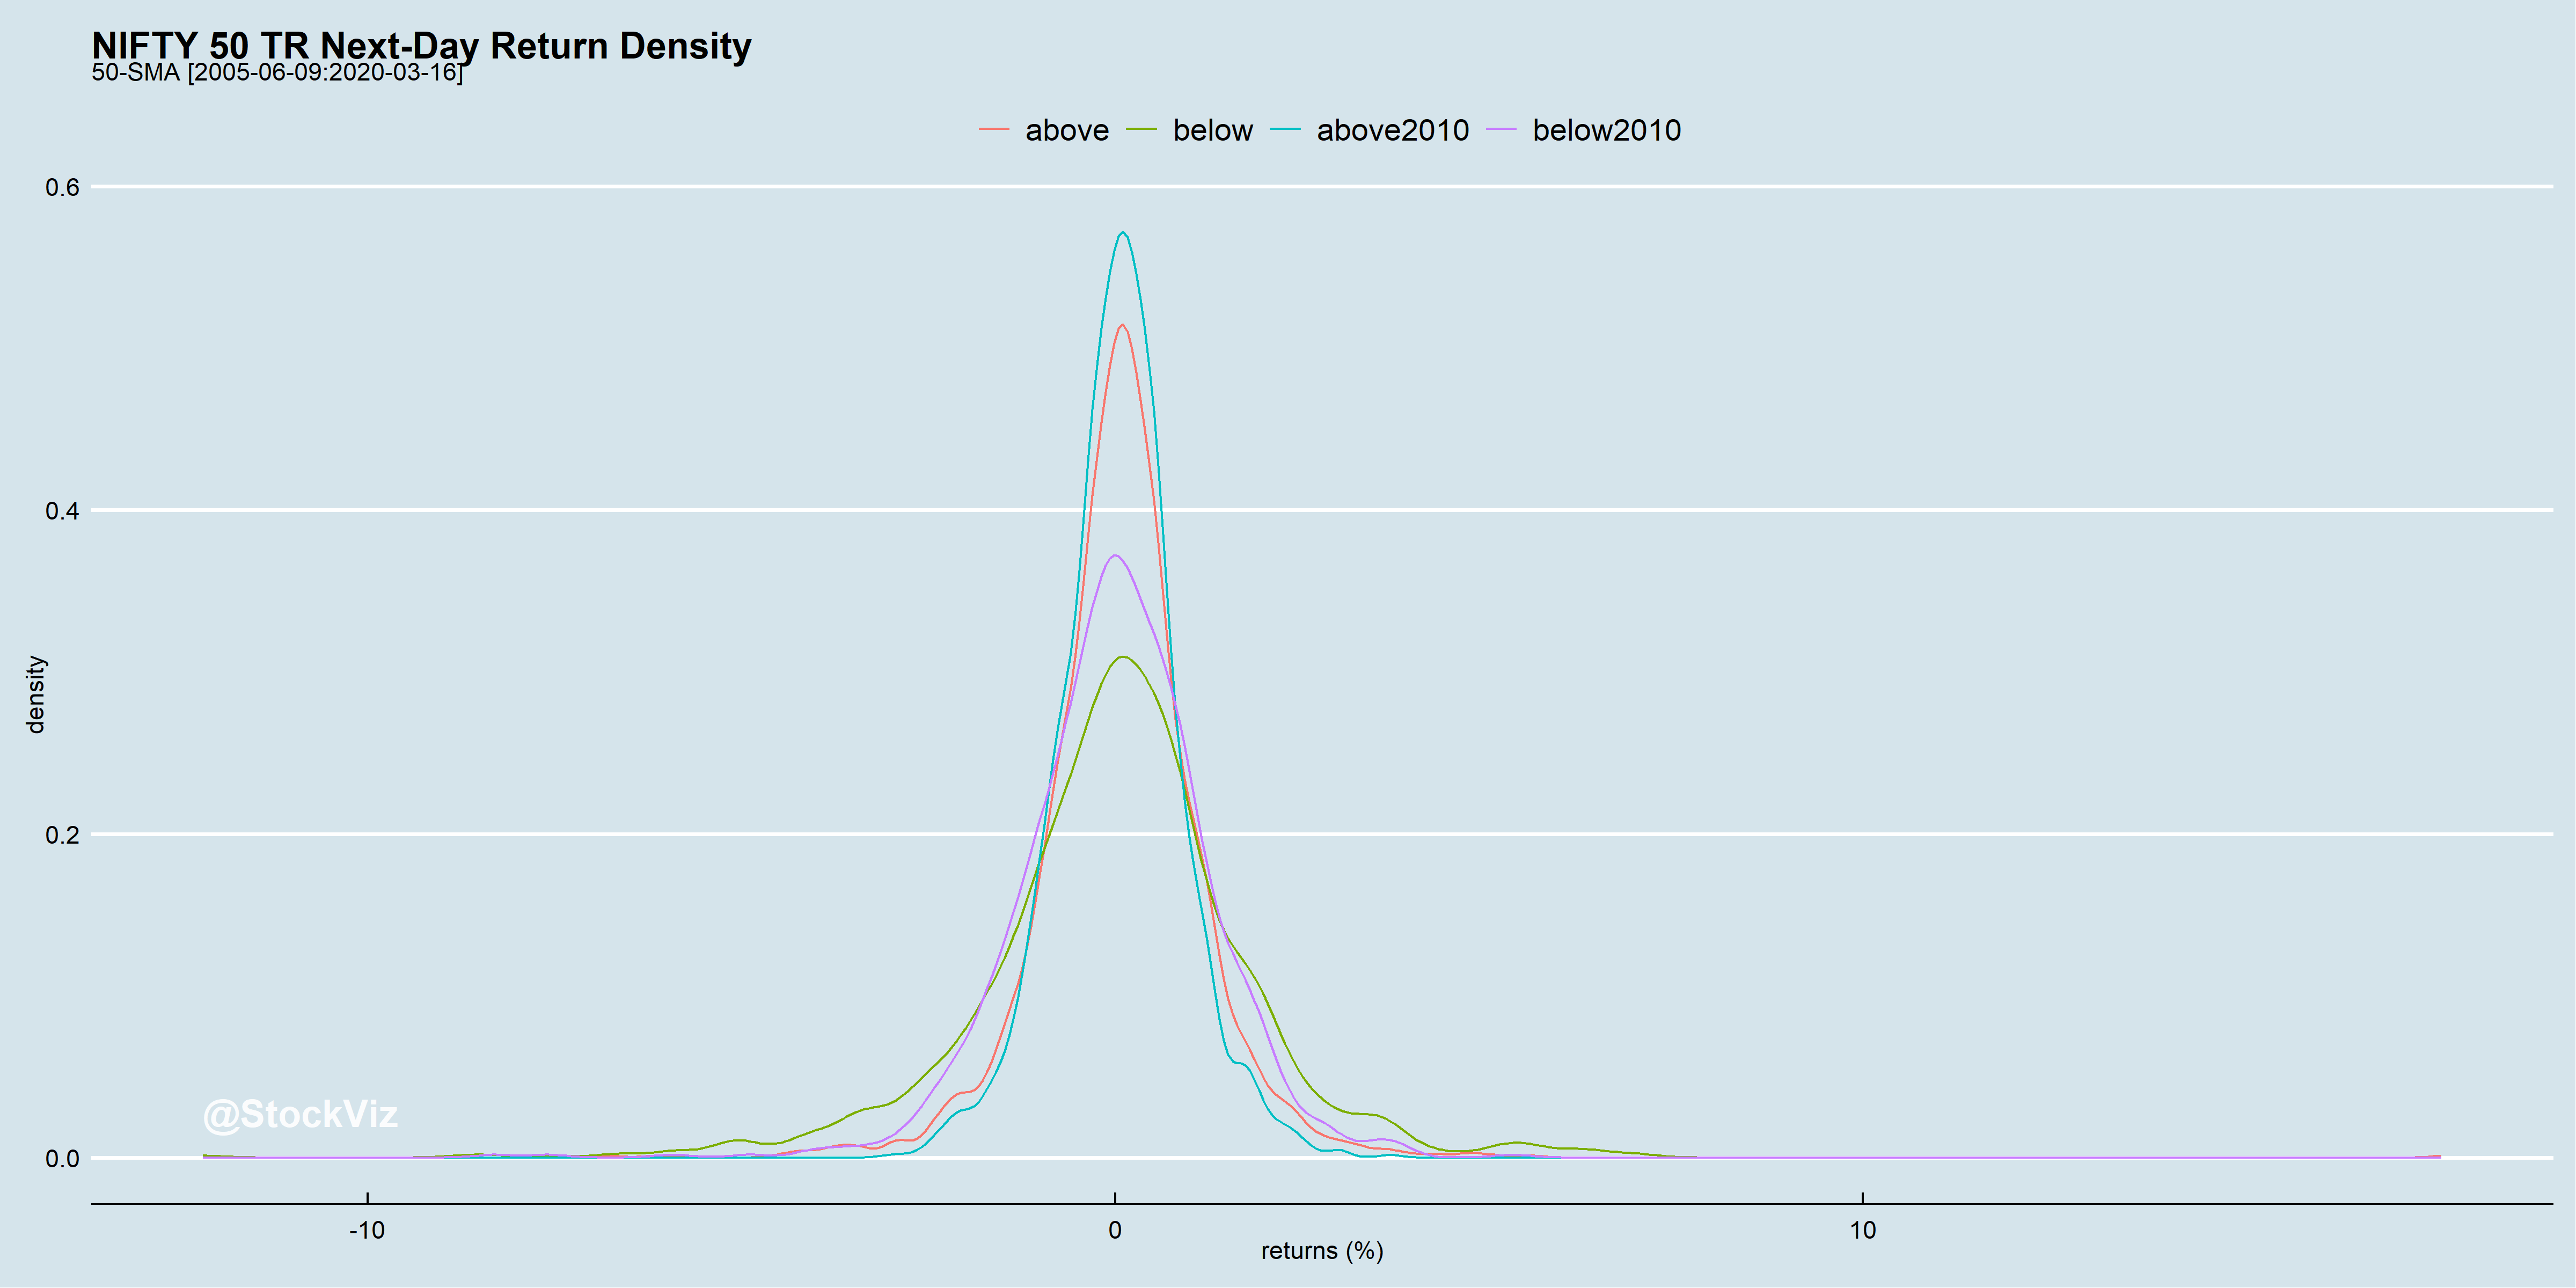
Next-day returns under different SMA “regimes”
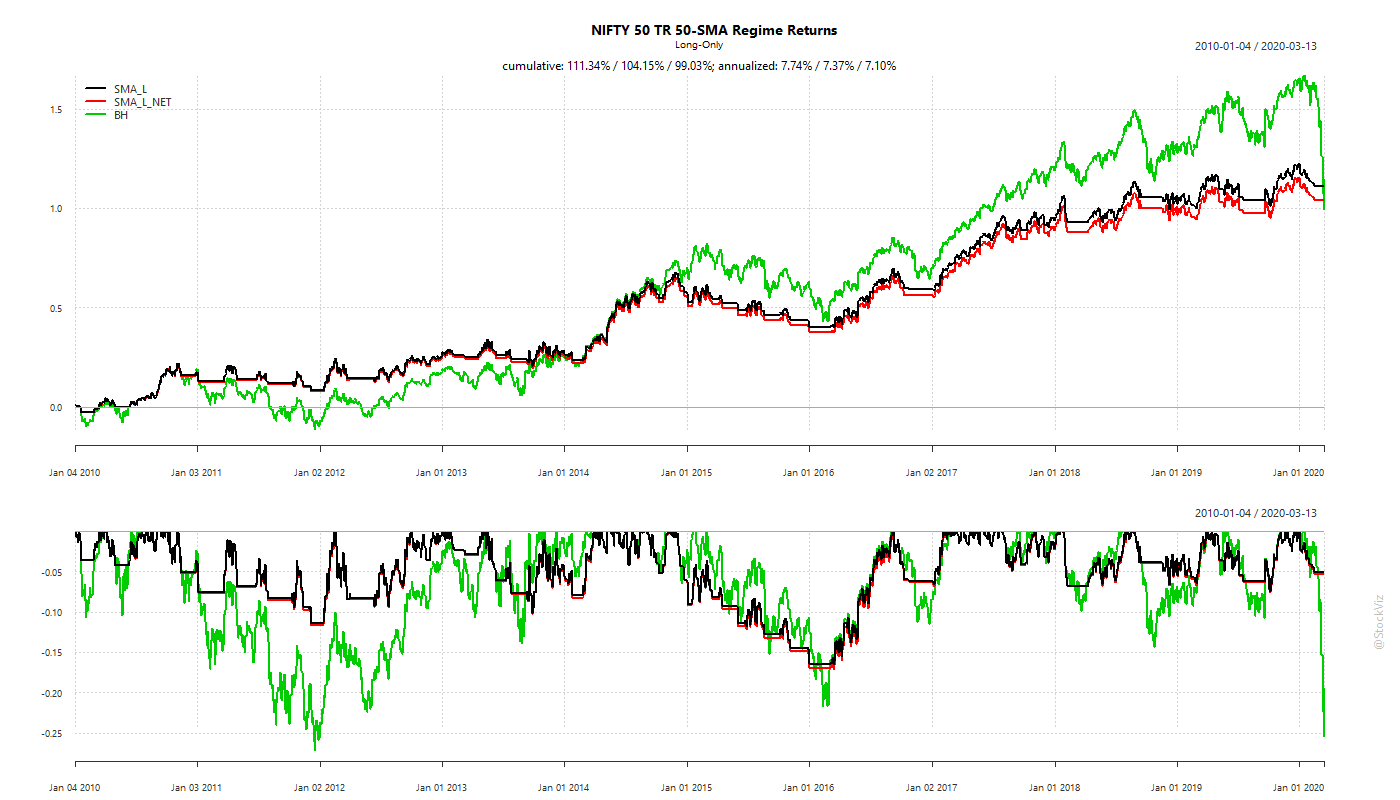
What would returns look like if you were long only when the index traded above its SMA? It really depends on your time horizon.
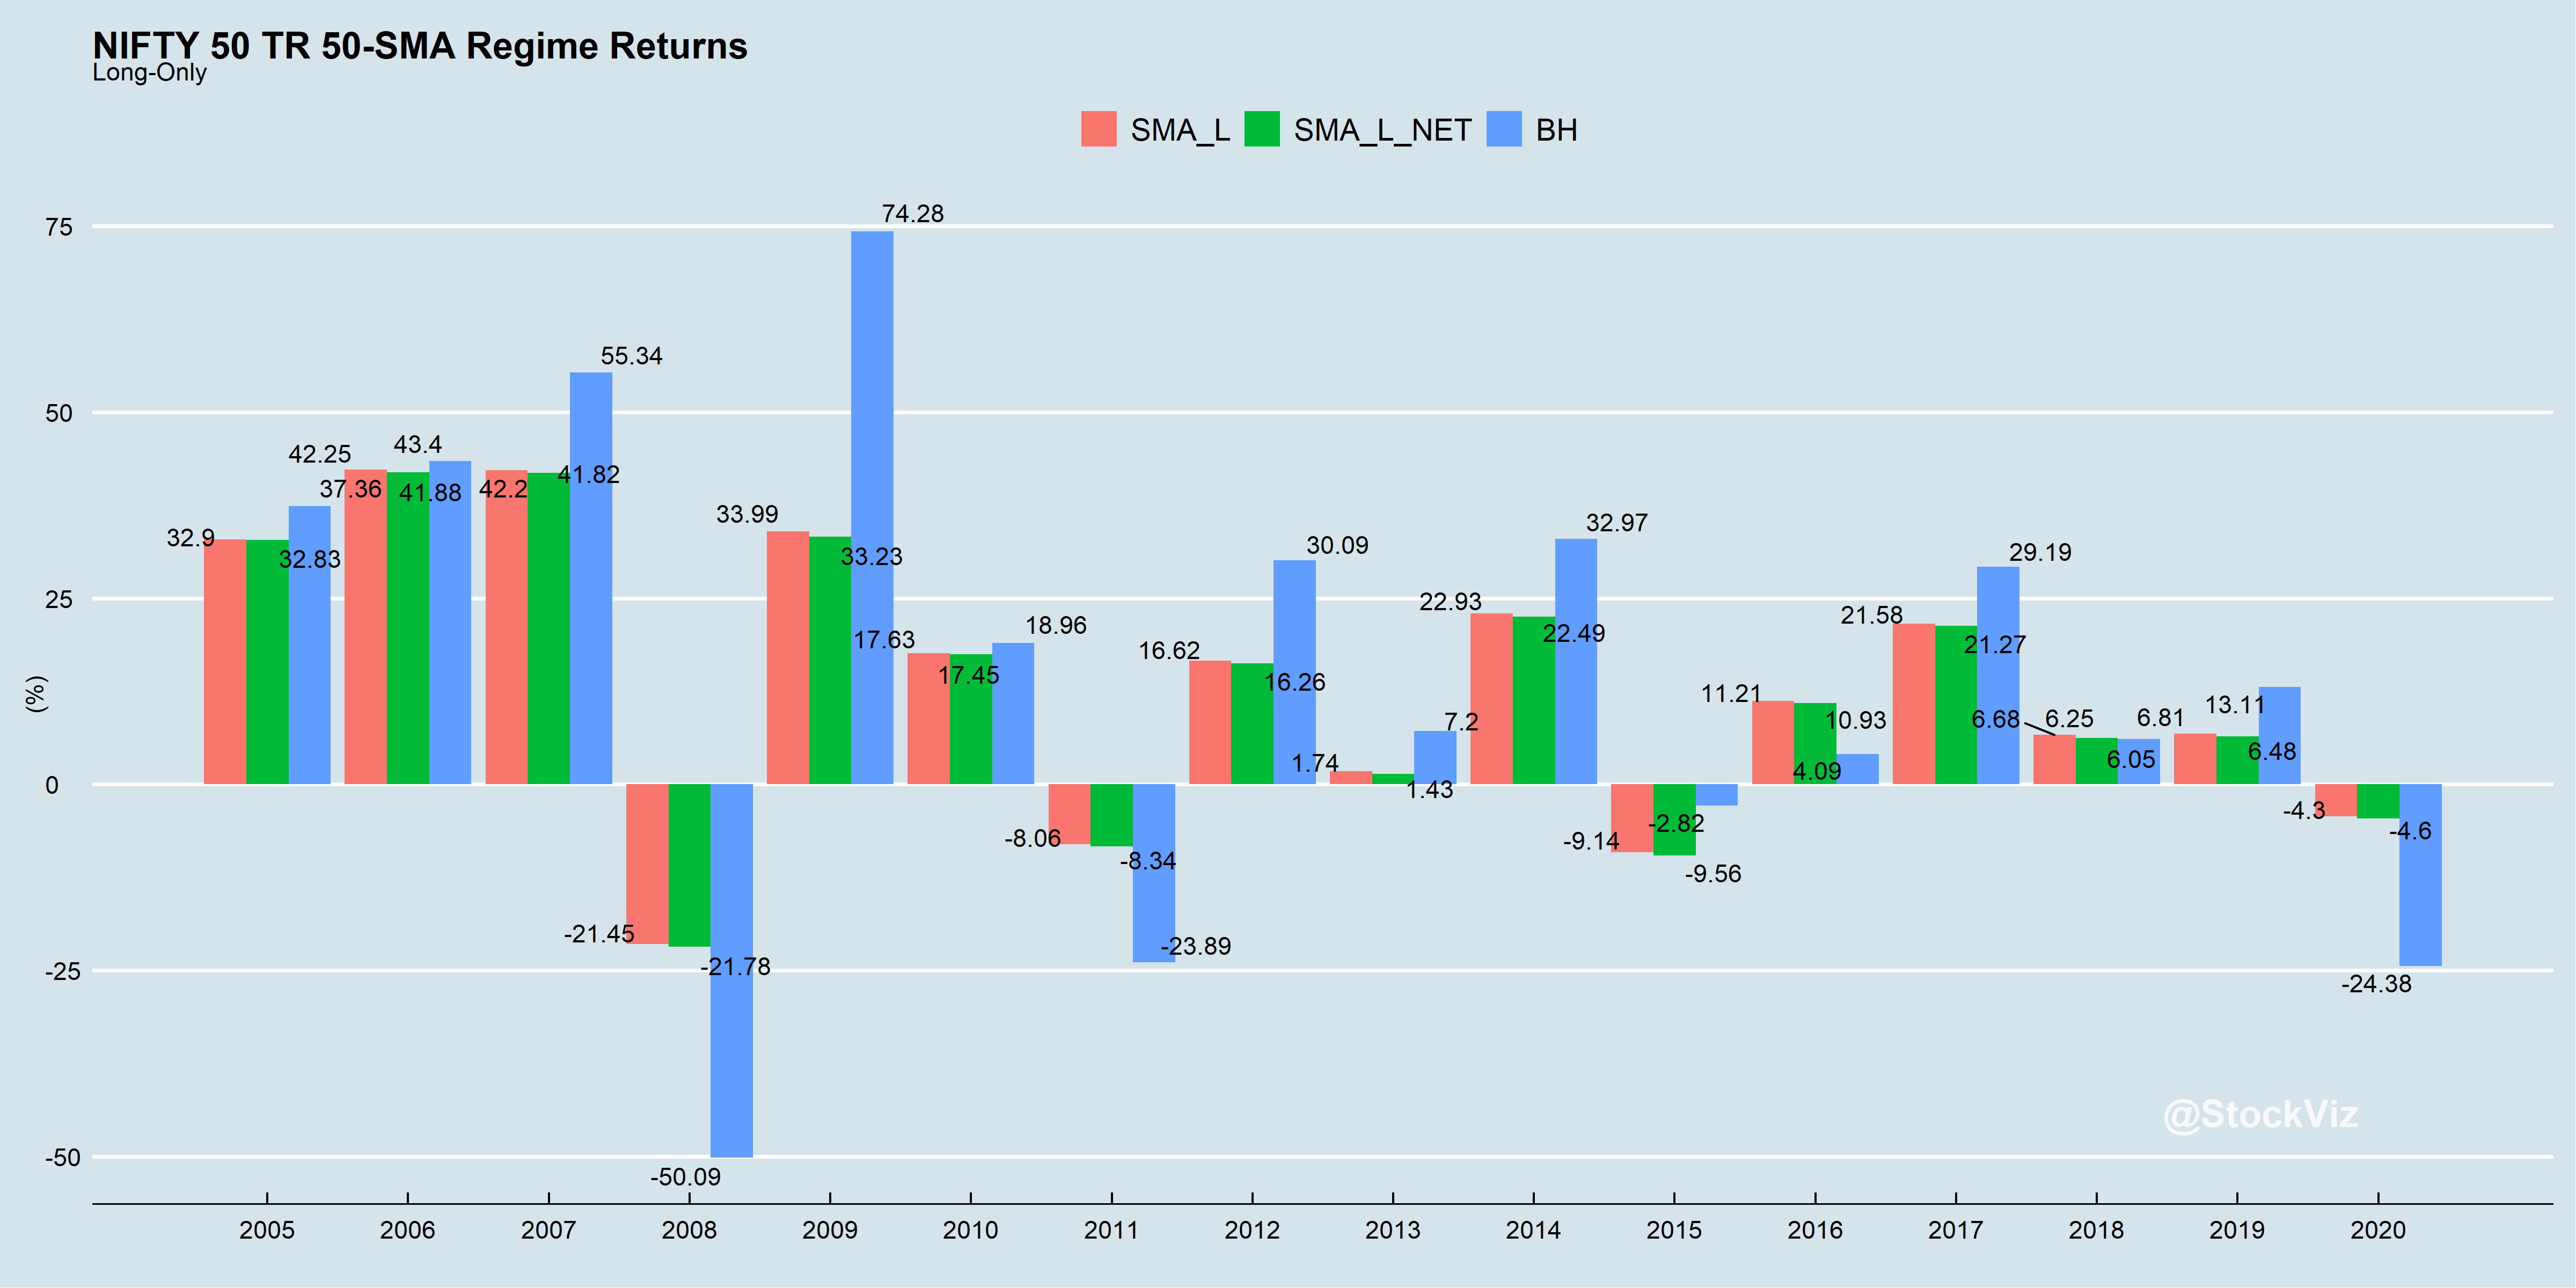
Including the 2008 GFCExcluding 2008 and subsequent recoveryAnnual returnsGet ready to be whip-lashedTrade-off between lower volatility and higher costs/gross returns.
Problems
When it comes to avoiding drawdowns, you win some, you lose some.
Transaction costs matter. The above was modeled using an STT of 0.001% and slippage of 0.05% on the sell side. And capital gains taxes have been ignored.
Trading this using ETFs would be sub-optimal. So it is not clear how this strategy can be expressed.
Outcomes would depend on holding periods. Investors can go a long time under-performing the index and experiencing every bump that comes along.
Shorter the SMA period (50-day shown above is not written in stone,) more the transaction costs and slippage.
Different look-back periods
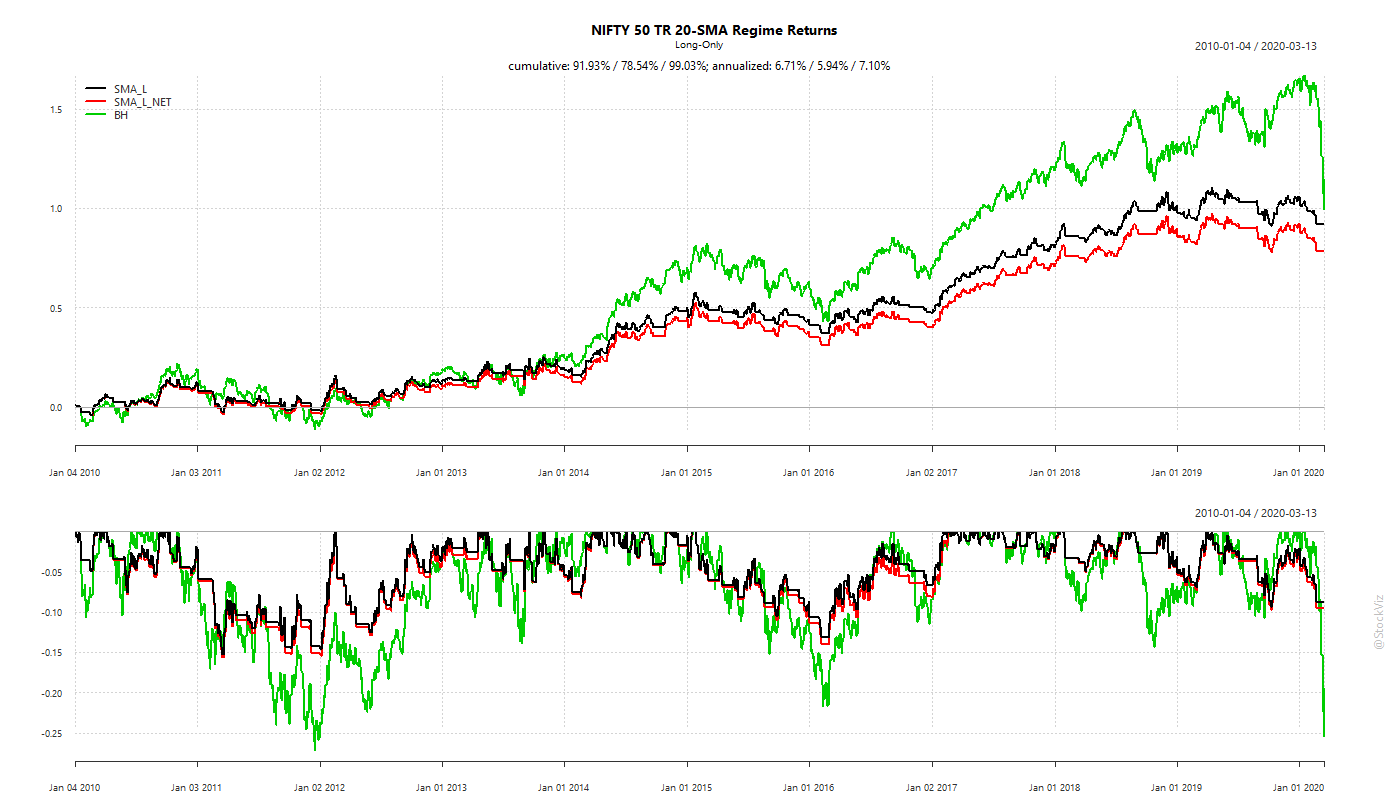
What if you shortened the SMA period to 20 days?
20-days
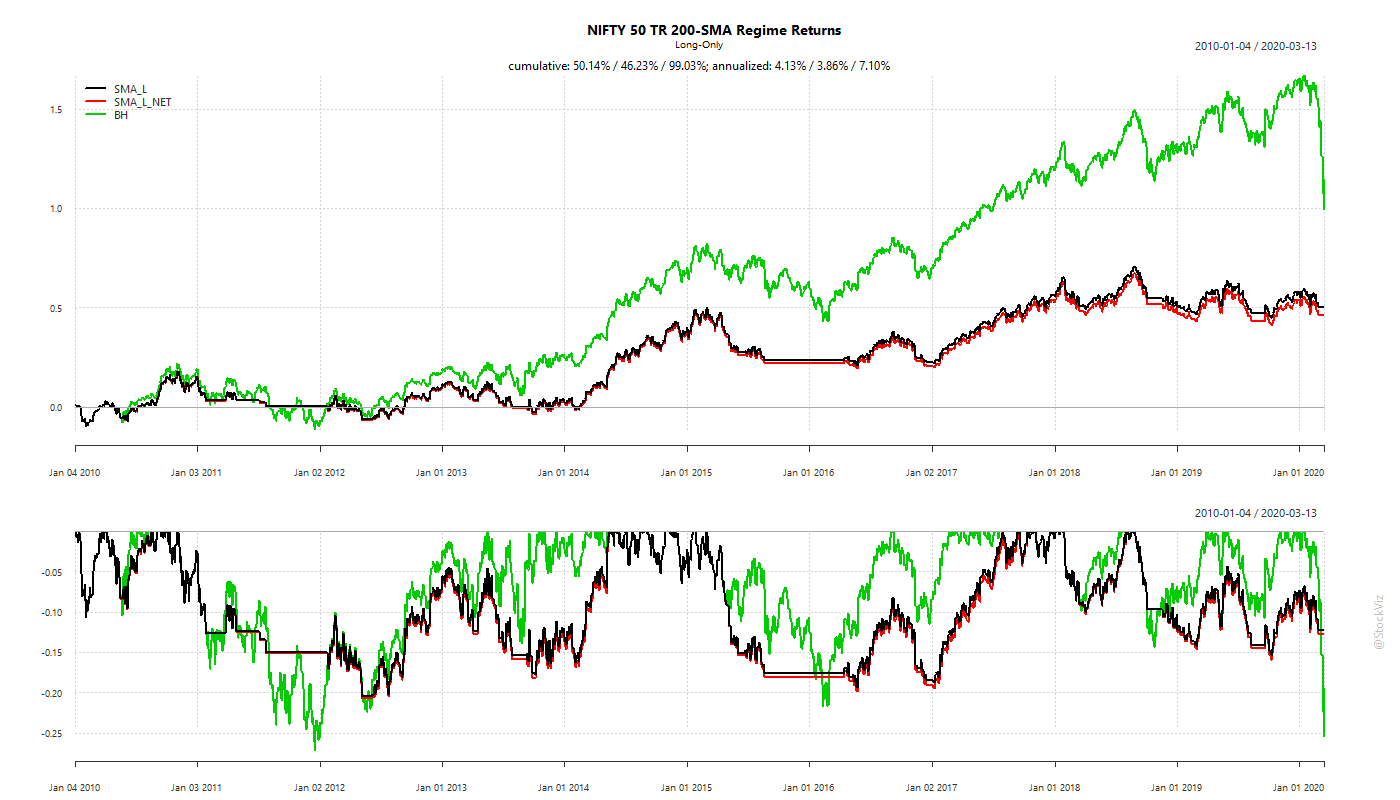
And what if you increased it to 200 days?
200-days
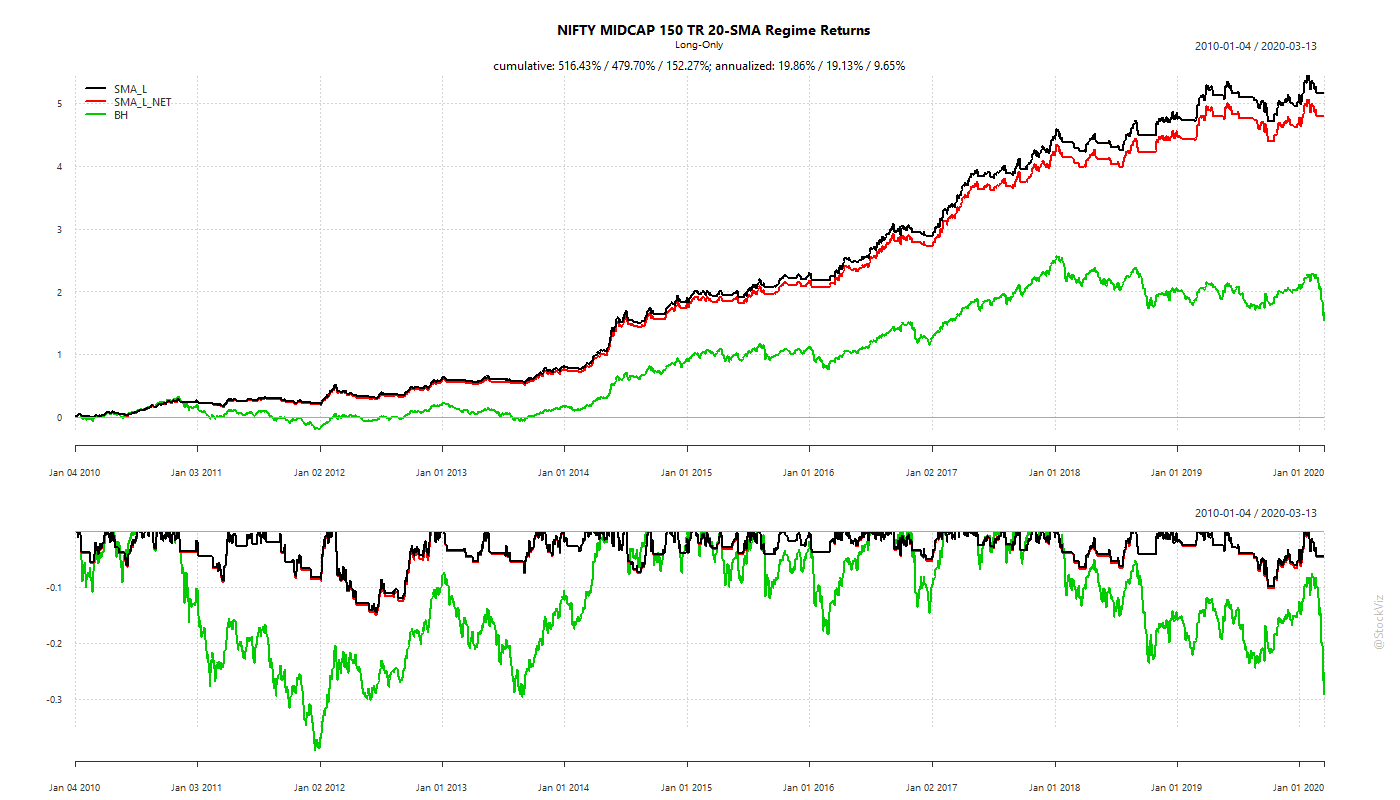
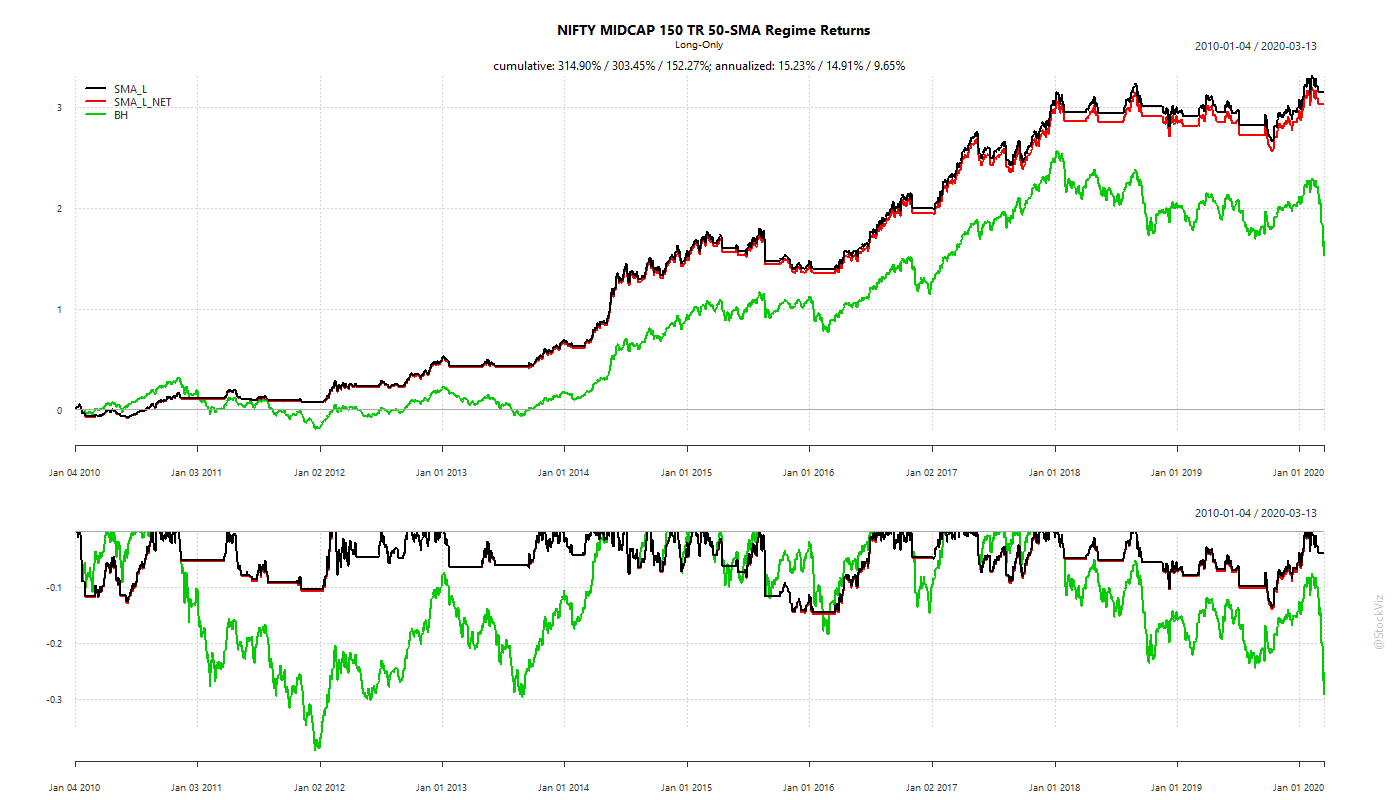
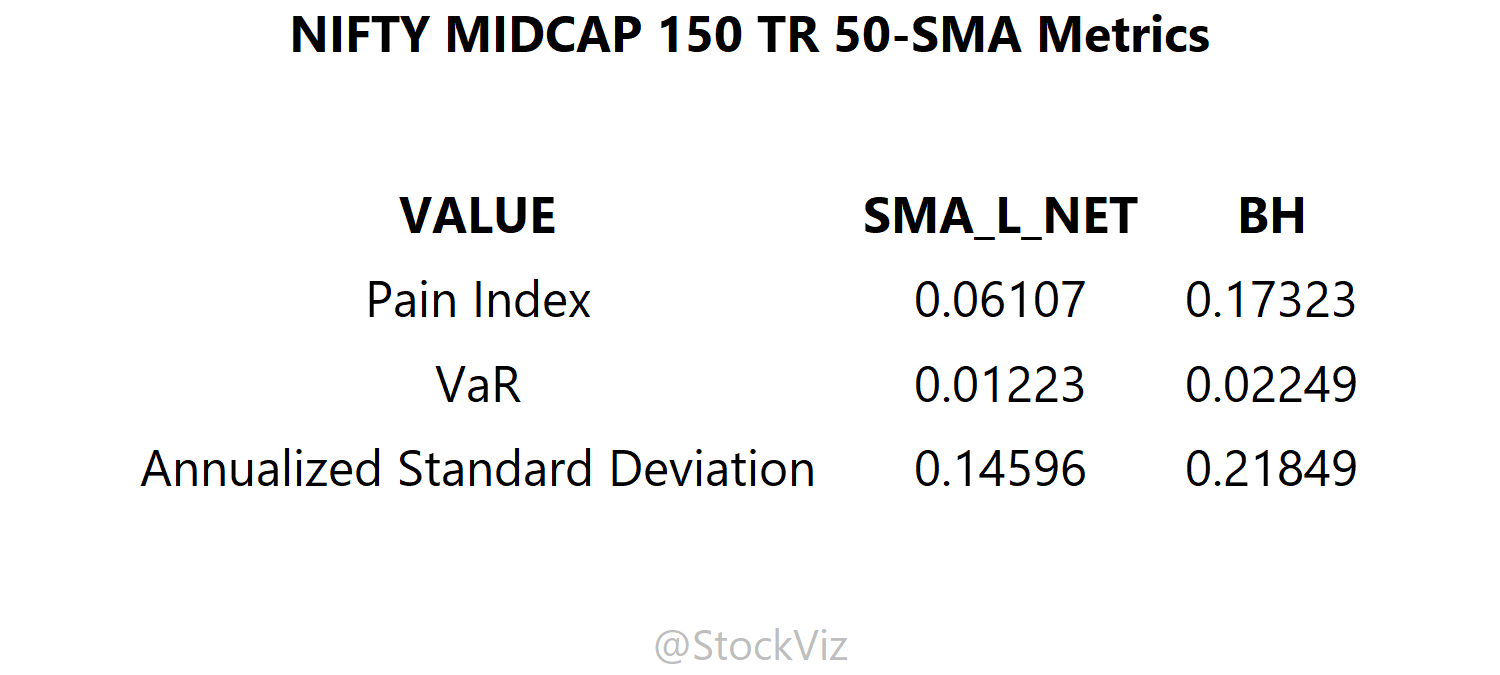
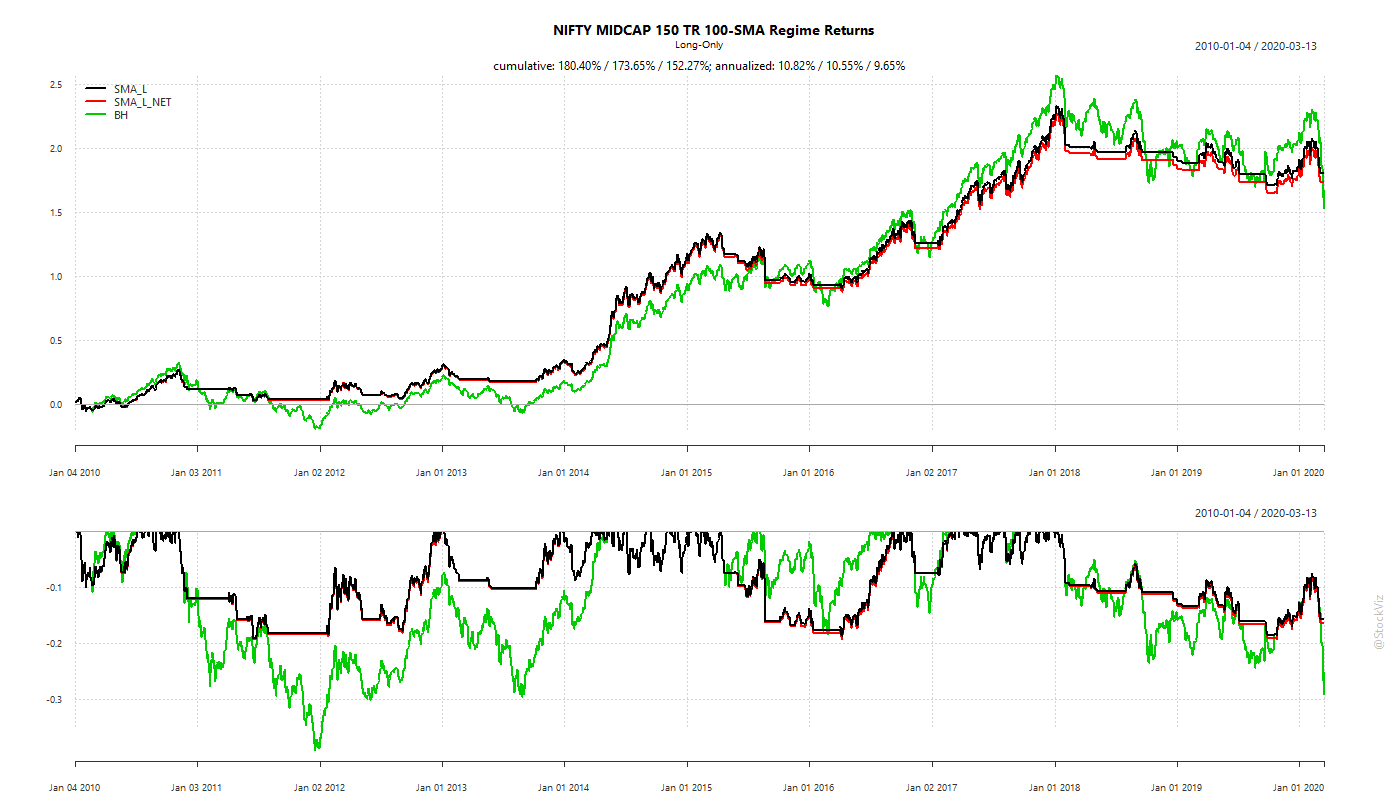
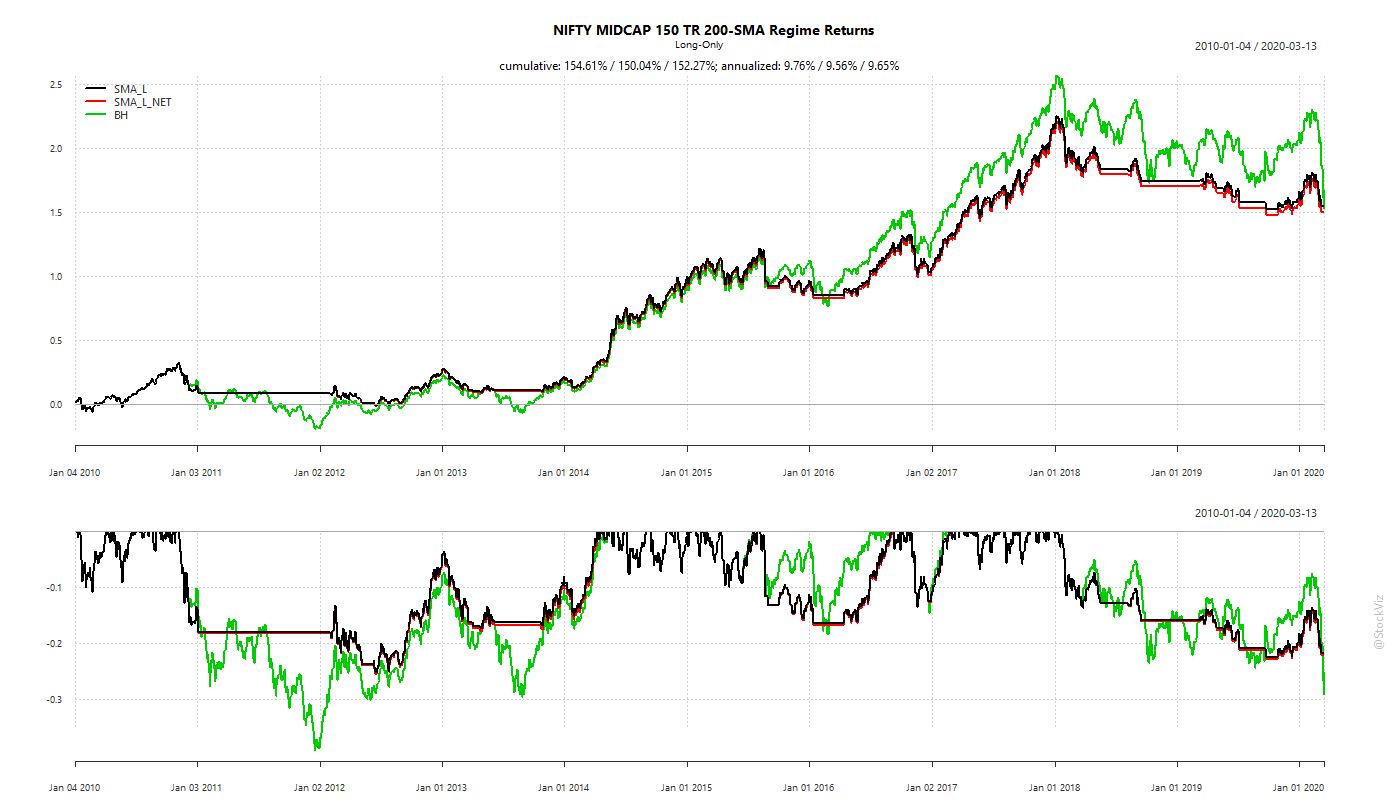
What about Midcaps?
20-days50-days100-days200-days
Who should hedge?
Most of the time, markets recover. However, the recovery time varies each time and there is no way to time hedging strategies. And each under-lying index behaves differently.
So, the reason to do it is investor’s own psychology and the asset one is long. If you, as a buy-and-hold long-term investor, can stomach the volatility, then there is probably no reason to hedge. Besides, portfolio volatility can be reduced through asset allocation as well (here, here.)
And remember: risk-management, whatever the strategy, involves paying upfront to mitigate risk that may or may-not befall.