Study history but use commonsense.
Every advisor you speak to likely extolls the virtues of diversification. “Buy stocks, bonds, gold, real-estate in x/y/z proportion.” Since no one can predict future returns of individual assets, by buying all of them, investors can protect themselves from steep drawdowns.
But what exactly is “diversification?” Is it right for you? Over what assets should you diversify? And how long should you wait before you expect to see the benefits of such diversification?
There are several theories on sex and all of them are lies. – Santosh Kalwar
Before we dive into the how/what/when, let’s set the backdrop through which we’ll discuss the topic.
American Exceptionalism
Most portfolio research is conducted with US Dollar assets trading in America. It is then ported over unquestioningly to other markets. However, there is no other country like America – the only country in the world that can print US Dollars that every other country in the world needs to hold as a reserve asset. This gives US assets a steady, unrelenting bid.
For example, government bonds are supposed to be low-volatility assets with limited downside. However, Indian investors have a completely different experience compared to Americans with it comes to investing in them. Here’s the rolling 3-year standard deviation of weekly returns of Indian 10-year gilts (in USD) and a US fixed-income fund for comparison.

Not only are Indian bonds more volatile, they have +30% drawdowns that take years to recover.

In a flight-to-safety, Indian bonds get sold and American bonds get bought.
The 60/40 Buy and Hold
Since the mid-90’s, an American investing in American assets did spectacularly well. Not just in equities…

… but in bonds as well.

An US-based advisor can be excused for beating the drum of buy-and-hold. After all, US equities and bonds have always recovered. And they can afford to keep-it-simple with a static 60/40 allocation between stocks and bonds.
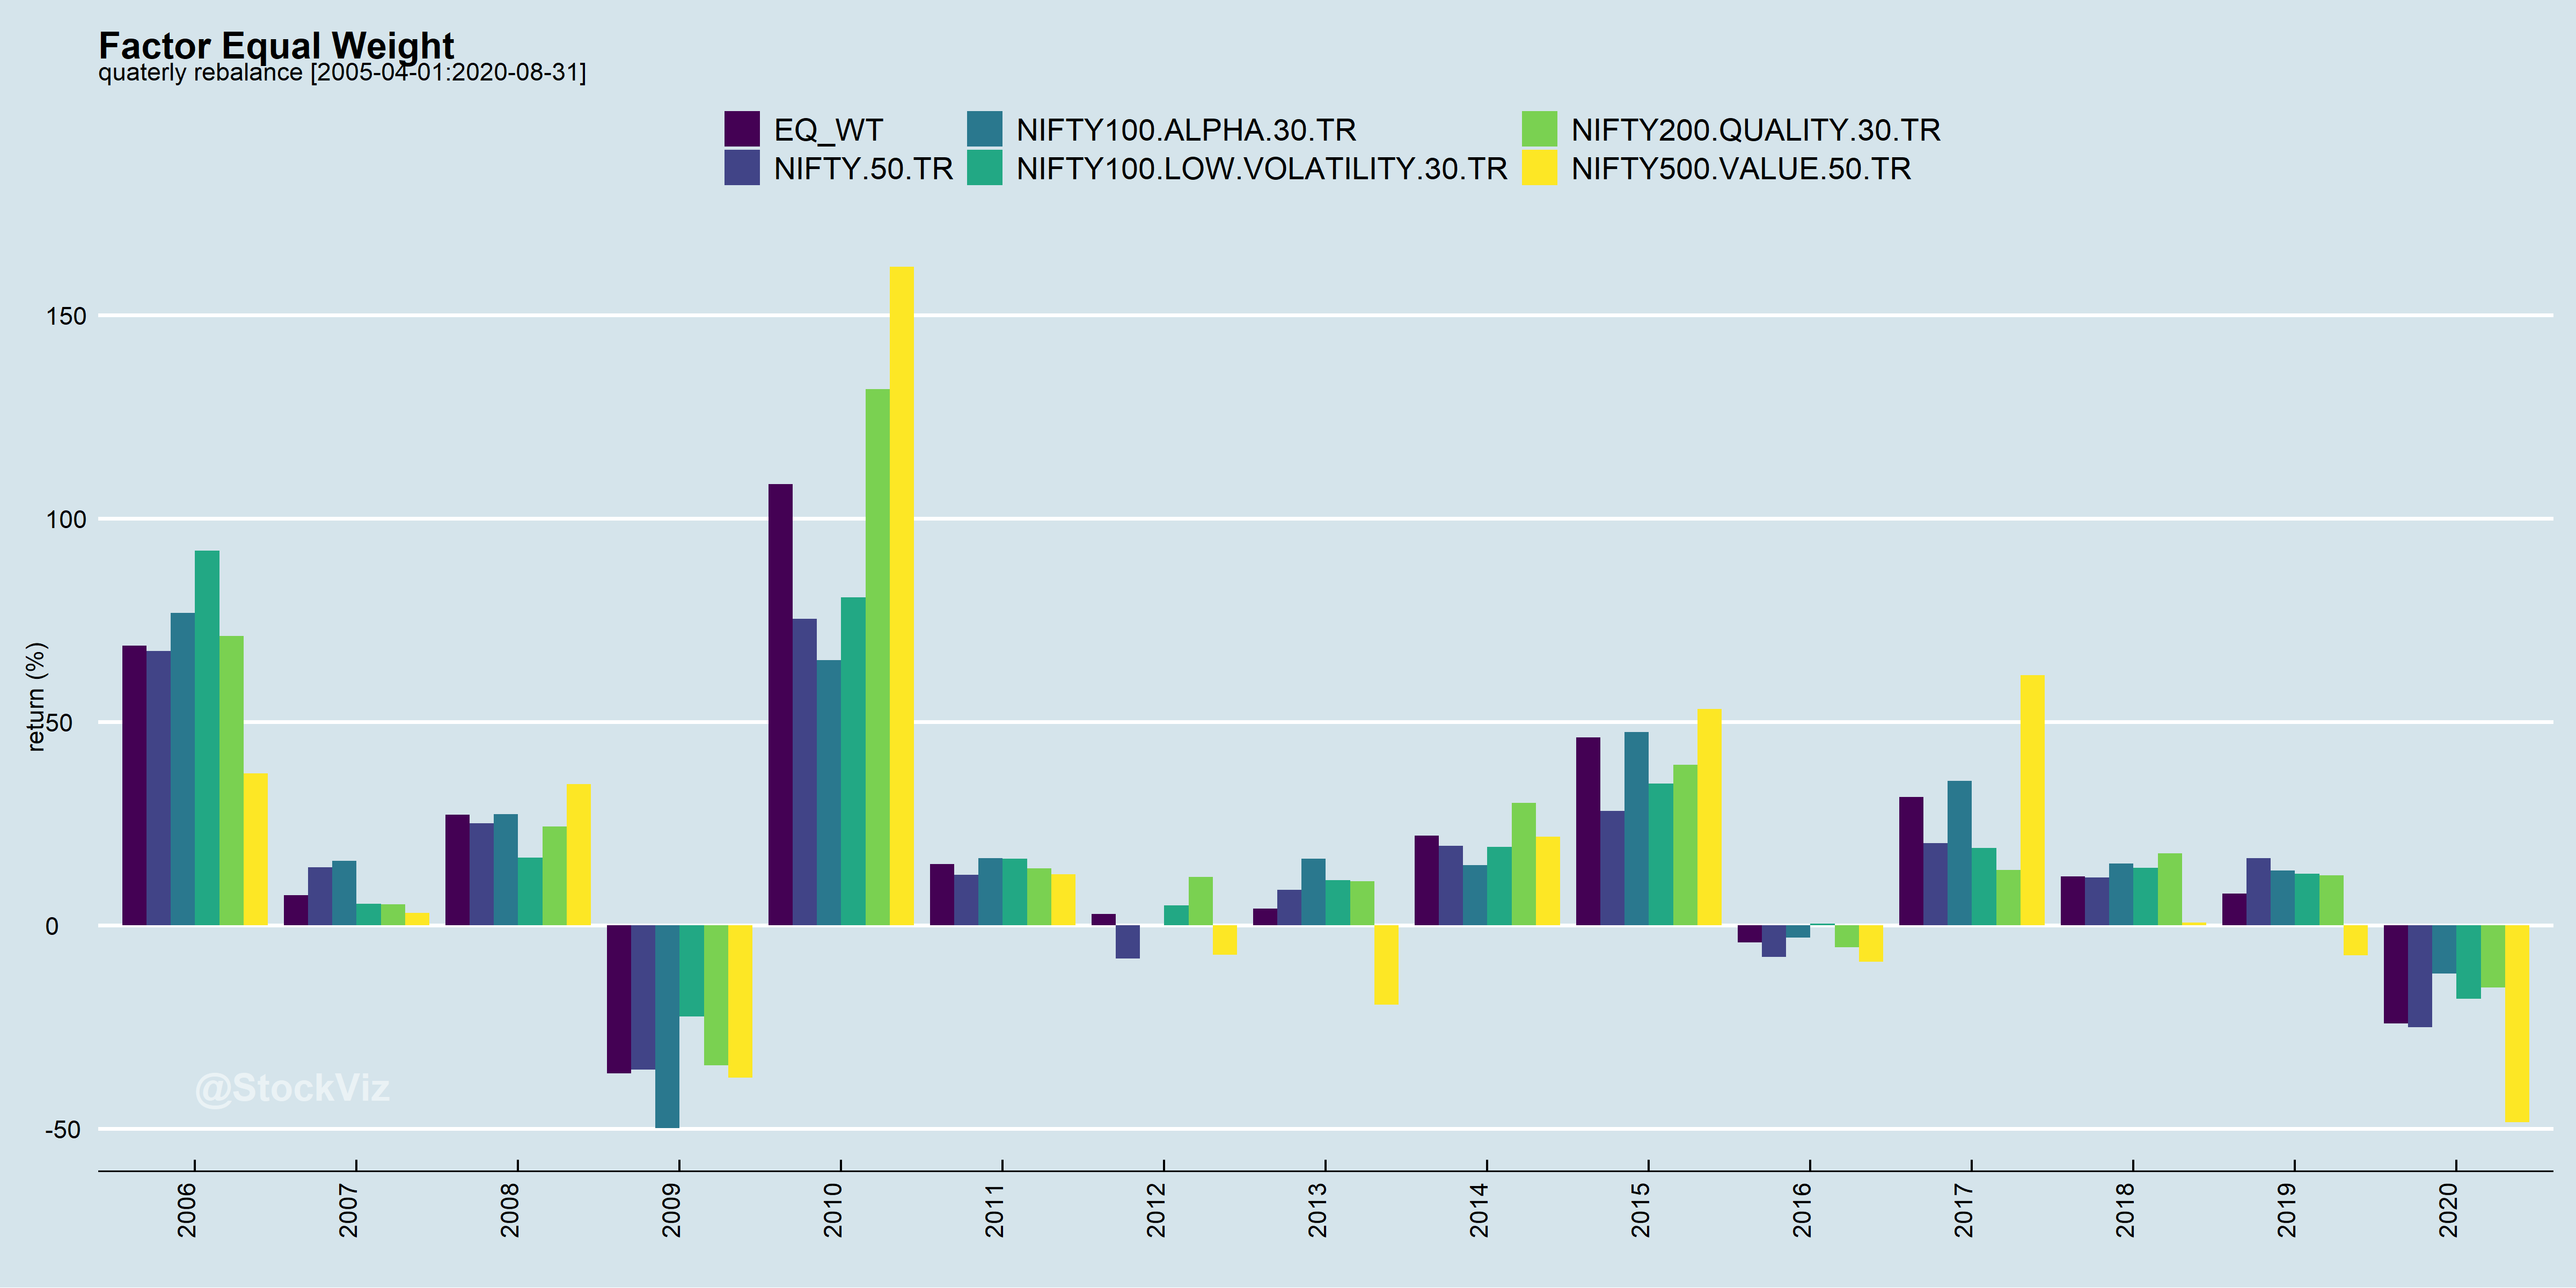
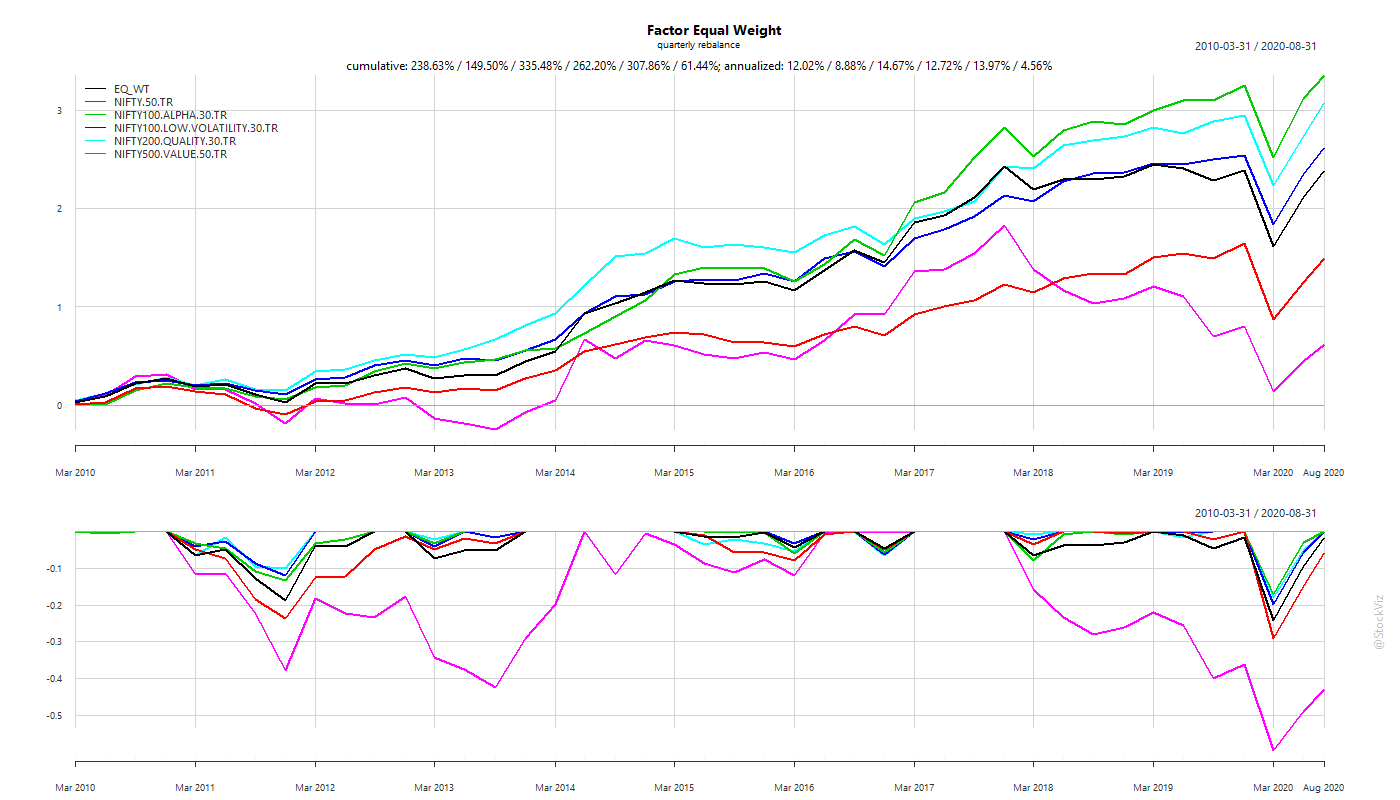
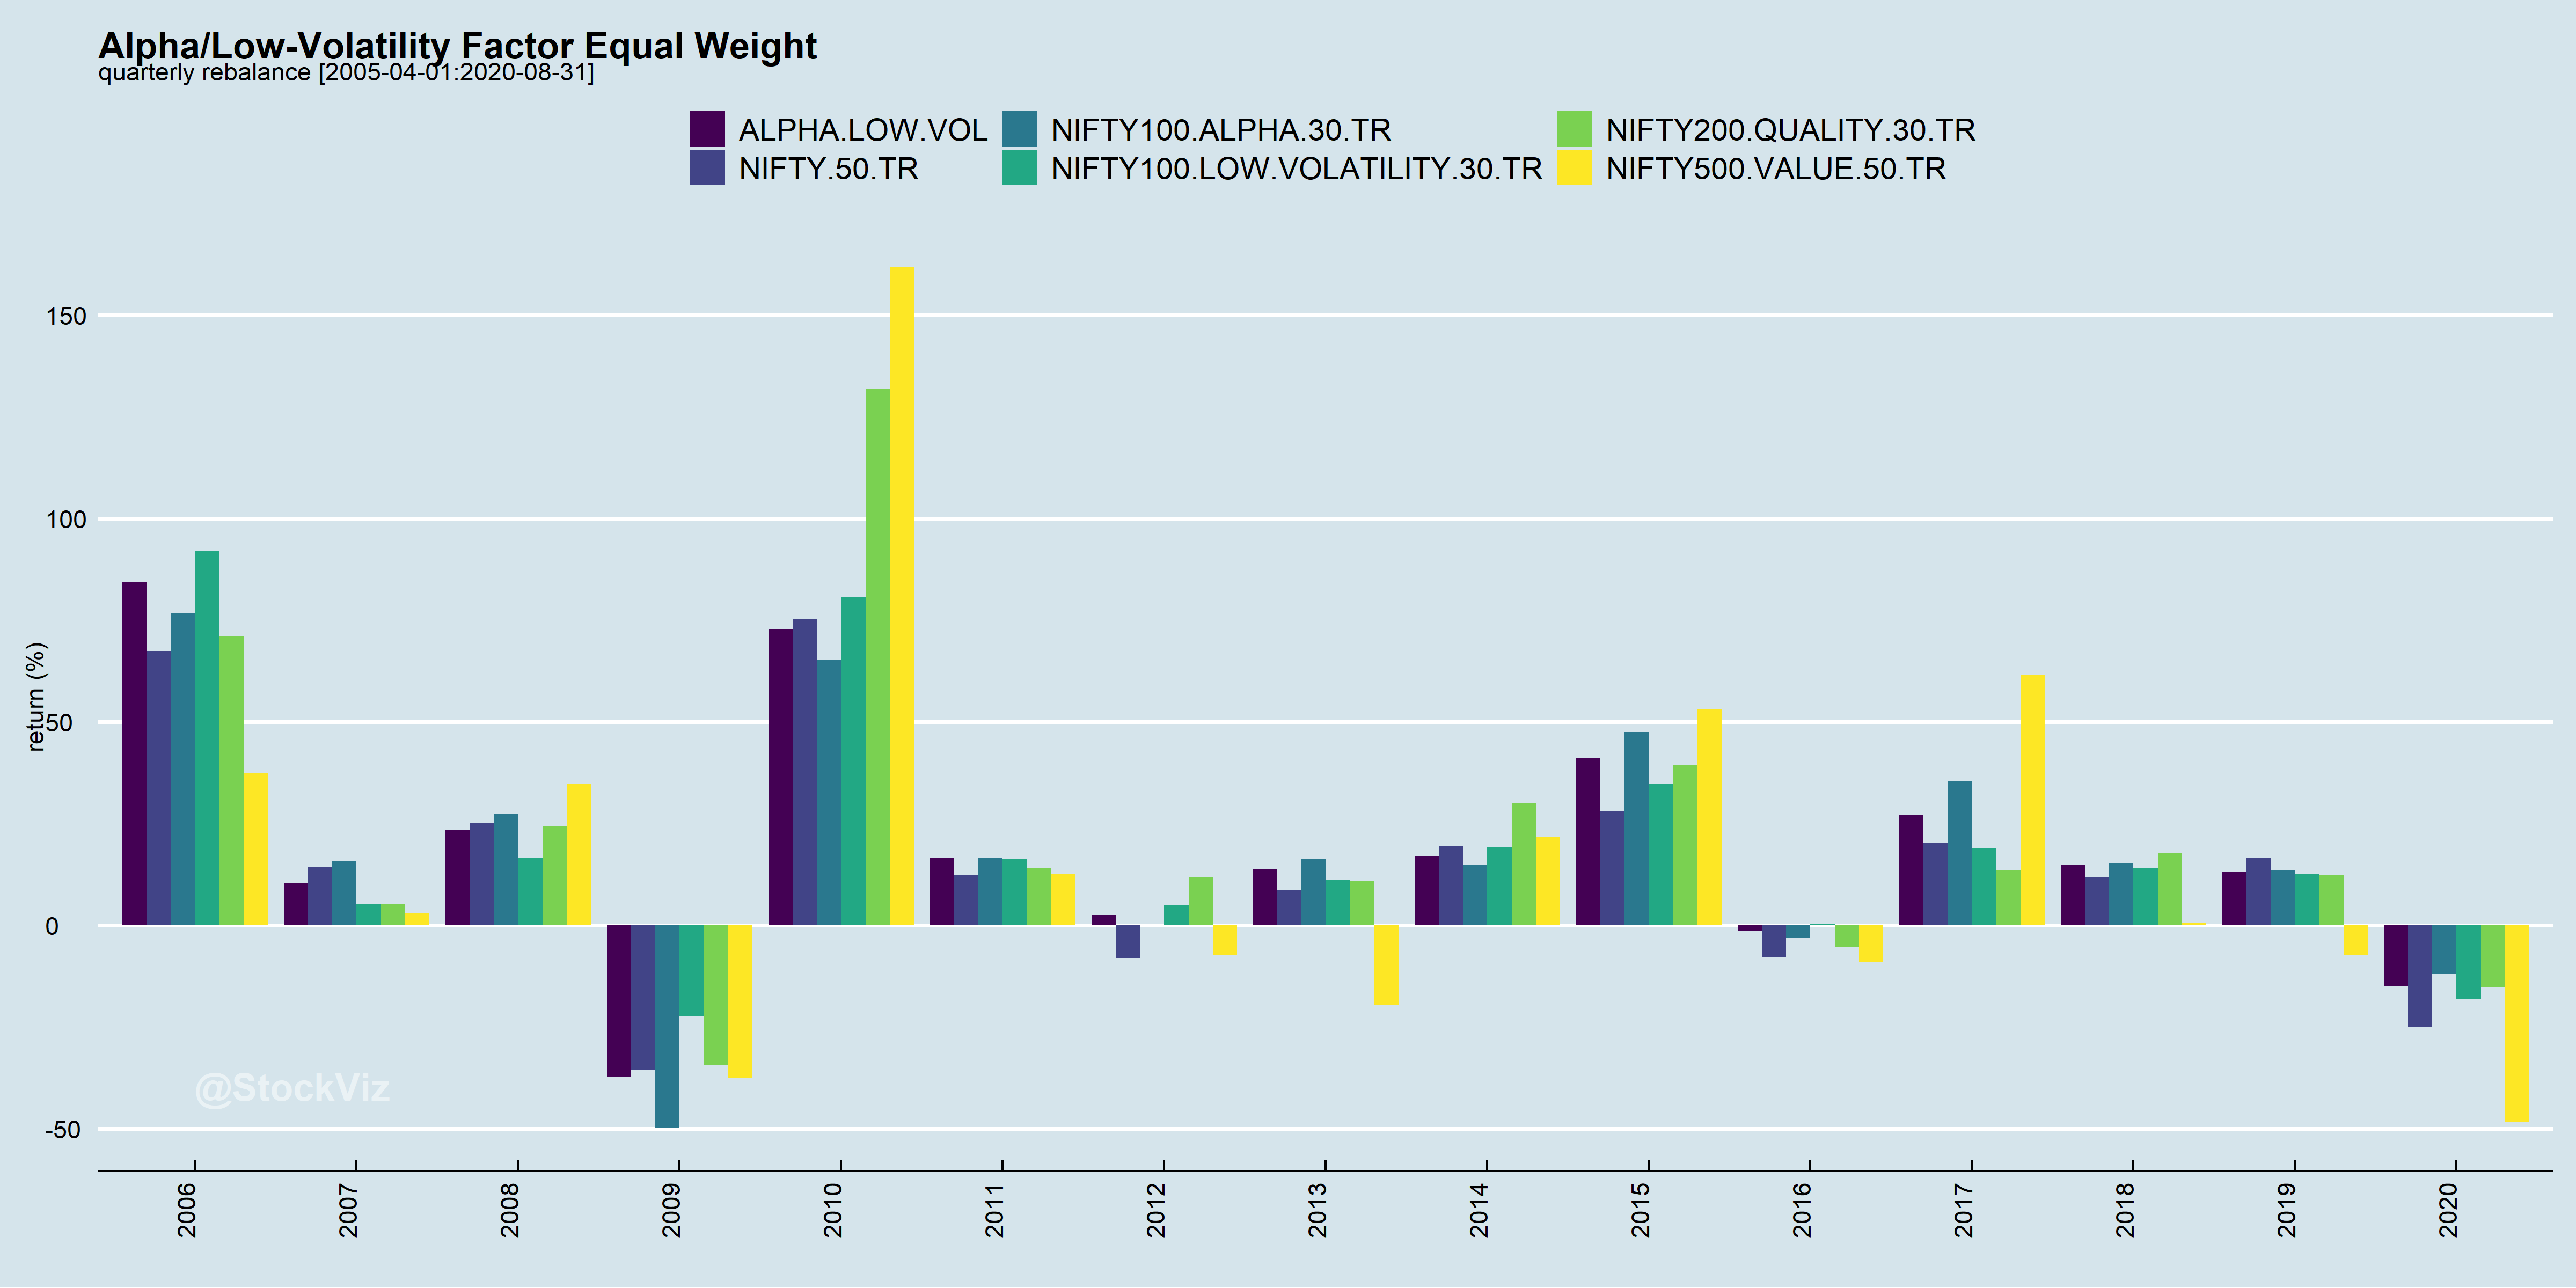
However, look at the performance of Emerging Market (EM) equities and bonds. An absolute disaster both in terms of returns and volatility.
So, when advisors wax eloquent of the 60/40 portfolio, what they really mean is US Equity/US Bond 60/40 portfolio. Investors in the rest of the world, especially in EMs like India, will do well to formulate a strategy that works given their reality rather than blindly following US-centric allocations and strategies.
King Dollar
While the US Dollar has appreciated against most currencies since 2010, it is nothing compared to how much it has appreciated against the Indian Rupee.

A falling currency is a headwind against a portfolio trying to preserve purchasing power and presents a performance hurdle of sorts.
While USDINR is not the worst currency pair out there, it pays to think of portfolios in Dollar terms.
The Streetlight Effect
A policeman sees a drunk man searching for something under a streetlight and asks what the drunk has lost. He says he lost his keys and they both look under the streetlight together. After a few minutes the policeman asks if he is sure he lost them here, and the drunk replies, no, that he lost them in the park. The policeman asks why he is searching here, and the drunk replies, “this is where the light is.”

The Center for Research in Security Prices (CRSP) was founded in 1960. They went live in 1964. Initially, the center’s database consisted of monthly share prices of common stock trading on the NYSE, dating back to 1926. Over time, the database grew in size, introducing other exchanges and securities, as well as daily updates.
In India, the Total Return NSE mid-cap index prices are available only from 2005. In search of robustness, researchers use US datasets by default. However, every market is different because the political backdrop in which they operate are different. It is called the political economy for a reason. So, before taking US financial research at face-value, it behooves us to understand the qualitative drivers behind the numbers: are regulation, politics and market structure similar enough for the data-set being analyzed that the conclusions can be applied to the target market?
Besides, with limited datasets, it is easy to play games by cherry-picking data and begin/end dates to fit a narrative. Here is a sample:
OVER THE LAST 10 YEARS, NIFTY 50’s DOLLAR RETURNS TRAIL THE S&P500’s BY A WHOPPING 6.5%

OVER THE LAST 15 YEARS, NIFTY 50’s DOLLAR RETURNS TRUMP THE S&P500’s BY A WHOPPING 3.5%

While trying to figure out the right asset mix and investment strategy, Indian investors have to recognize that they may be looking through a tinted window, at a small dataset.
The Allure of Commodities
The theory behind investing in commodities is that they offer an inflation hedge unmatched by most other asset classes. While the relationship between commodities and equities varies considerably – at times there is a negative correlation – on average, they show a low but positive correlation.
Here comes the BUT: the dataset used to analyze these relationships largely covers prices before commodities were financialized, democratized and packaged into ETFs that can be traded by mom-and-pop investors by the click of a button.
While some advisors may hold onto the trope that commodities “work” if actively managed, historical performance of such funds have been a disaster.

The best way to become a millionaire is to start with a billion dollars and invest in commodities.

Take-away
While diversification is often recommended as a “free lunch” that every investor can partake, a lot depends on the assets that go into the basket. Each one of them have “worked” in the past for different reasons. Increasing financialization means that assets that were uncorrelated in the past because of trading friction suddenly become correlated during market panics. Currency depreciation is a real problem for Indian investors, silently eroding purchasing power.
Portfolio construction should be done against this backdrop – not blindly throwing together a bunch of assets and hoping that it works. We will discuss some of these approaches in subsequent posts.