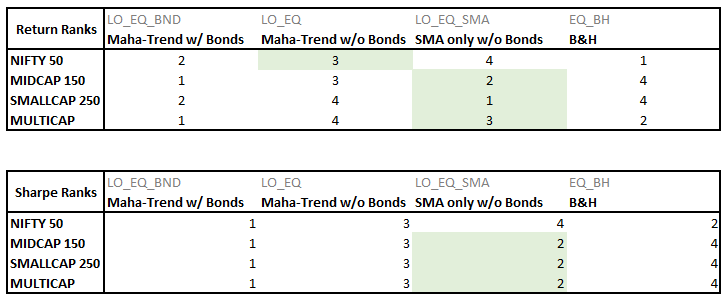
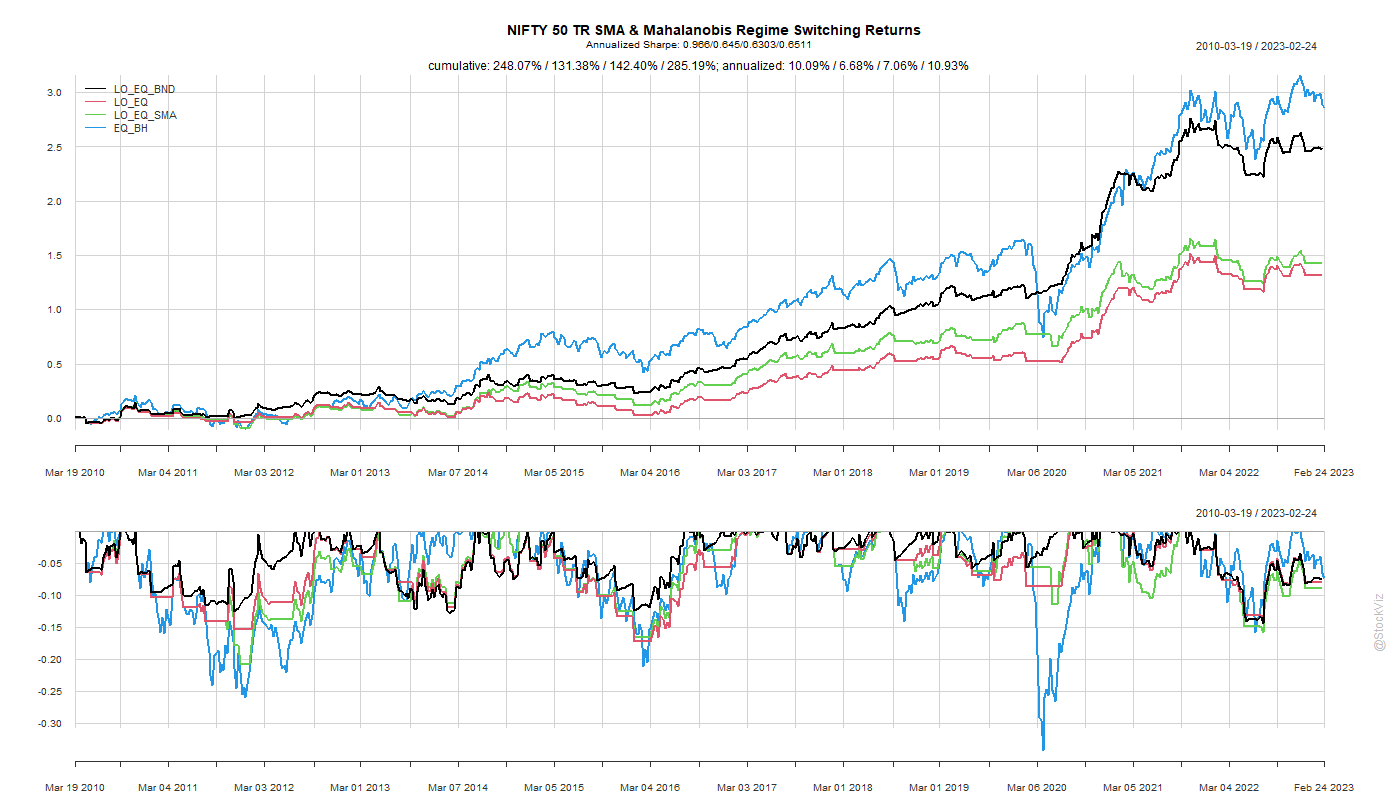
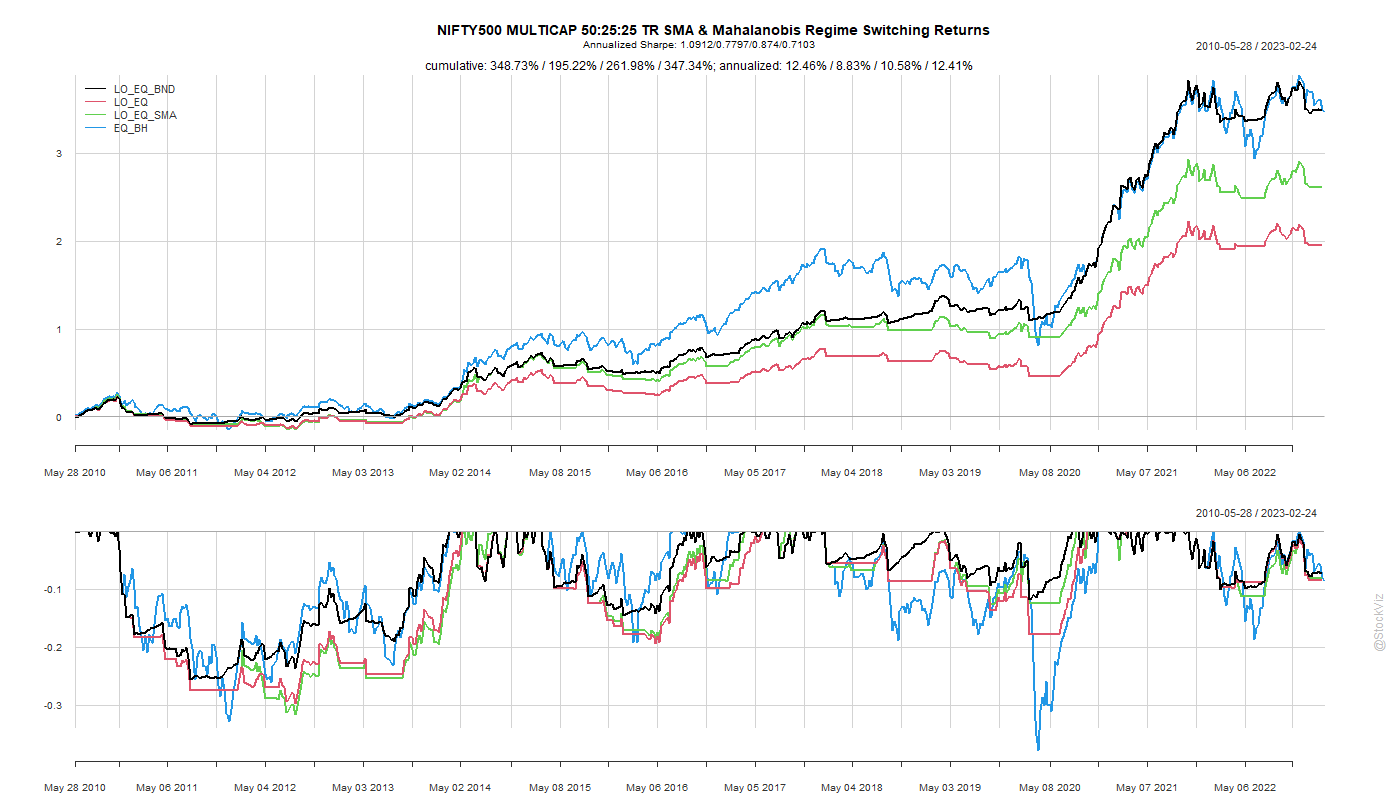
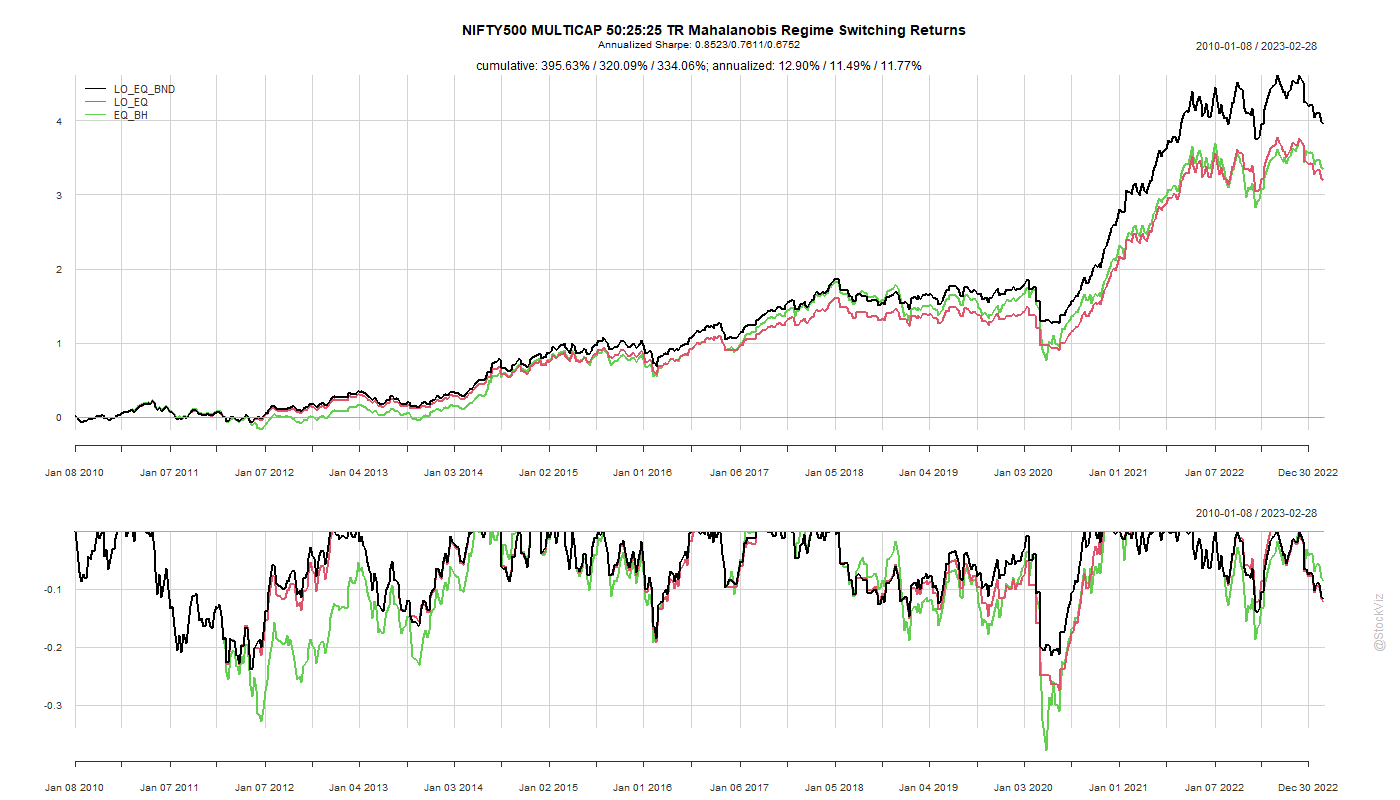
Previously, we constructed a portfolio that switches between equities and bonds based on the Mahalanobis distance between them. Here, keeping everything else the same, we add a trend filter to the same set of indices.
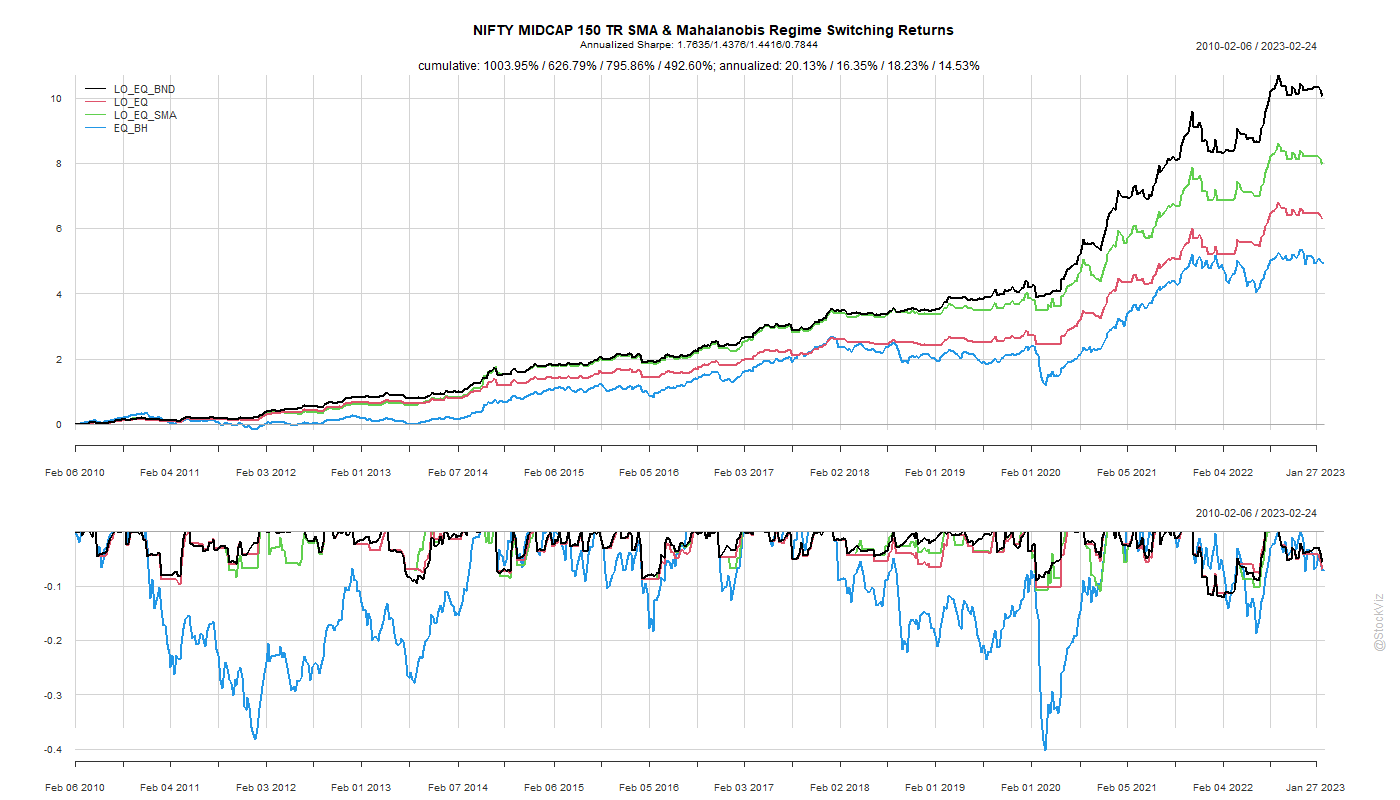
The composite regime-switching model ends up with superior Sharpe Ratios. However, if you don’t switch to bonds (and stay in cash, earning zero), then you maybe better off with a simple trend model.
The alpha seems to be in earning the risk-free rate when things are “bad” and getting long equities only when things are “favorable.”
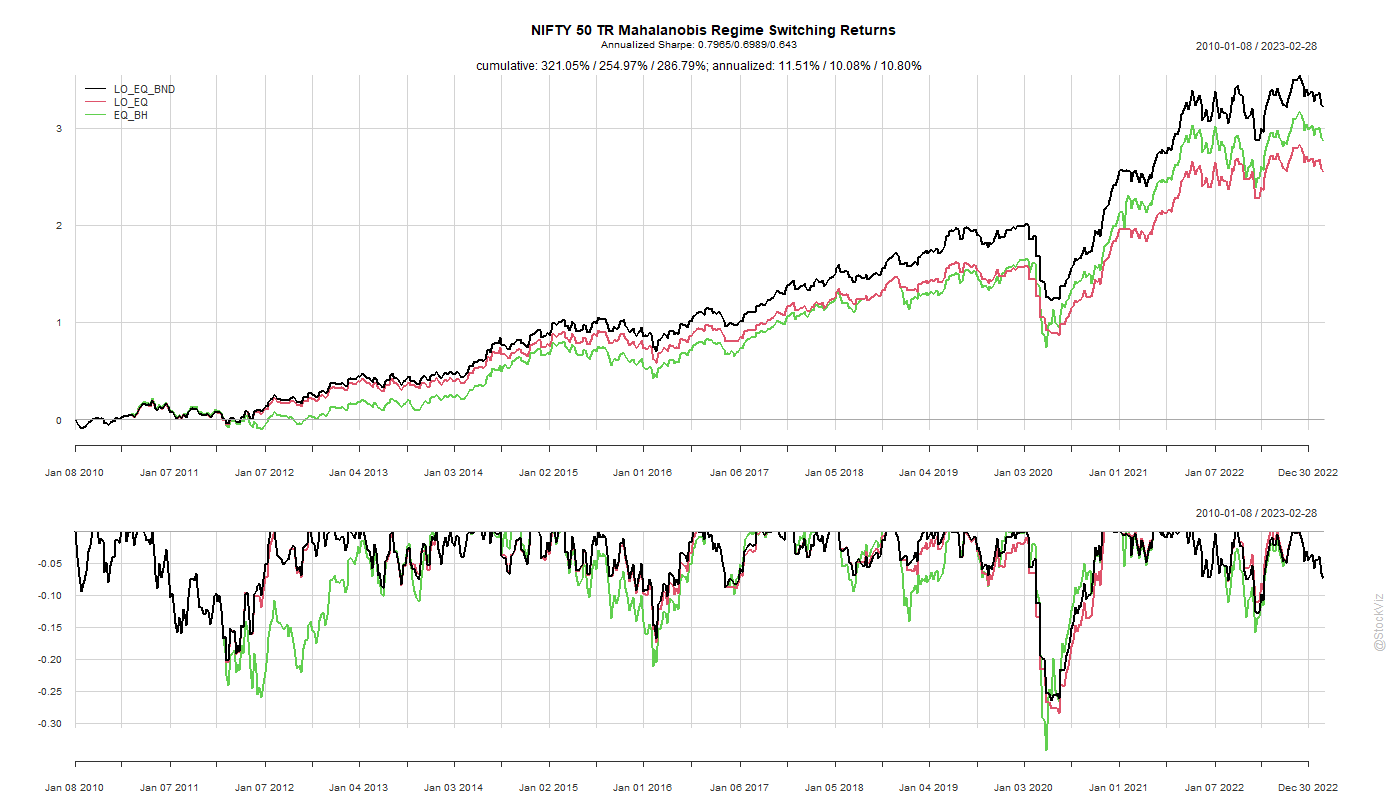
Recently, we came across an interesting paper, Skulls, Financial Turbulence, and Risk Management, Mark Kritzman, CFA, and Yuanzhen Li, that uses the Mahalanobis distance to construct a turbulence index. The basic idea is that the more asset returns break from the past, the more “significant” a market event.
We took the basic intuition behind this and constructed a portfolio that switches between equities and bonds based on the Mahalanobis distance between them.
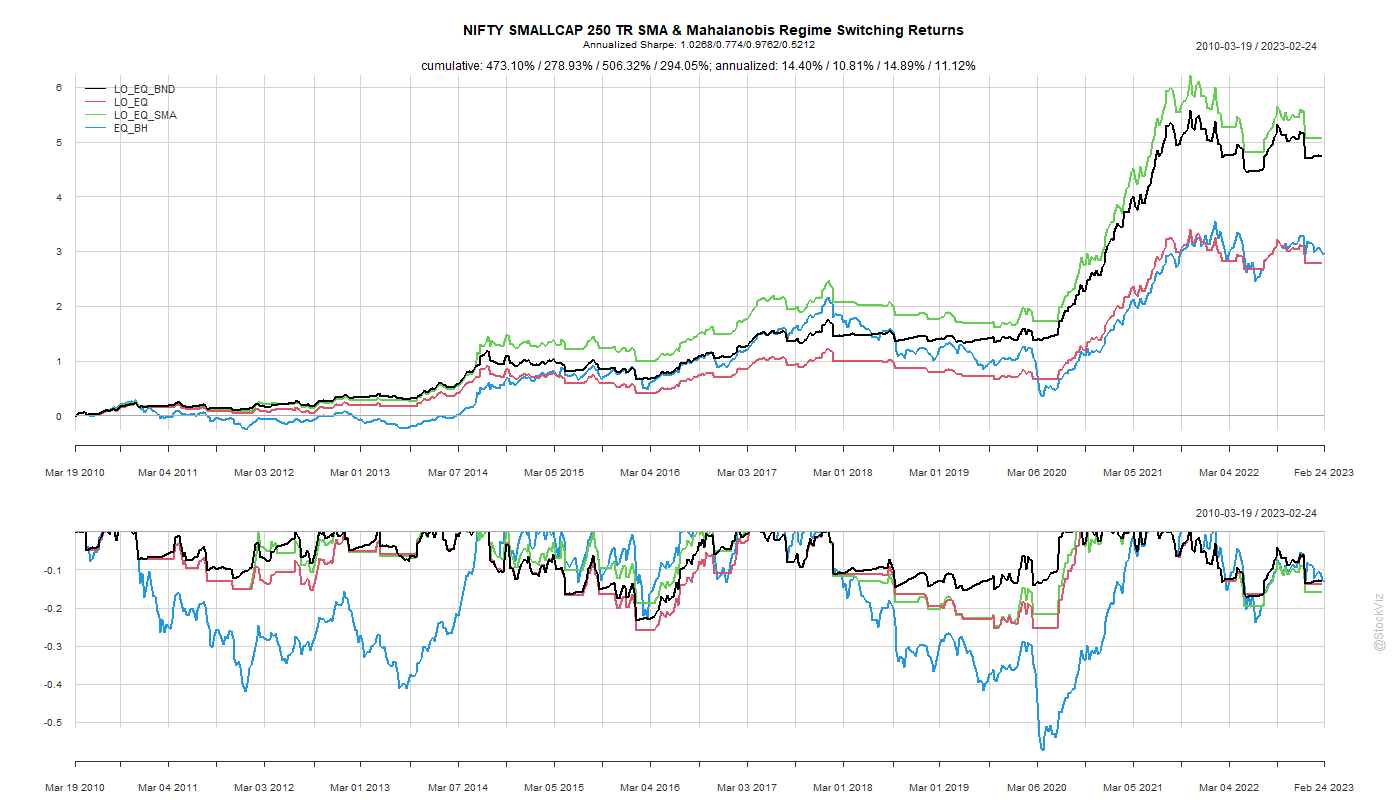
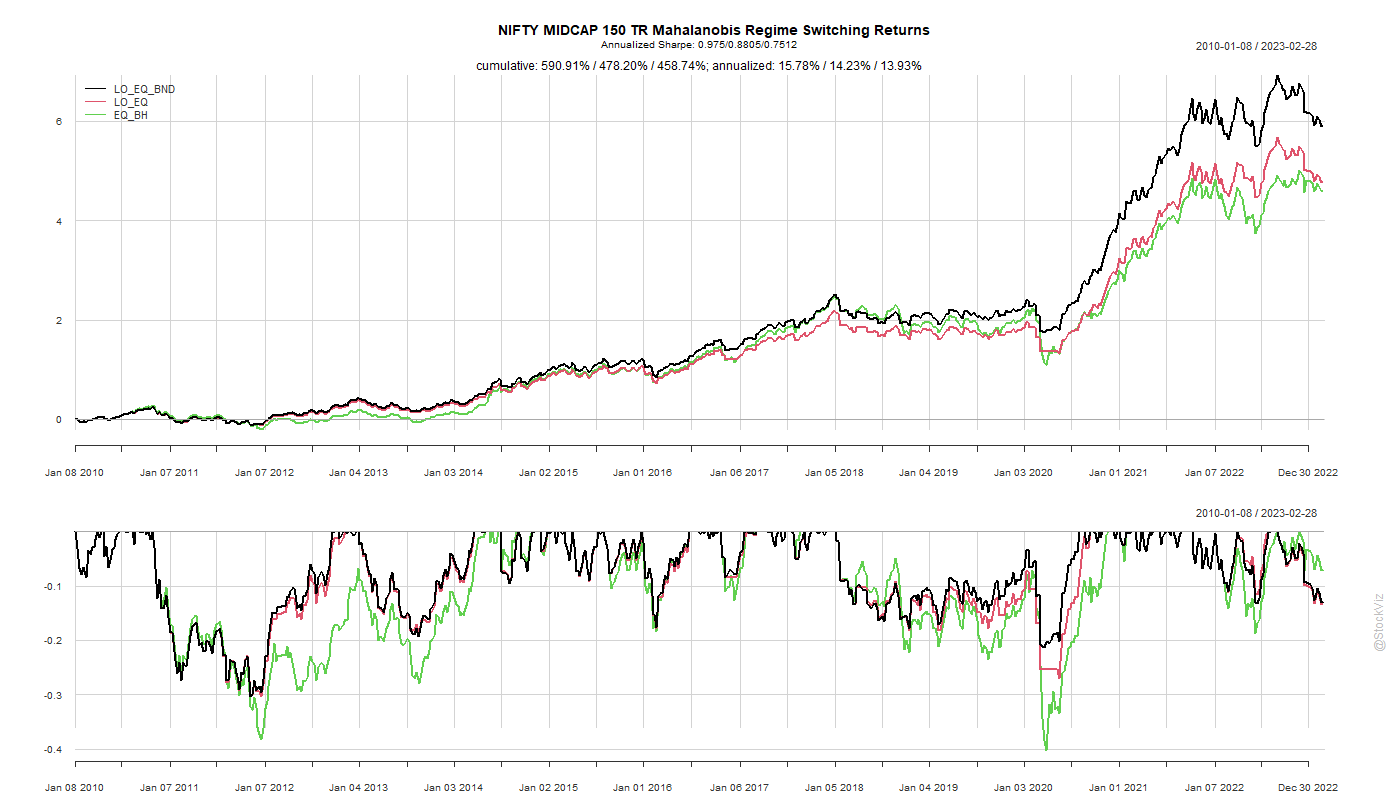
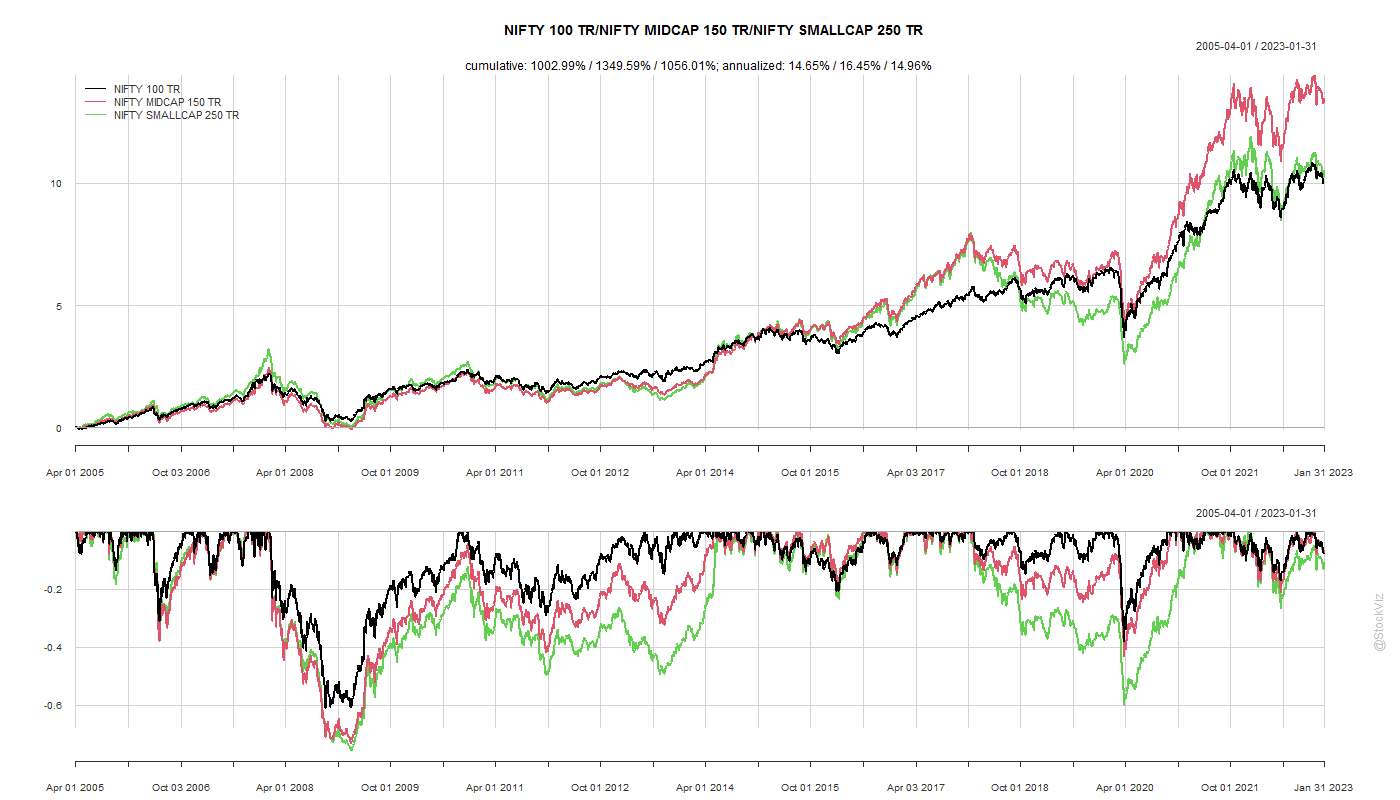
The out-of-sample results, factoring in transaction costs, look promising but doesn’t really stand out compared to other, more dumber, strategies that avoid steep drawdowns. However, two points over the Midcap buy & hold cannot be dismissed outright.
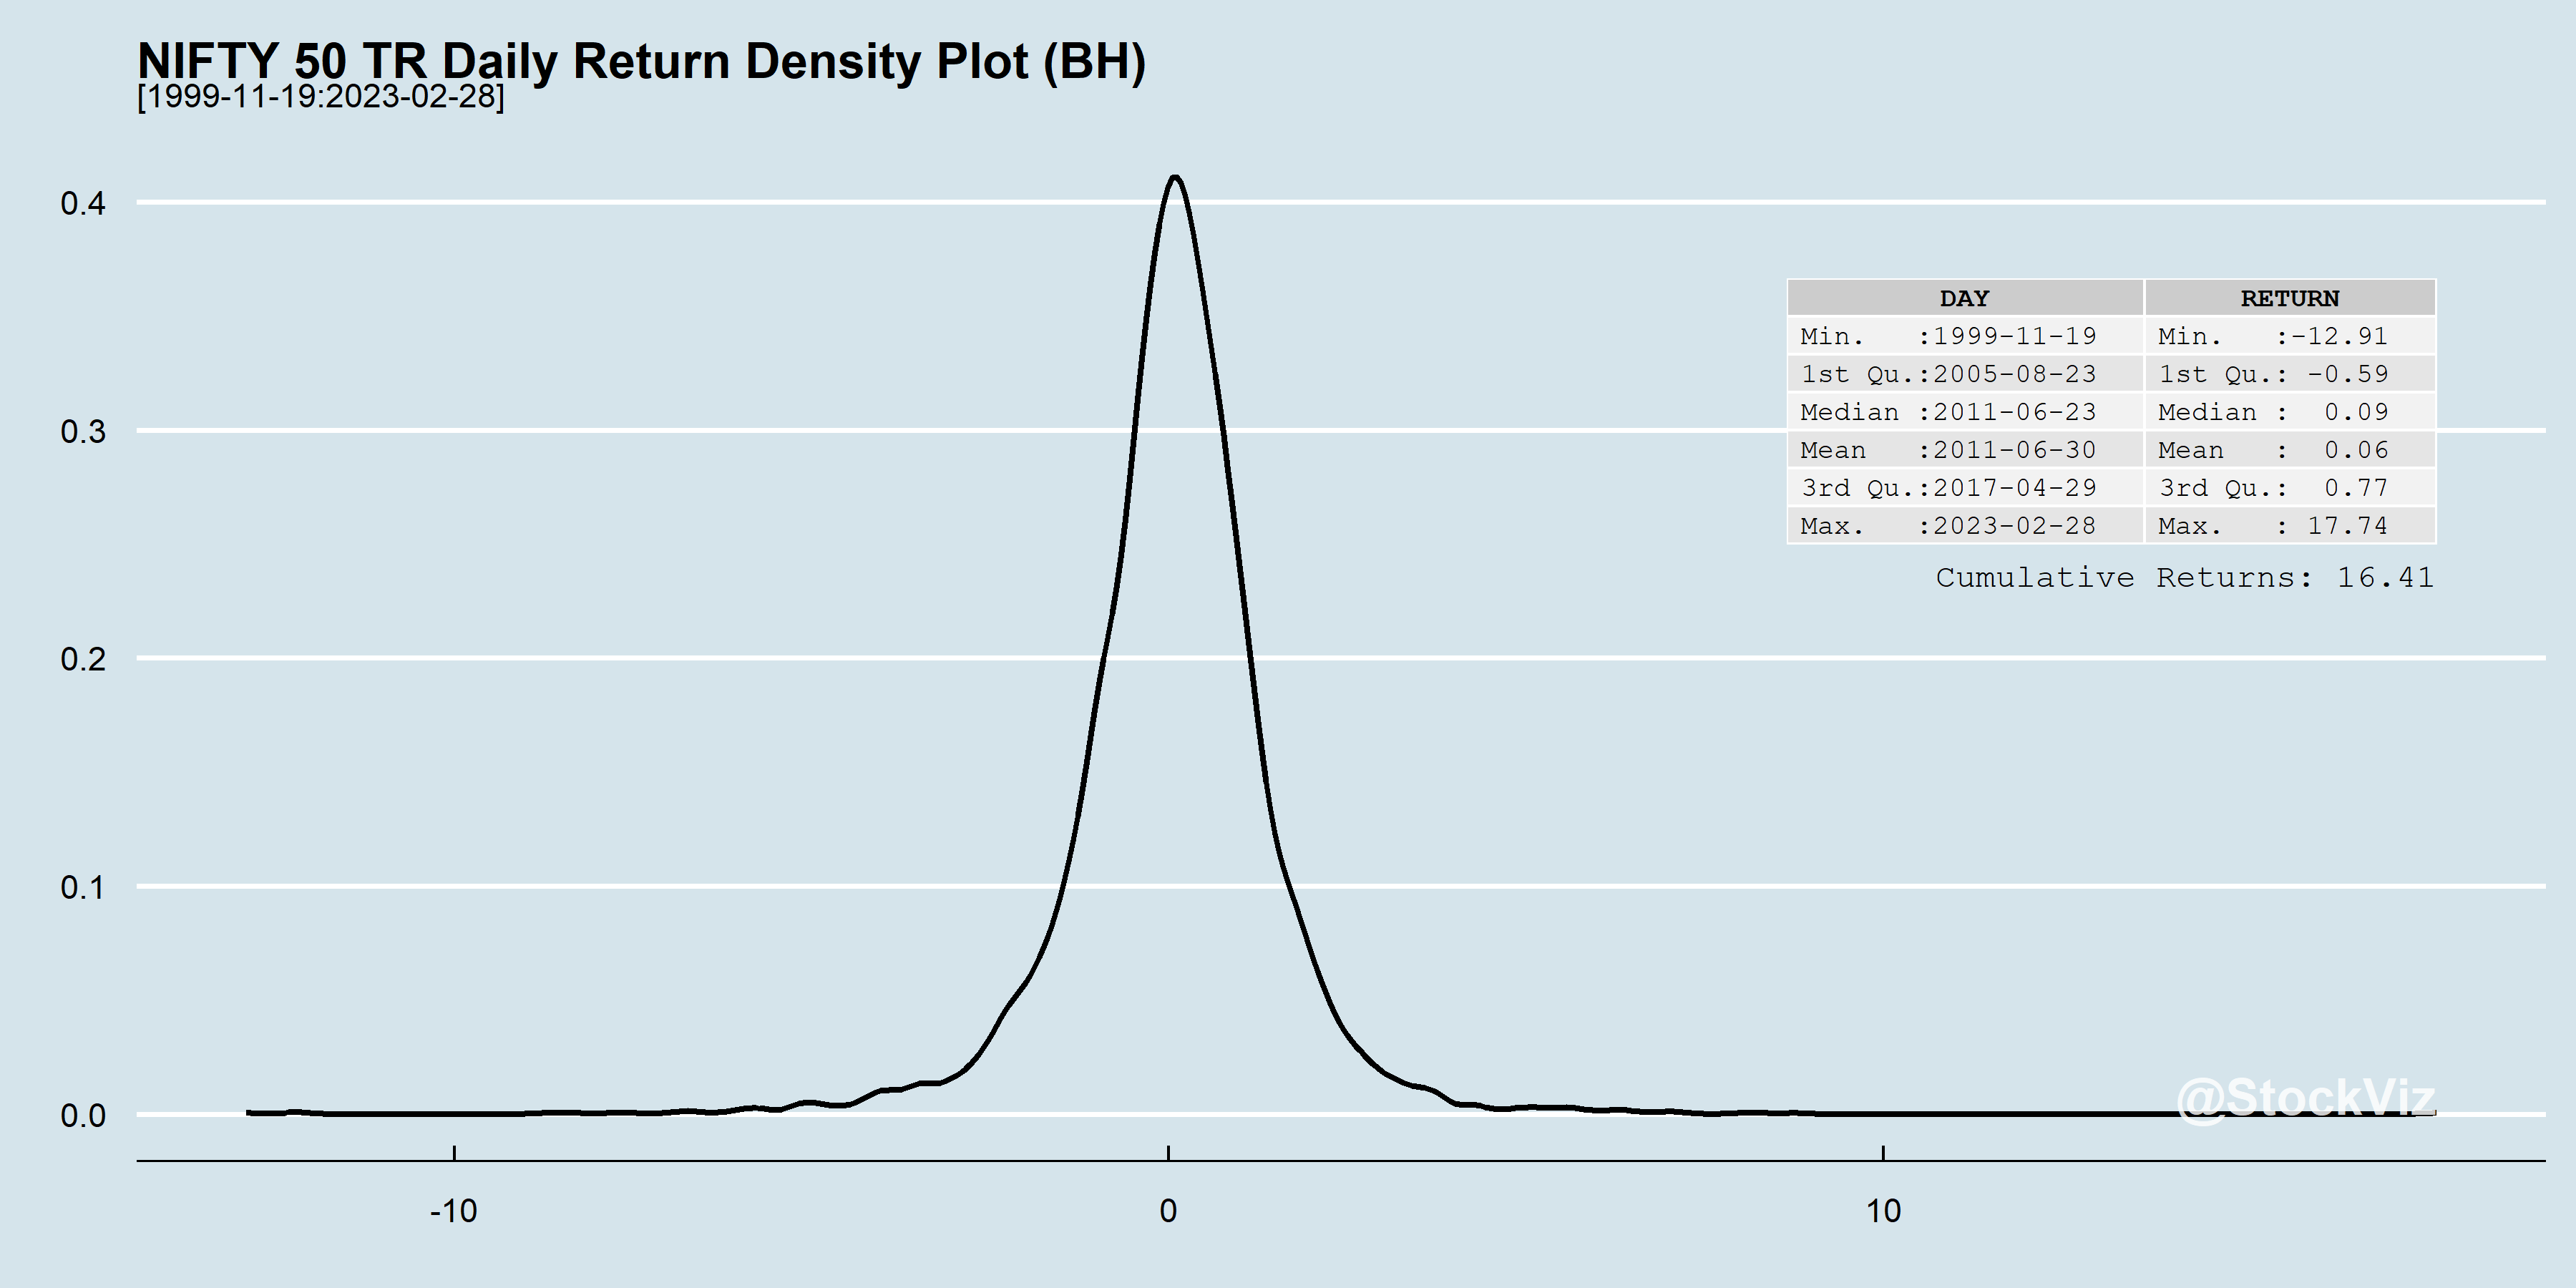
We are often told that missing the 10-biggest days in the market leads to sub-par returns. While it is certainly true, what is often not said is that those really big days occur around really bad days. Welcome to tail-risk.
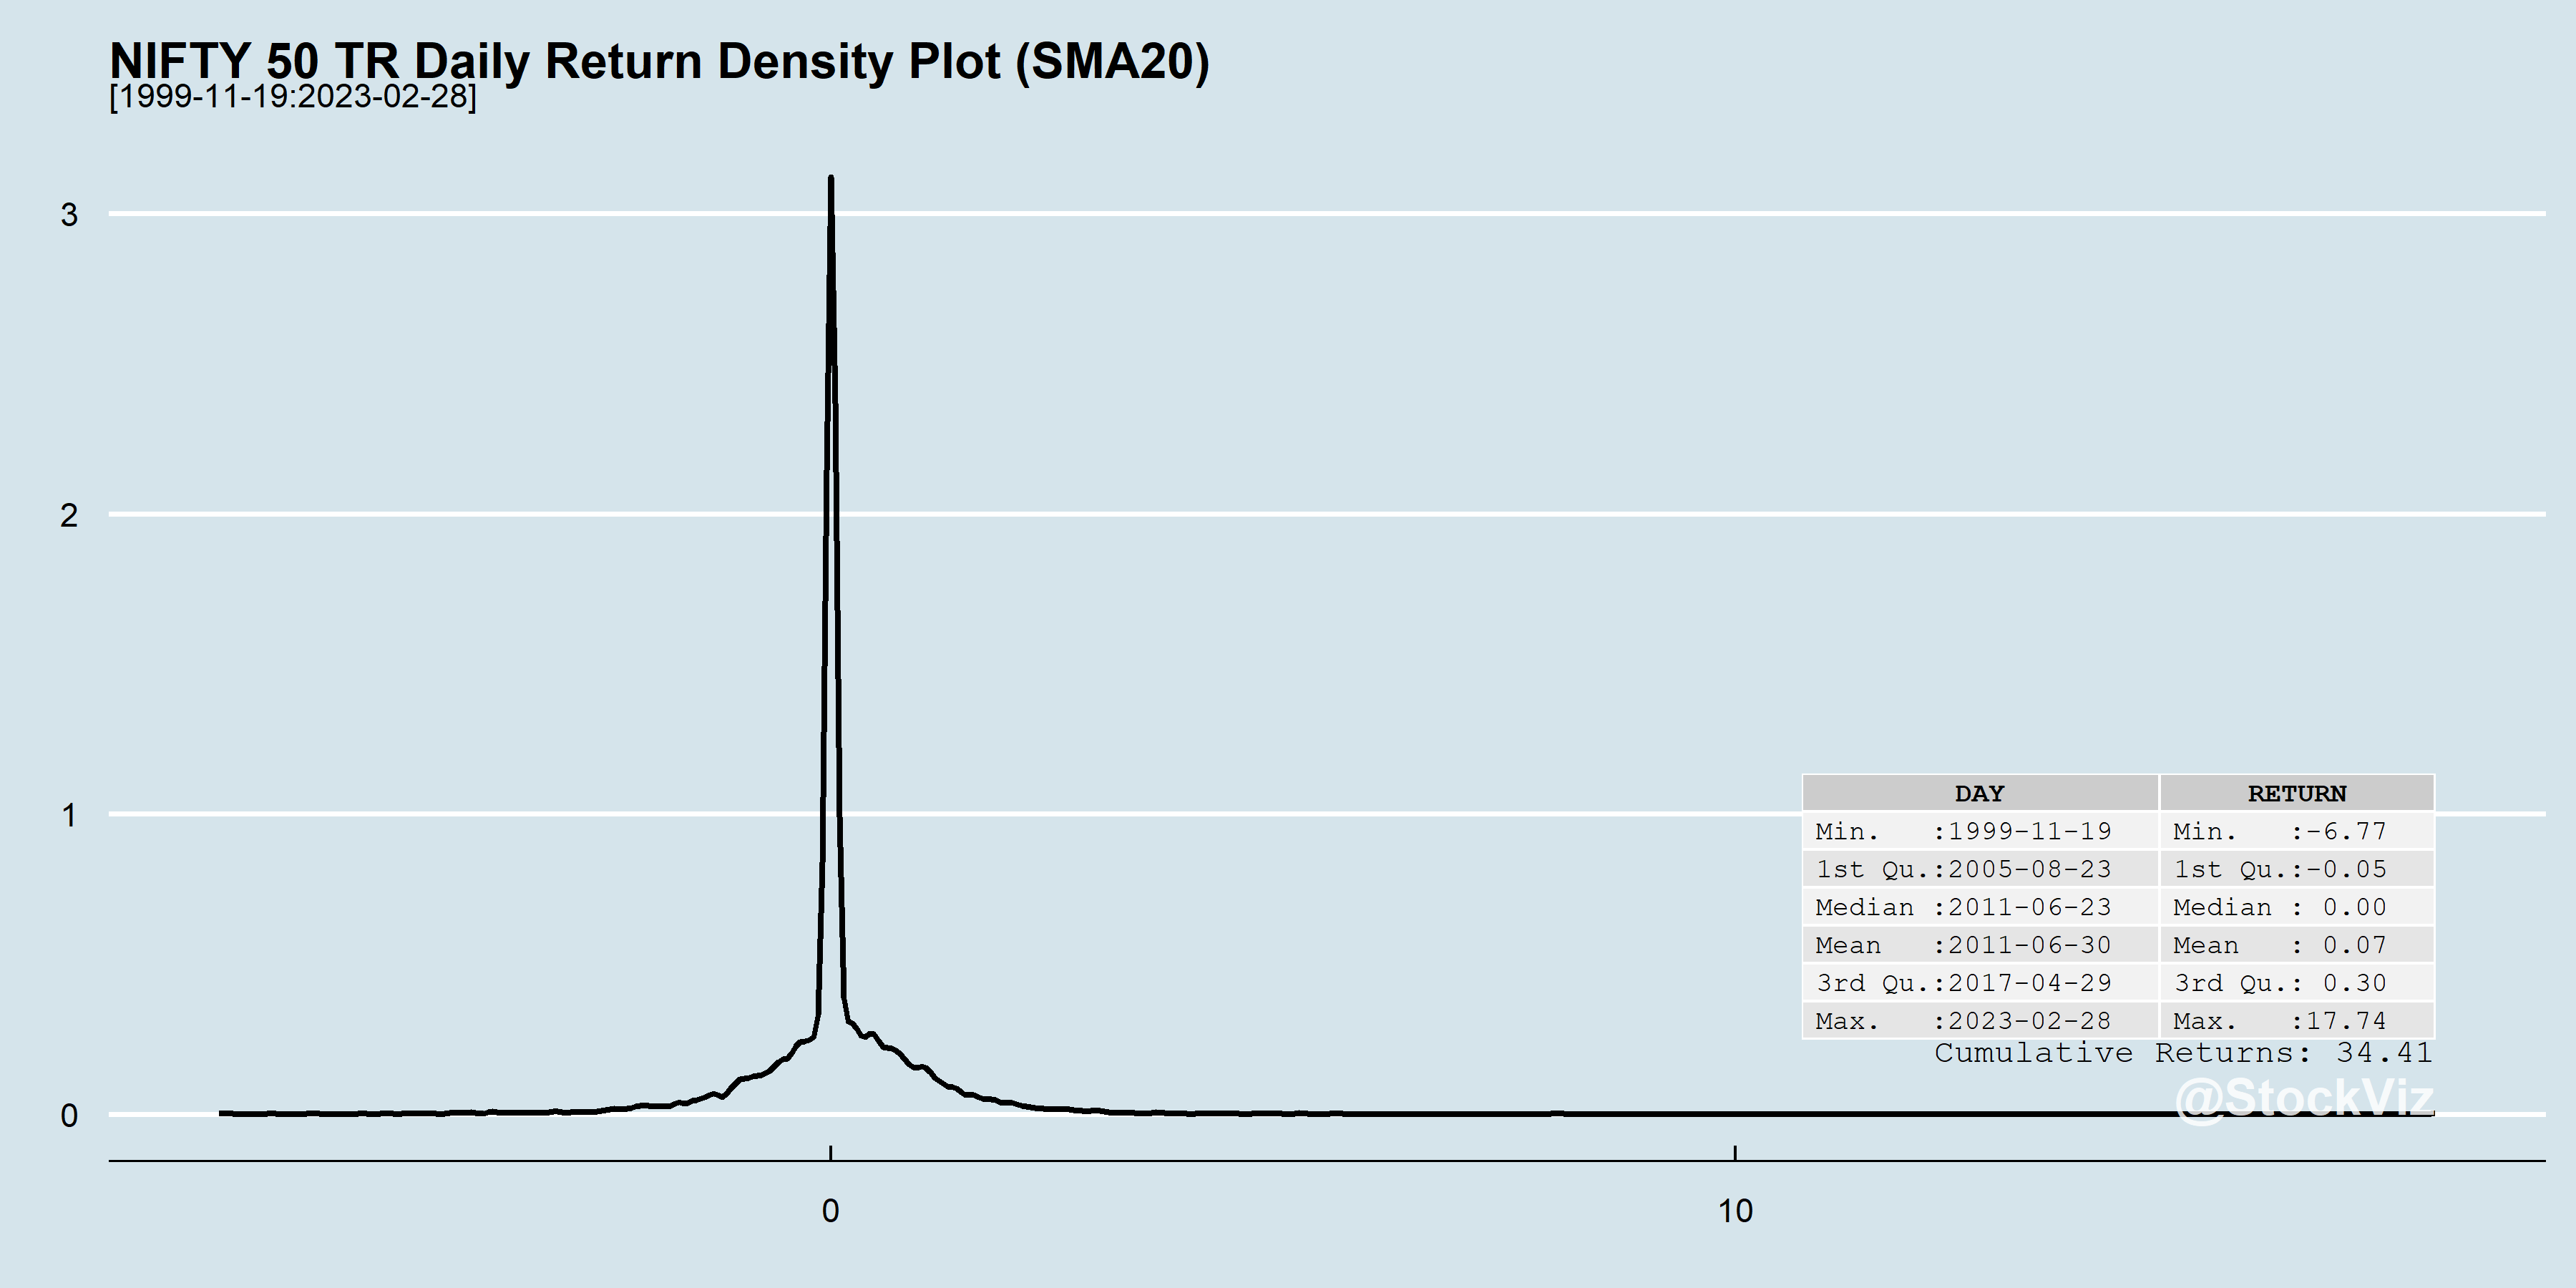
The average daily return of the NIFTY 50 is 0.06%. The worst daily return is ~ -13% and the best is ~18%. Welcome to tail-risk.
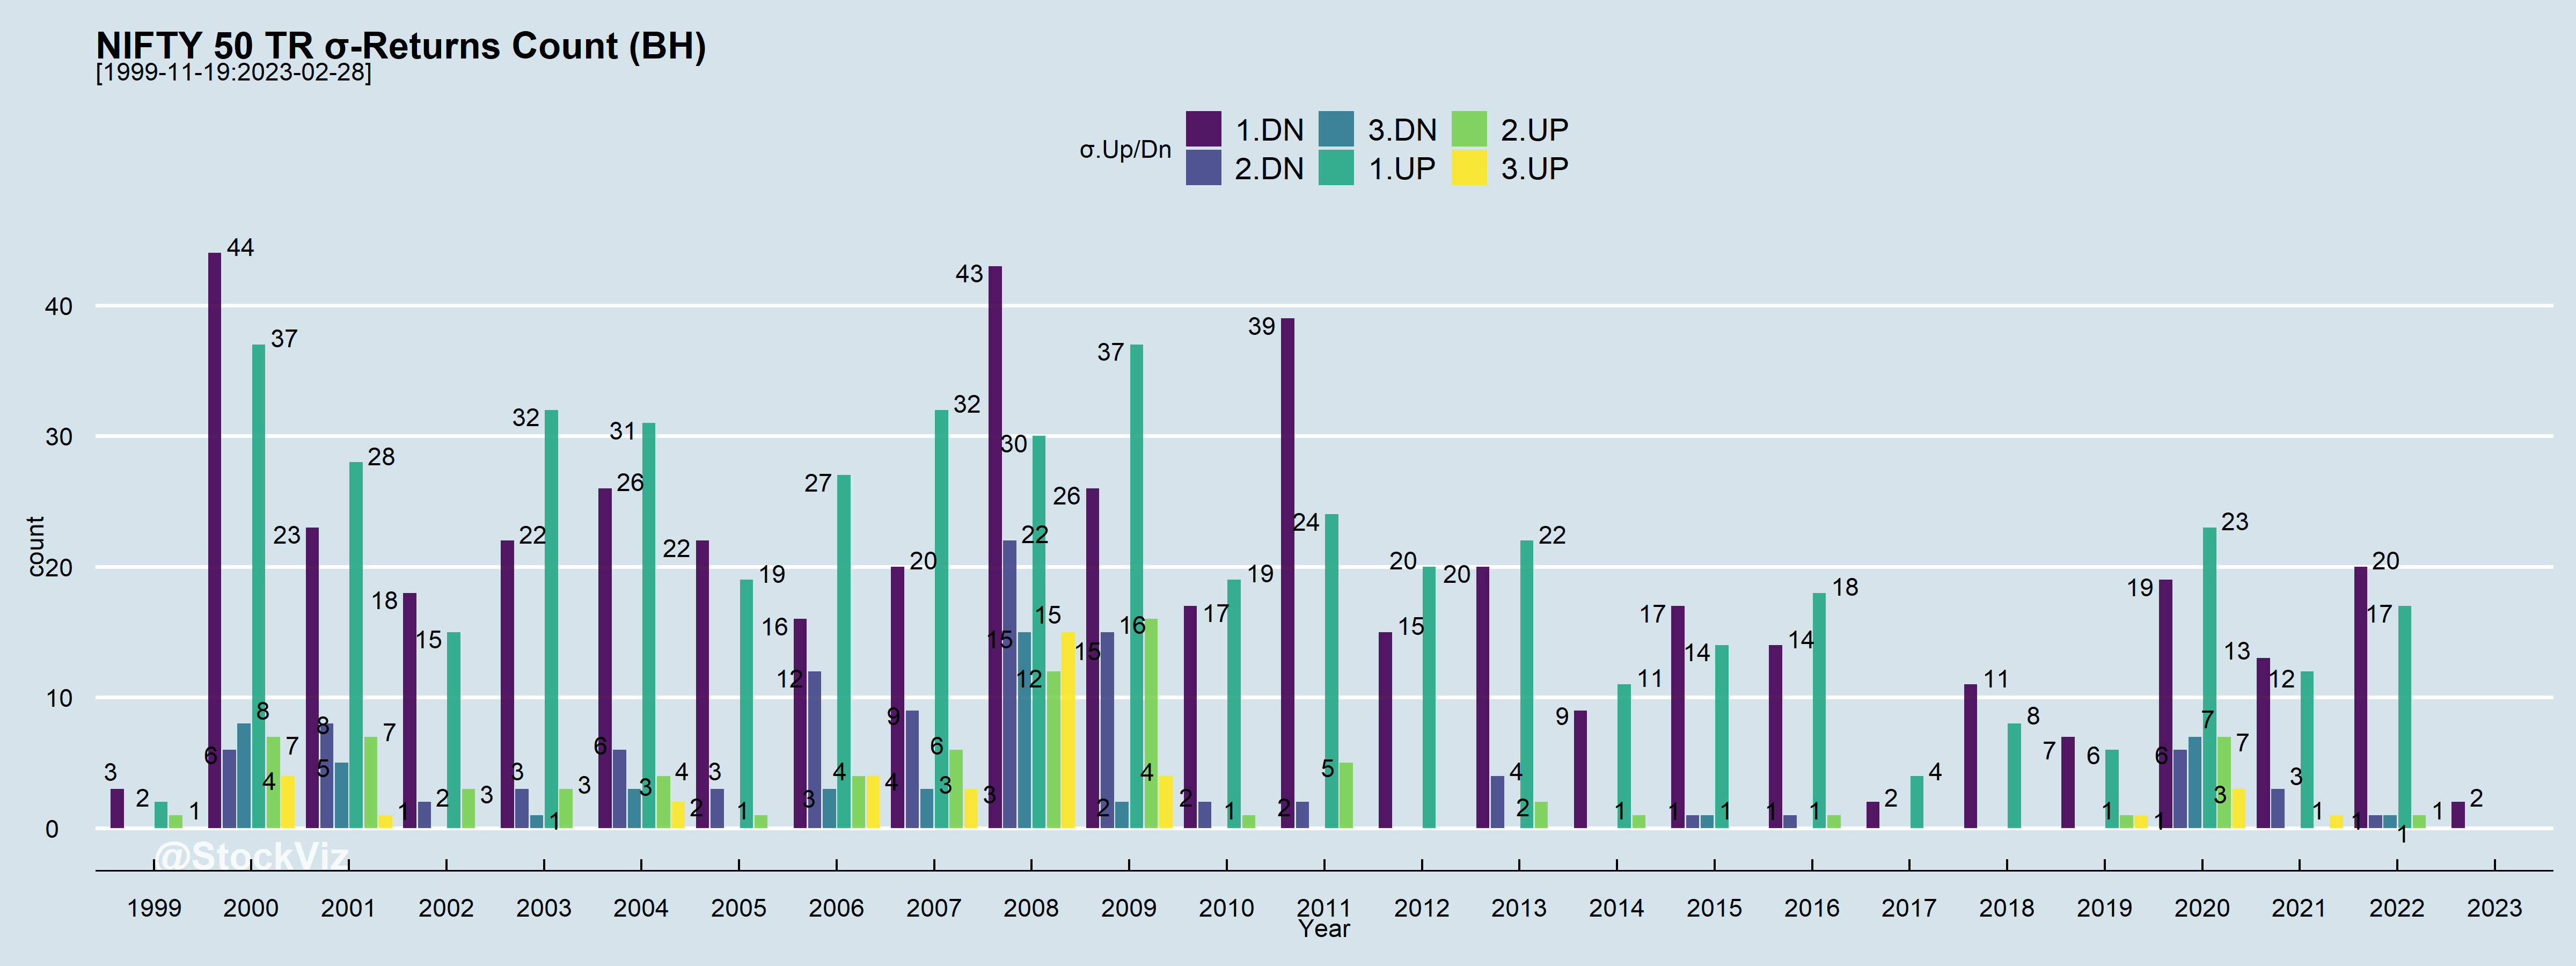
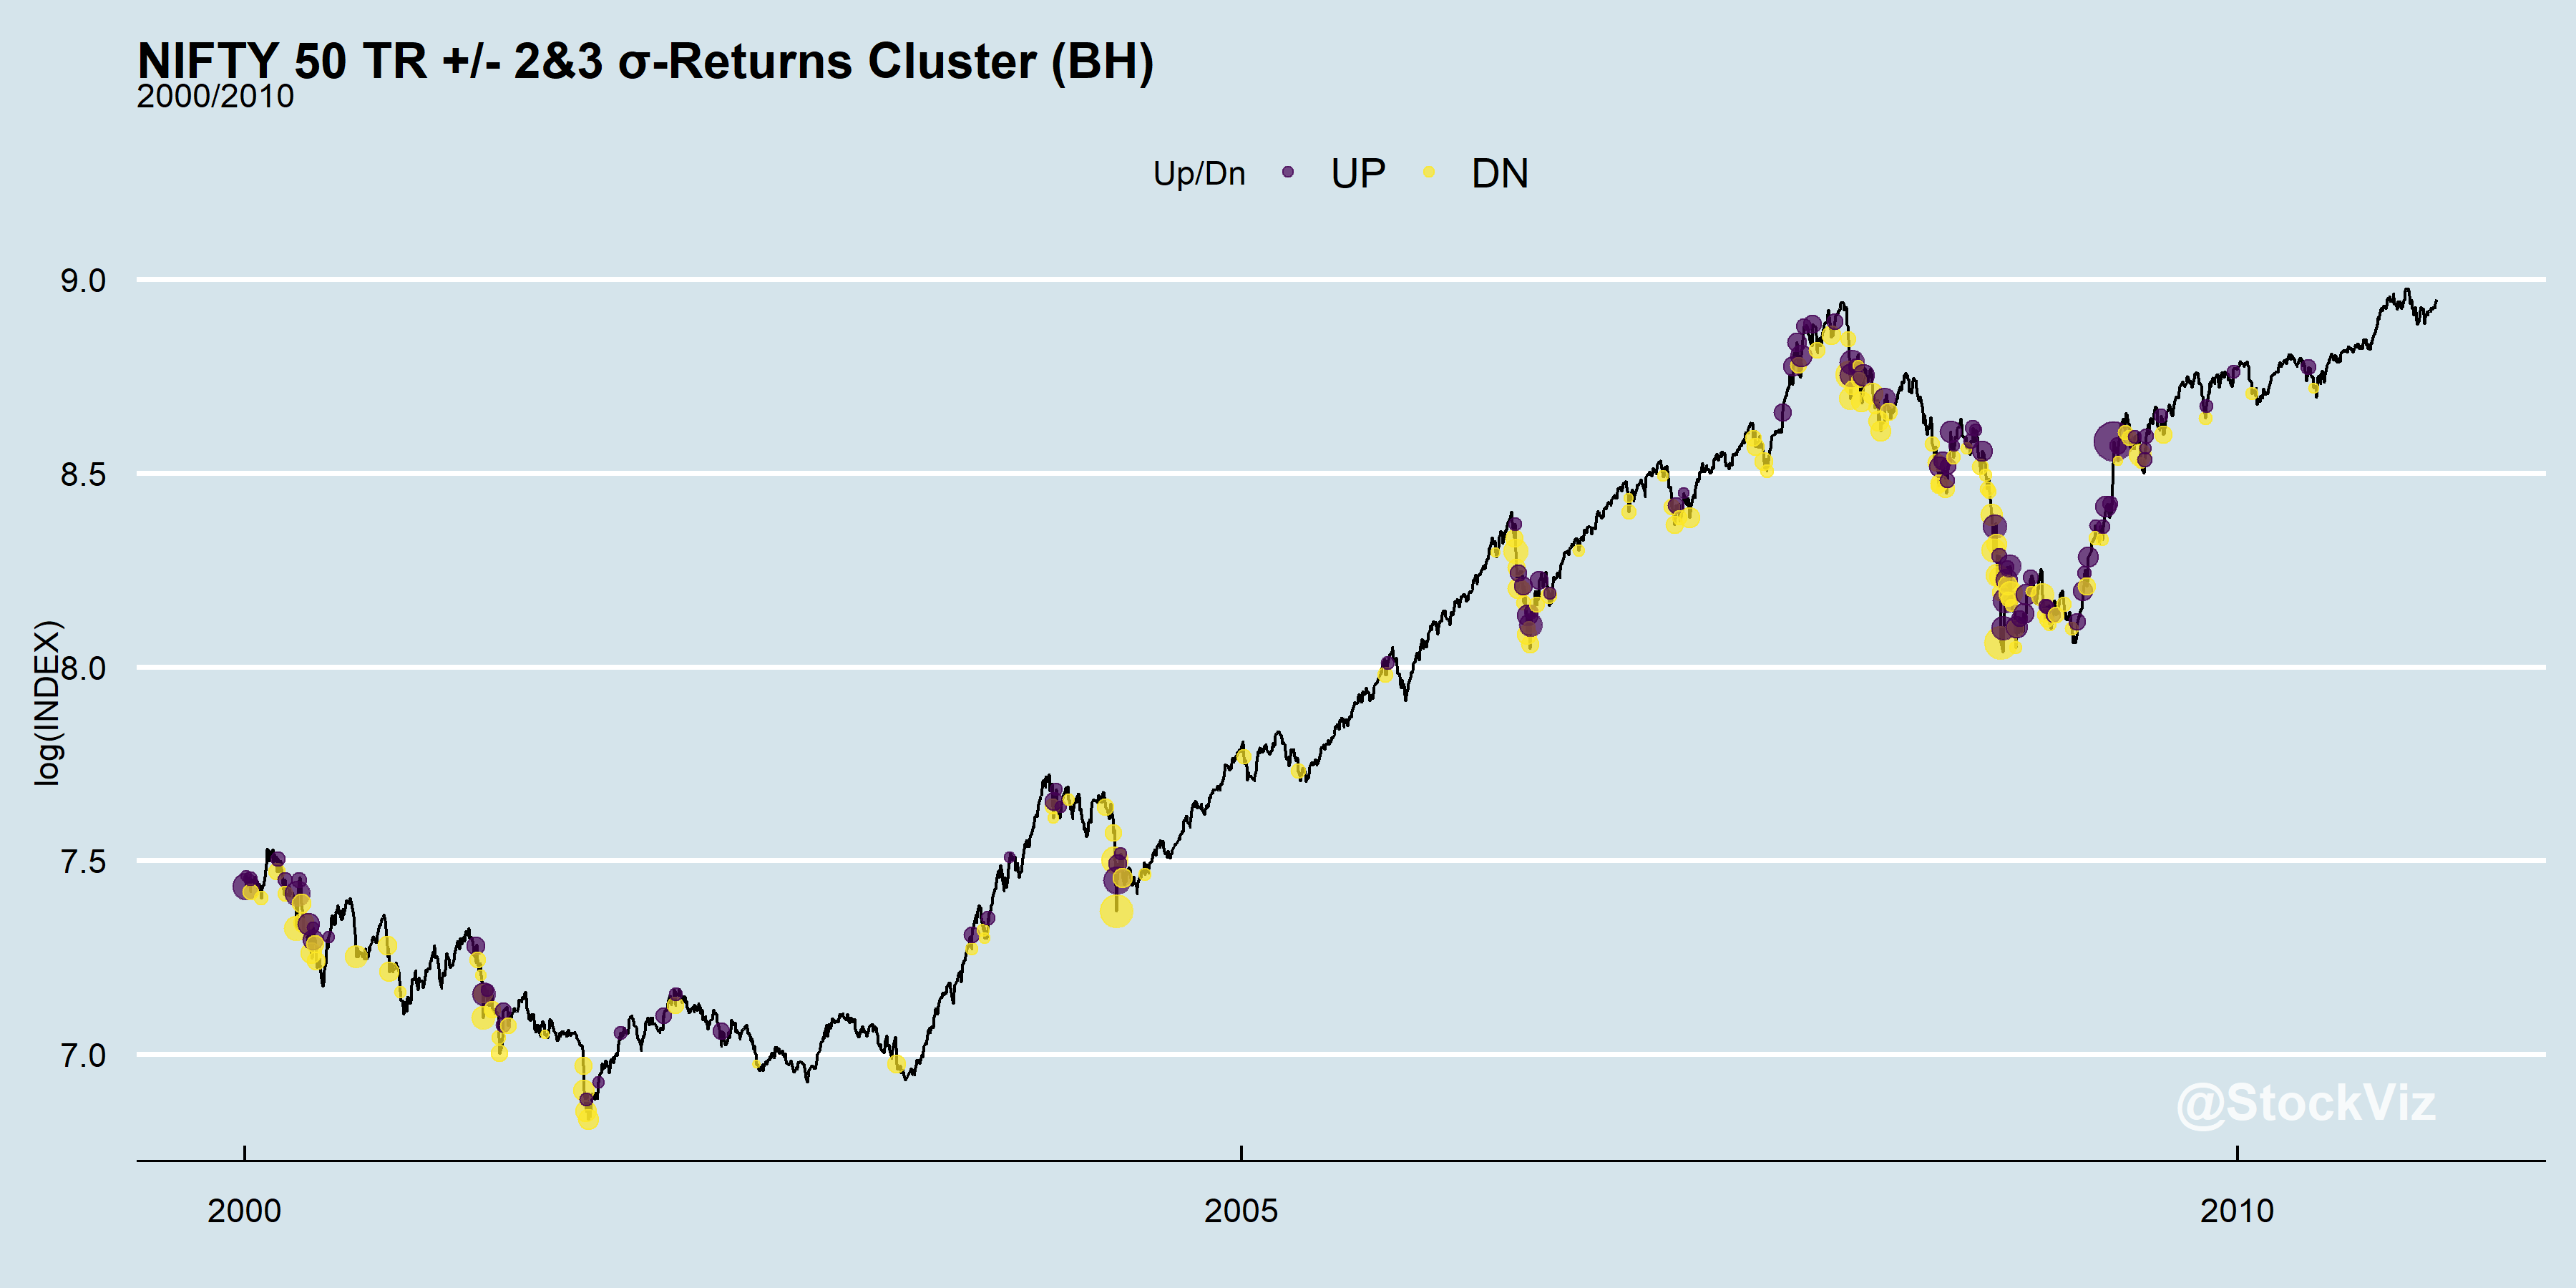
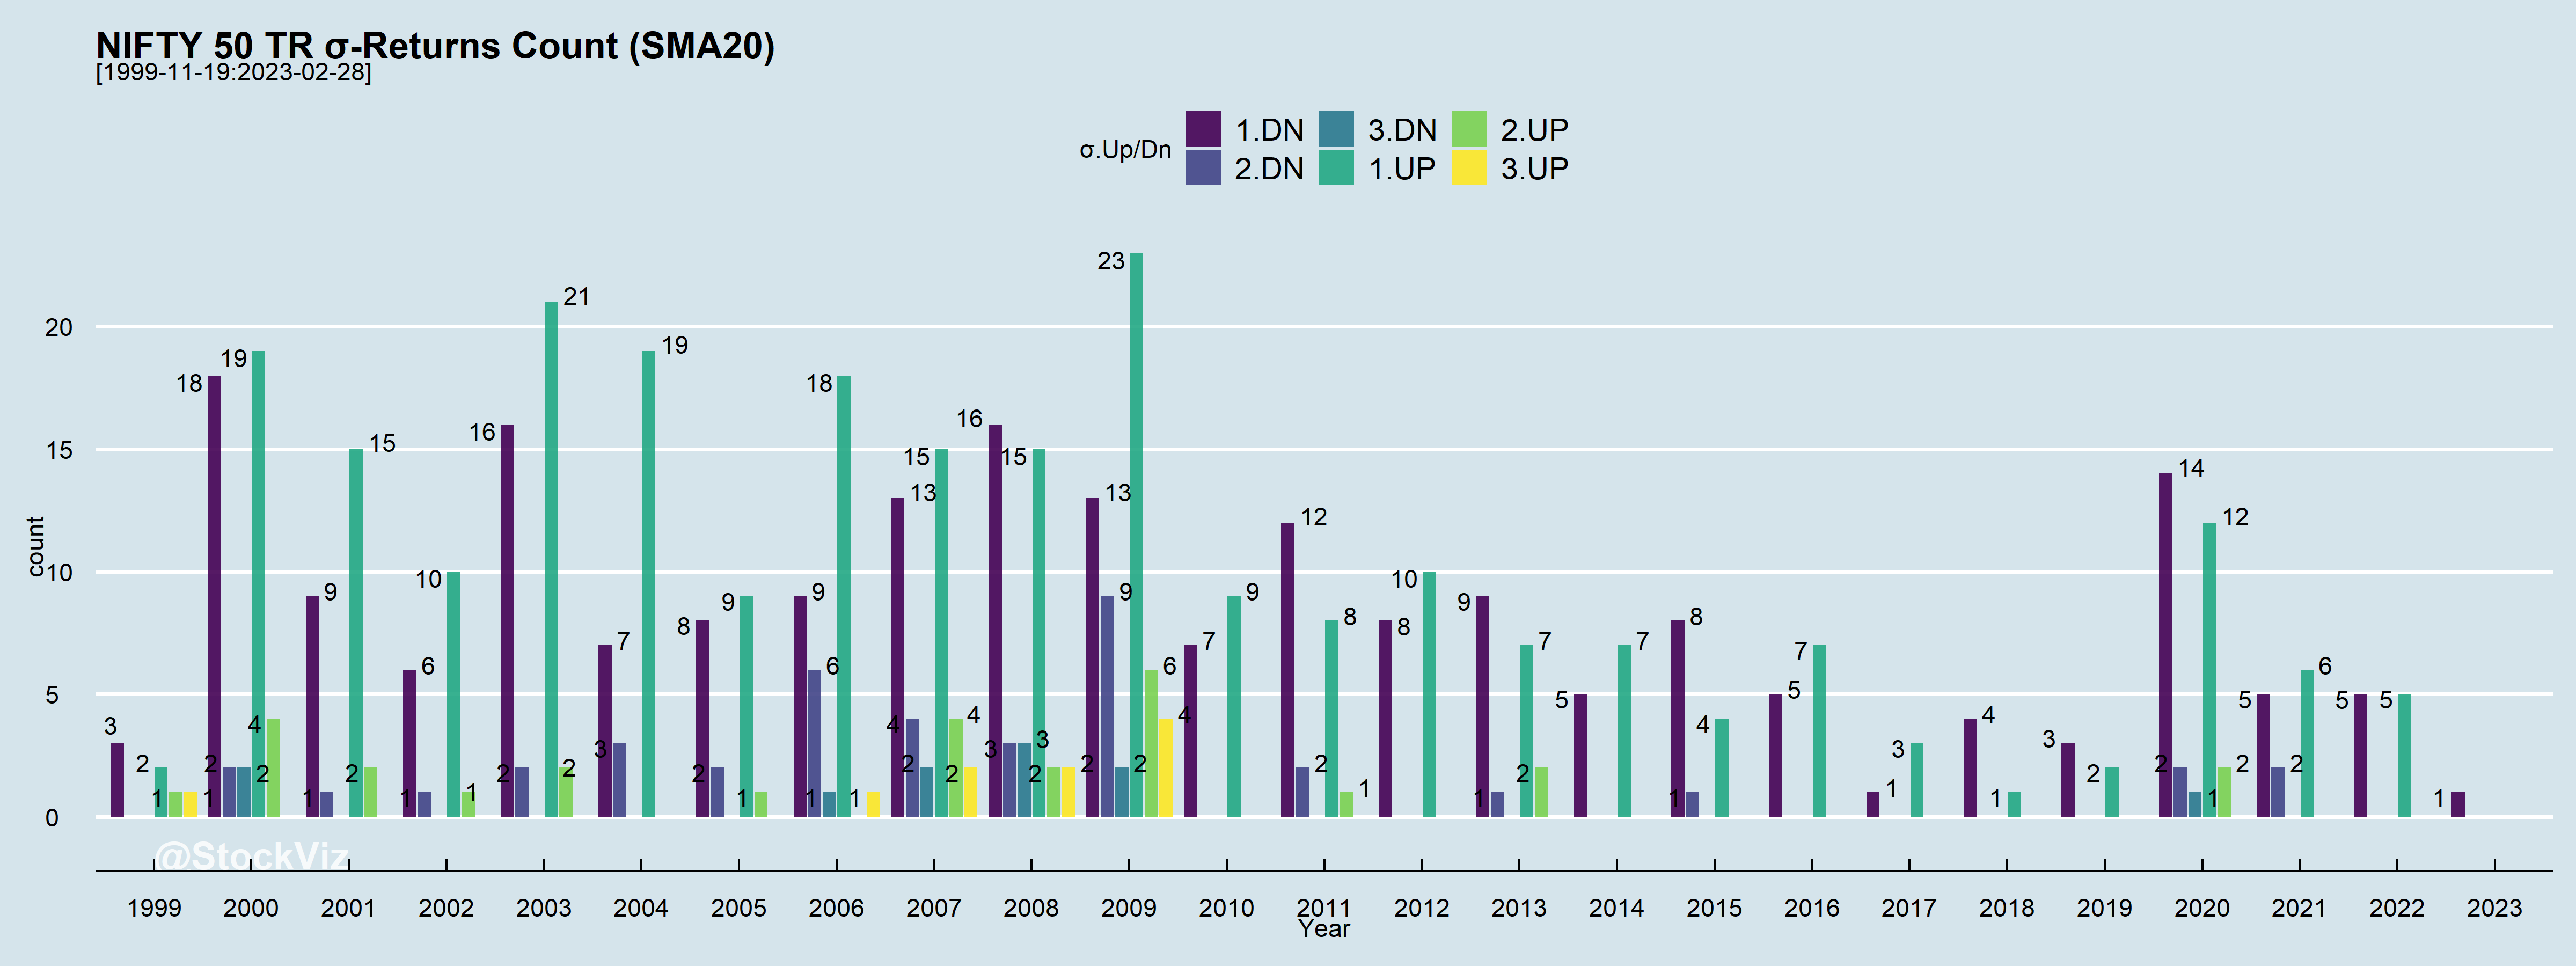
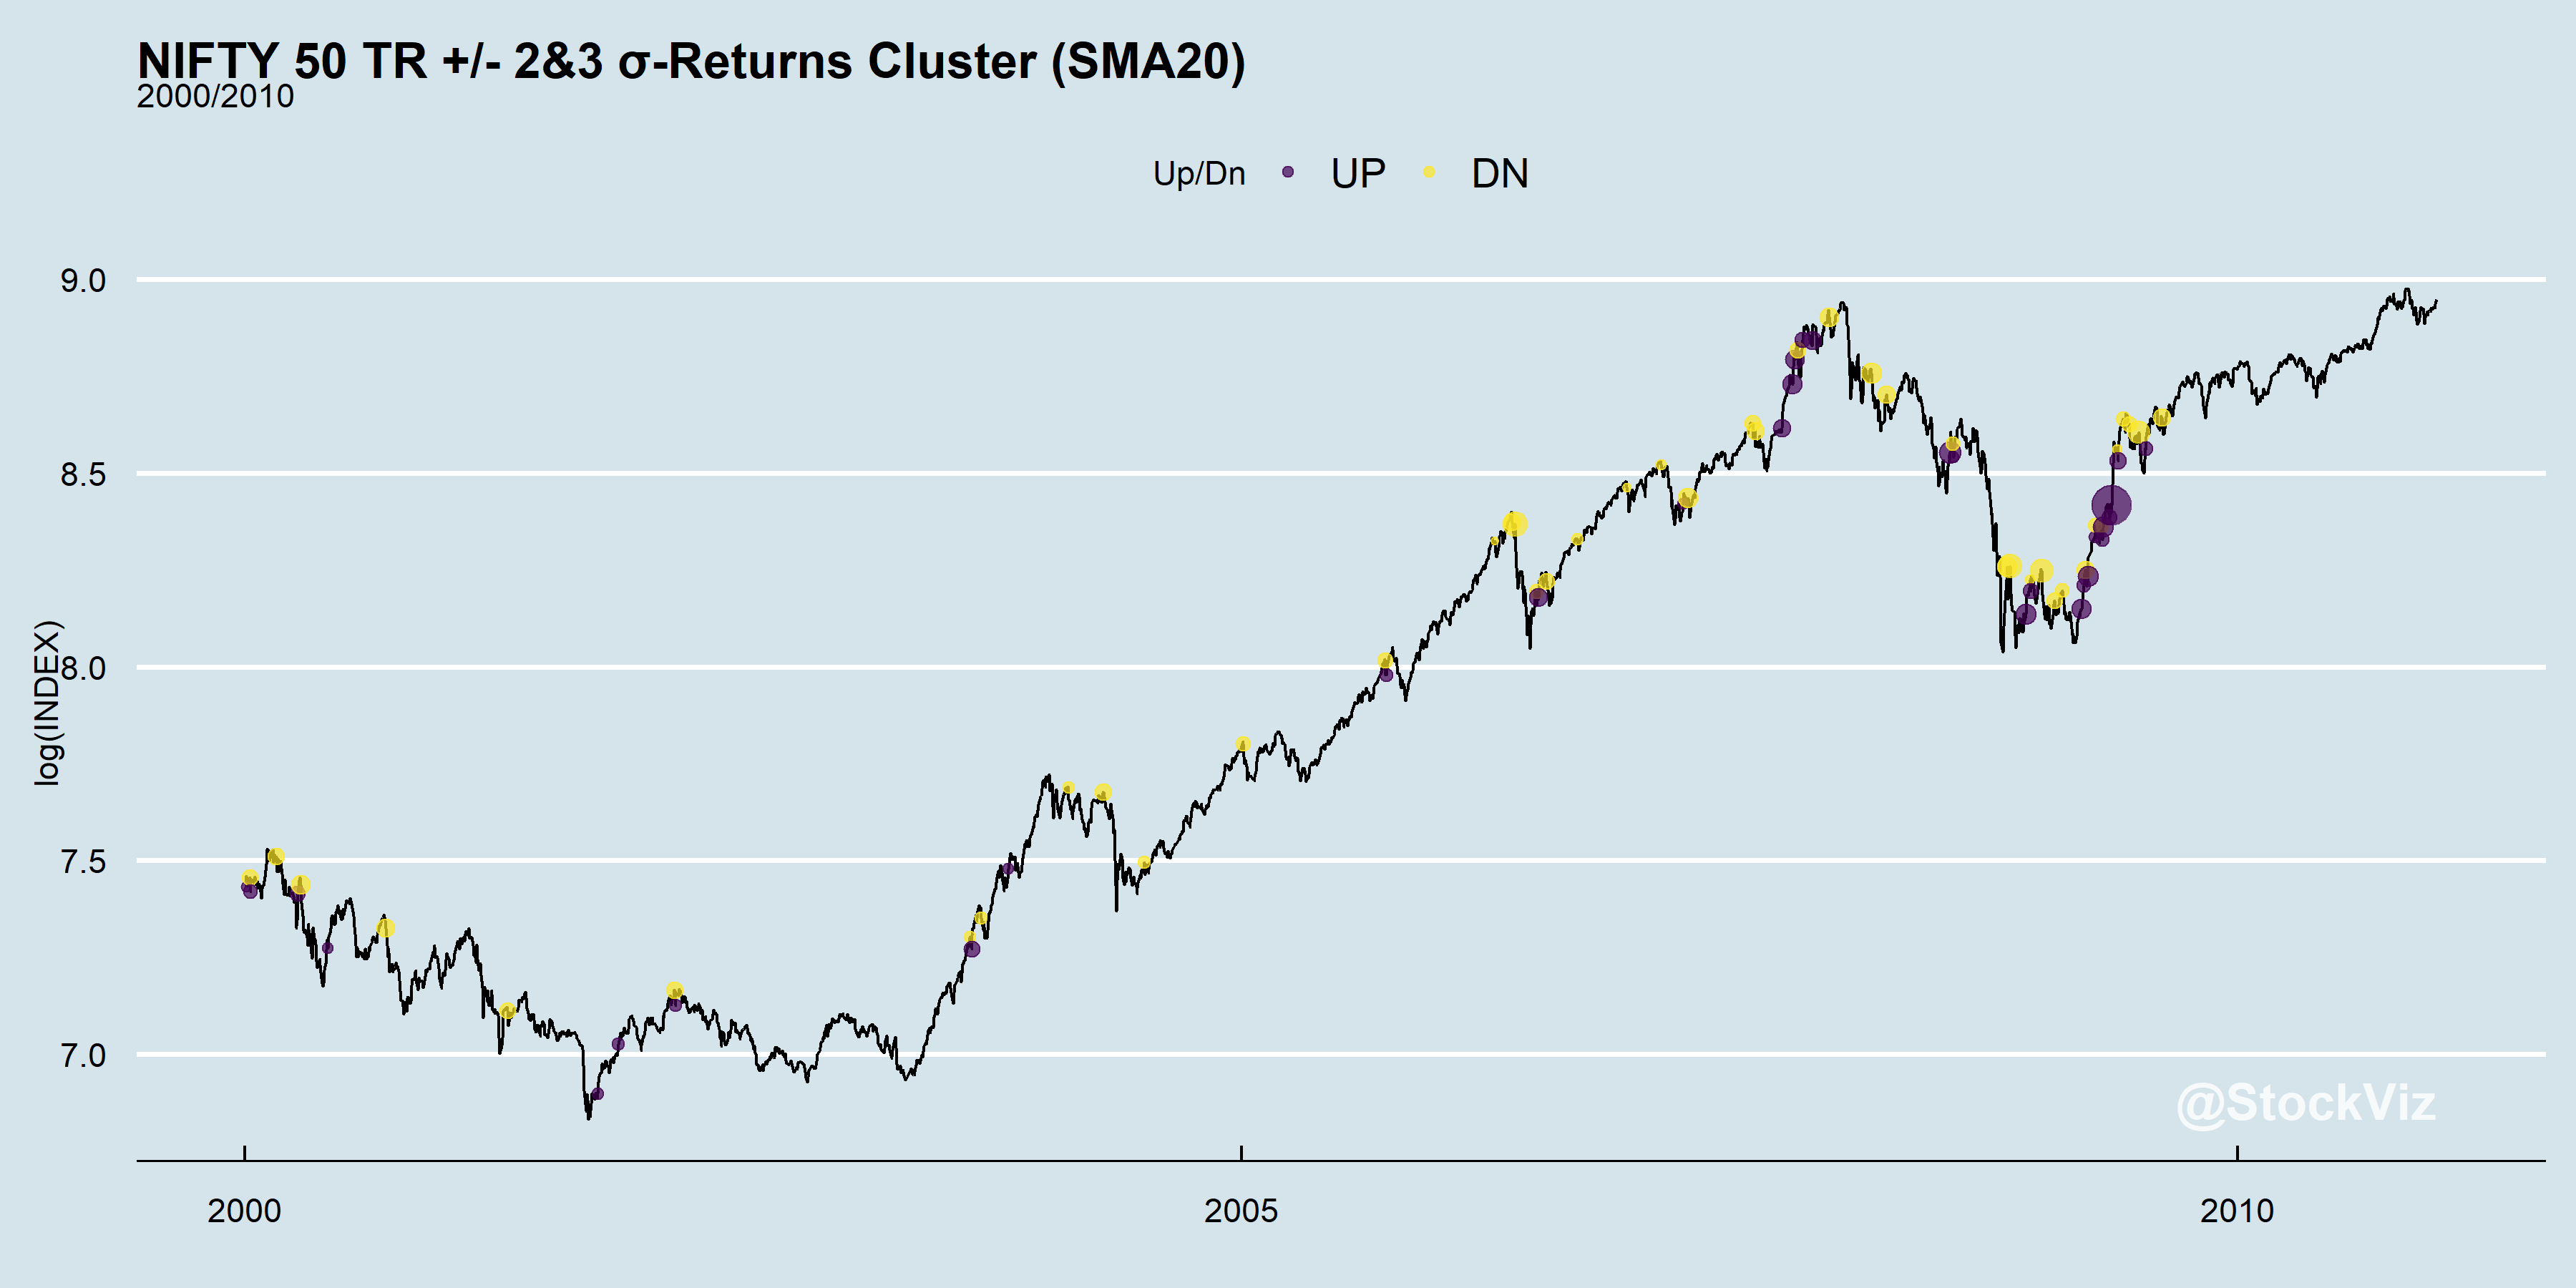
In any given year, there are a lot of days when returns fall out of 1, 2 or even 3 standard deviations (σs), Up and Down.
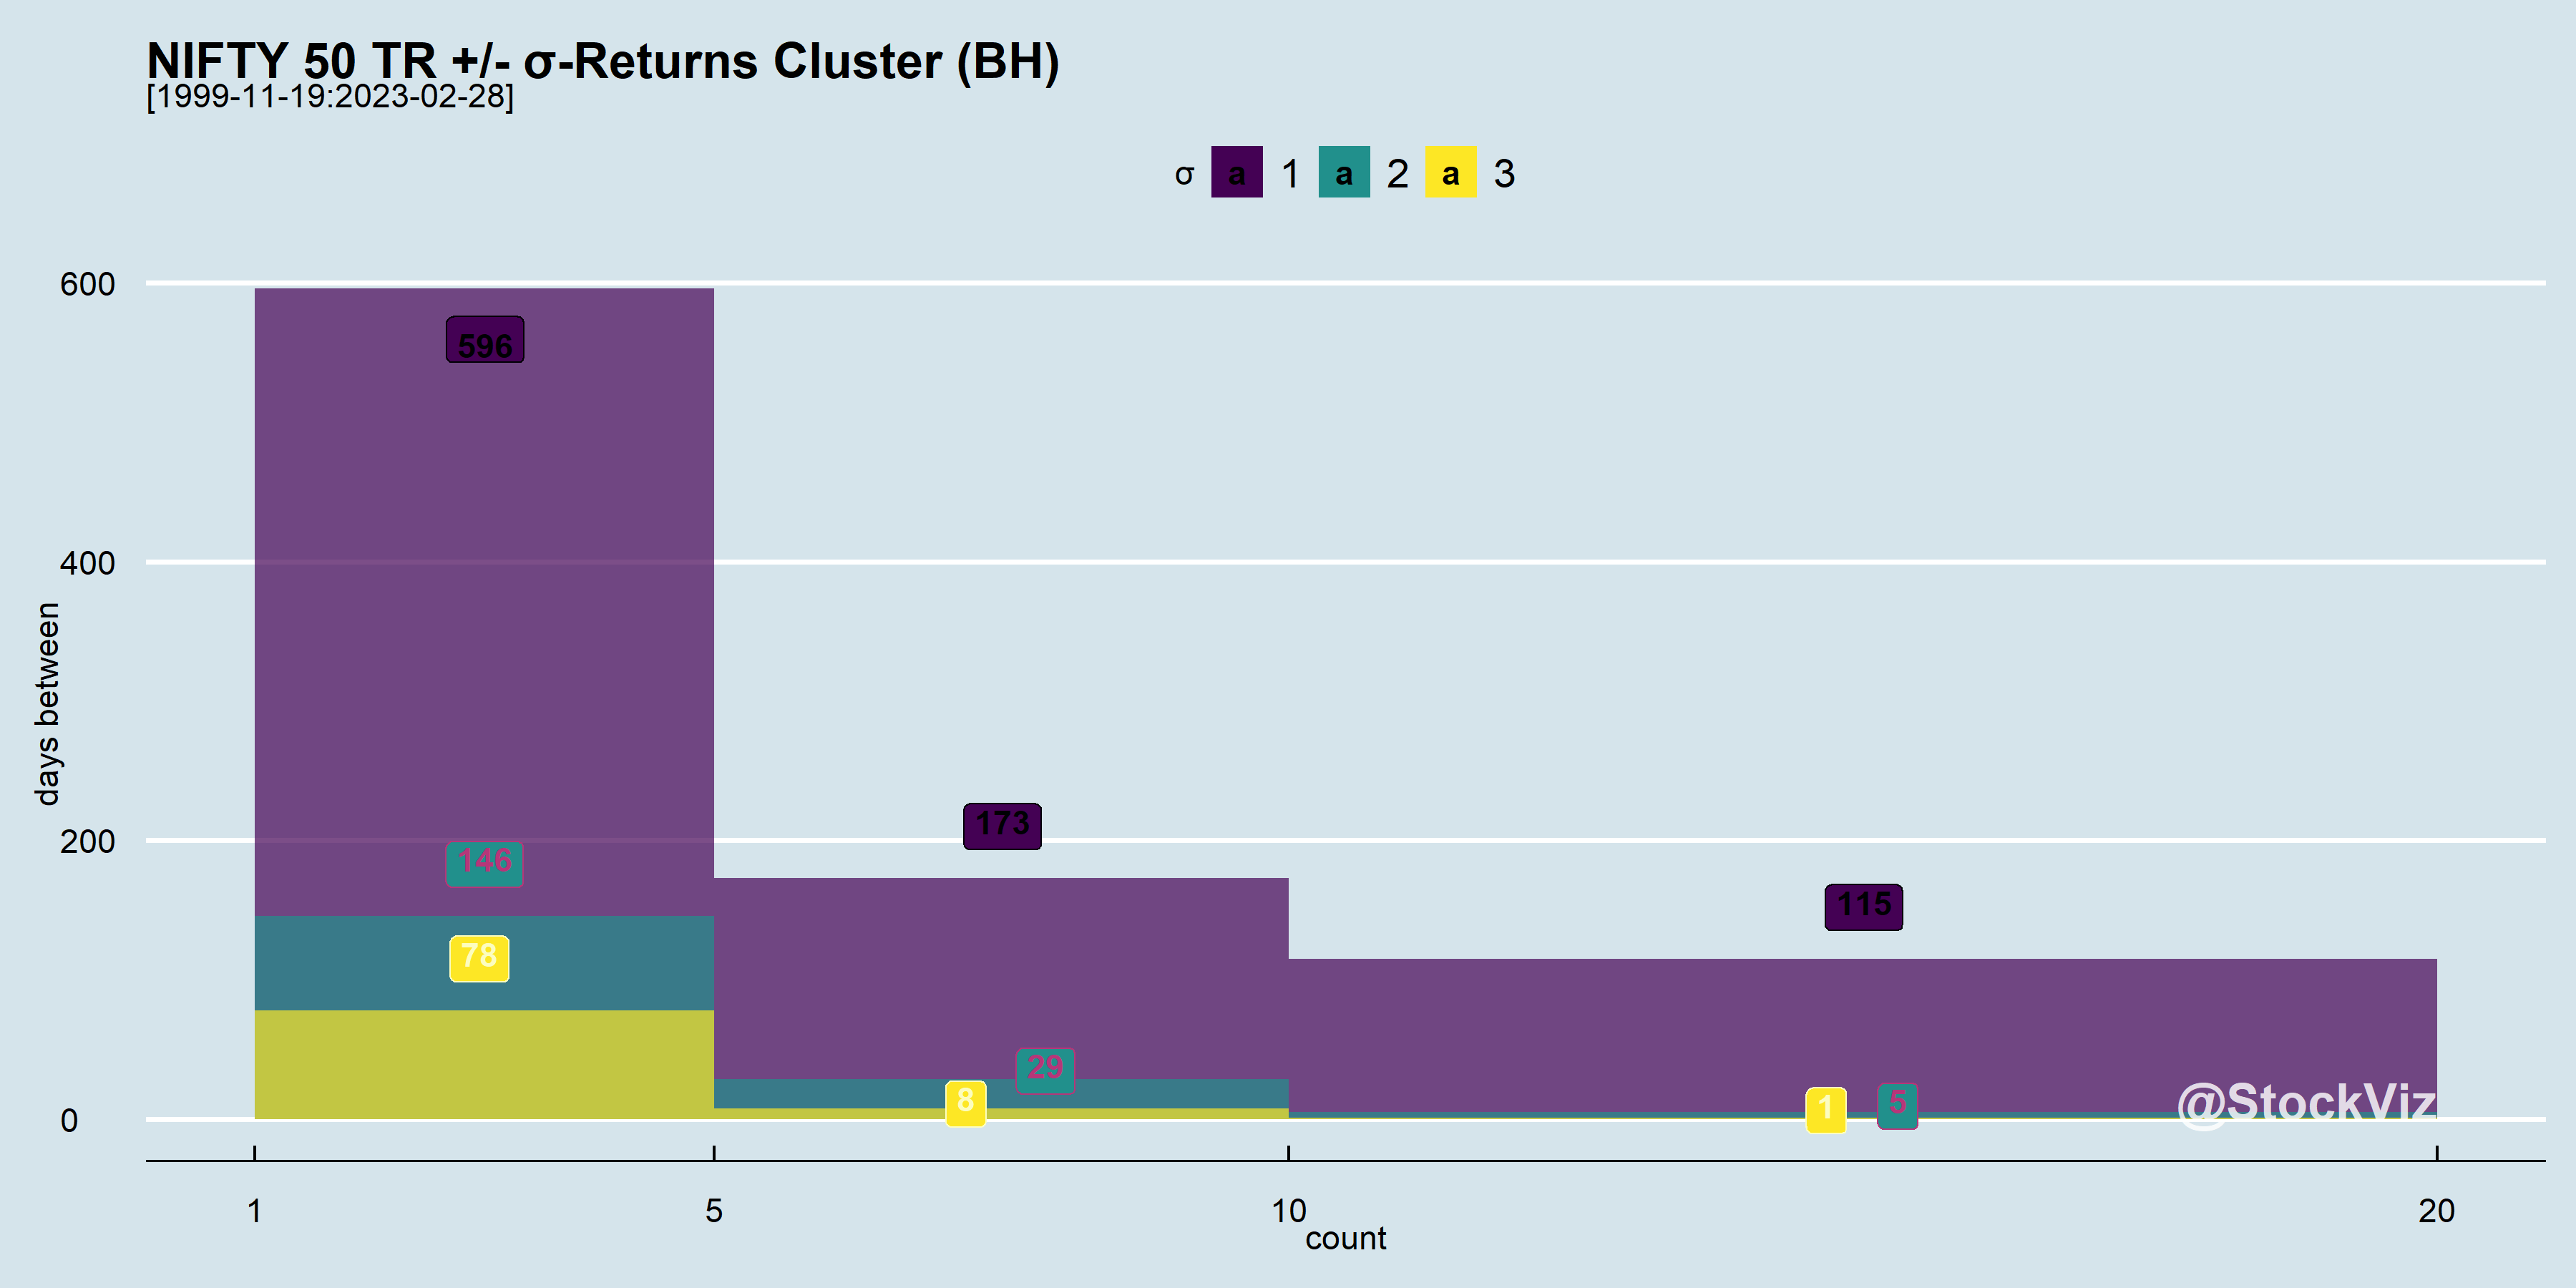
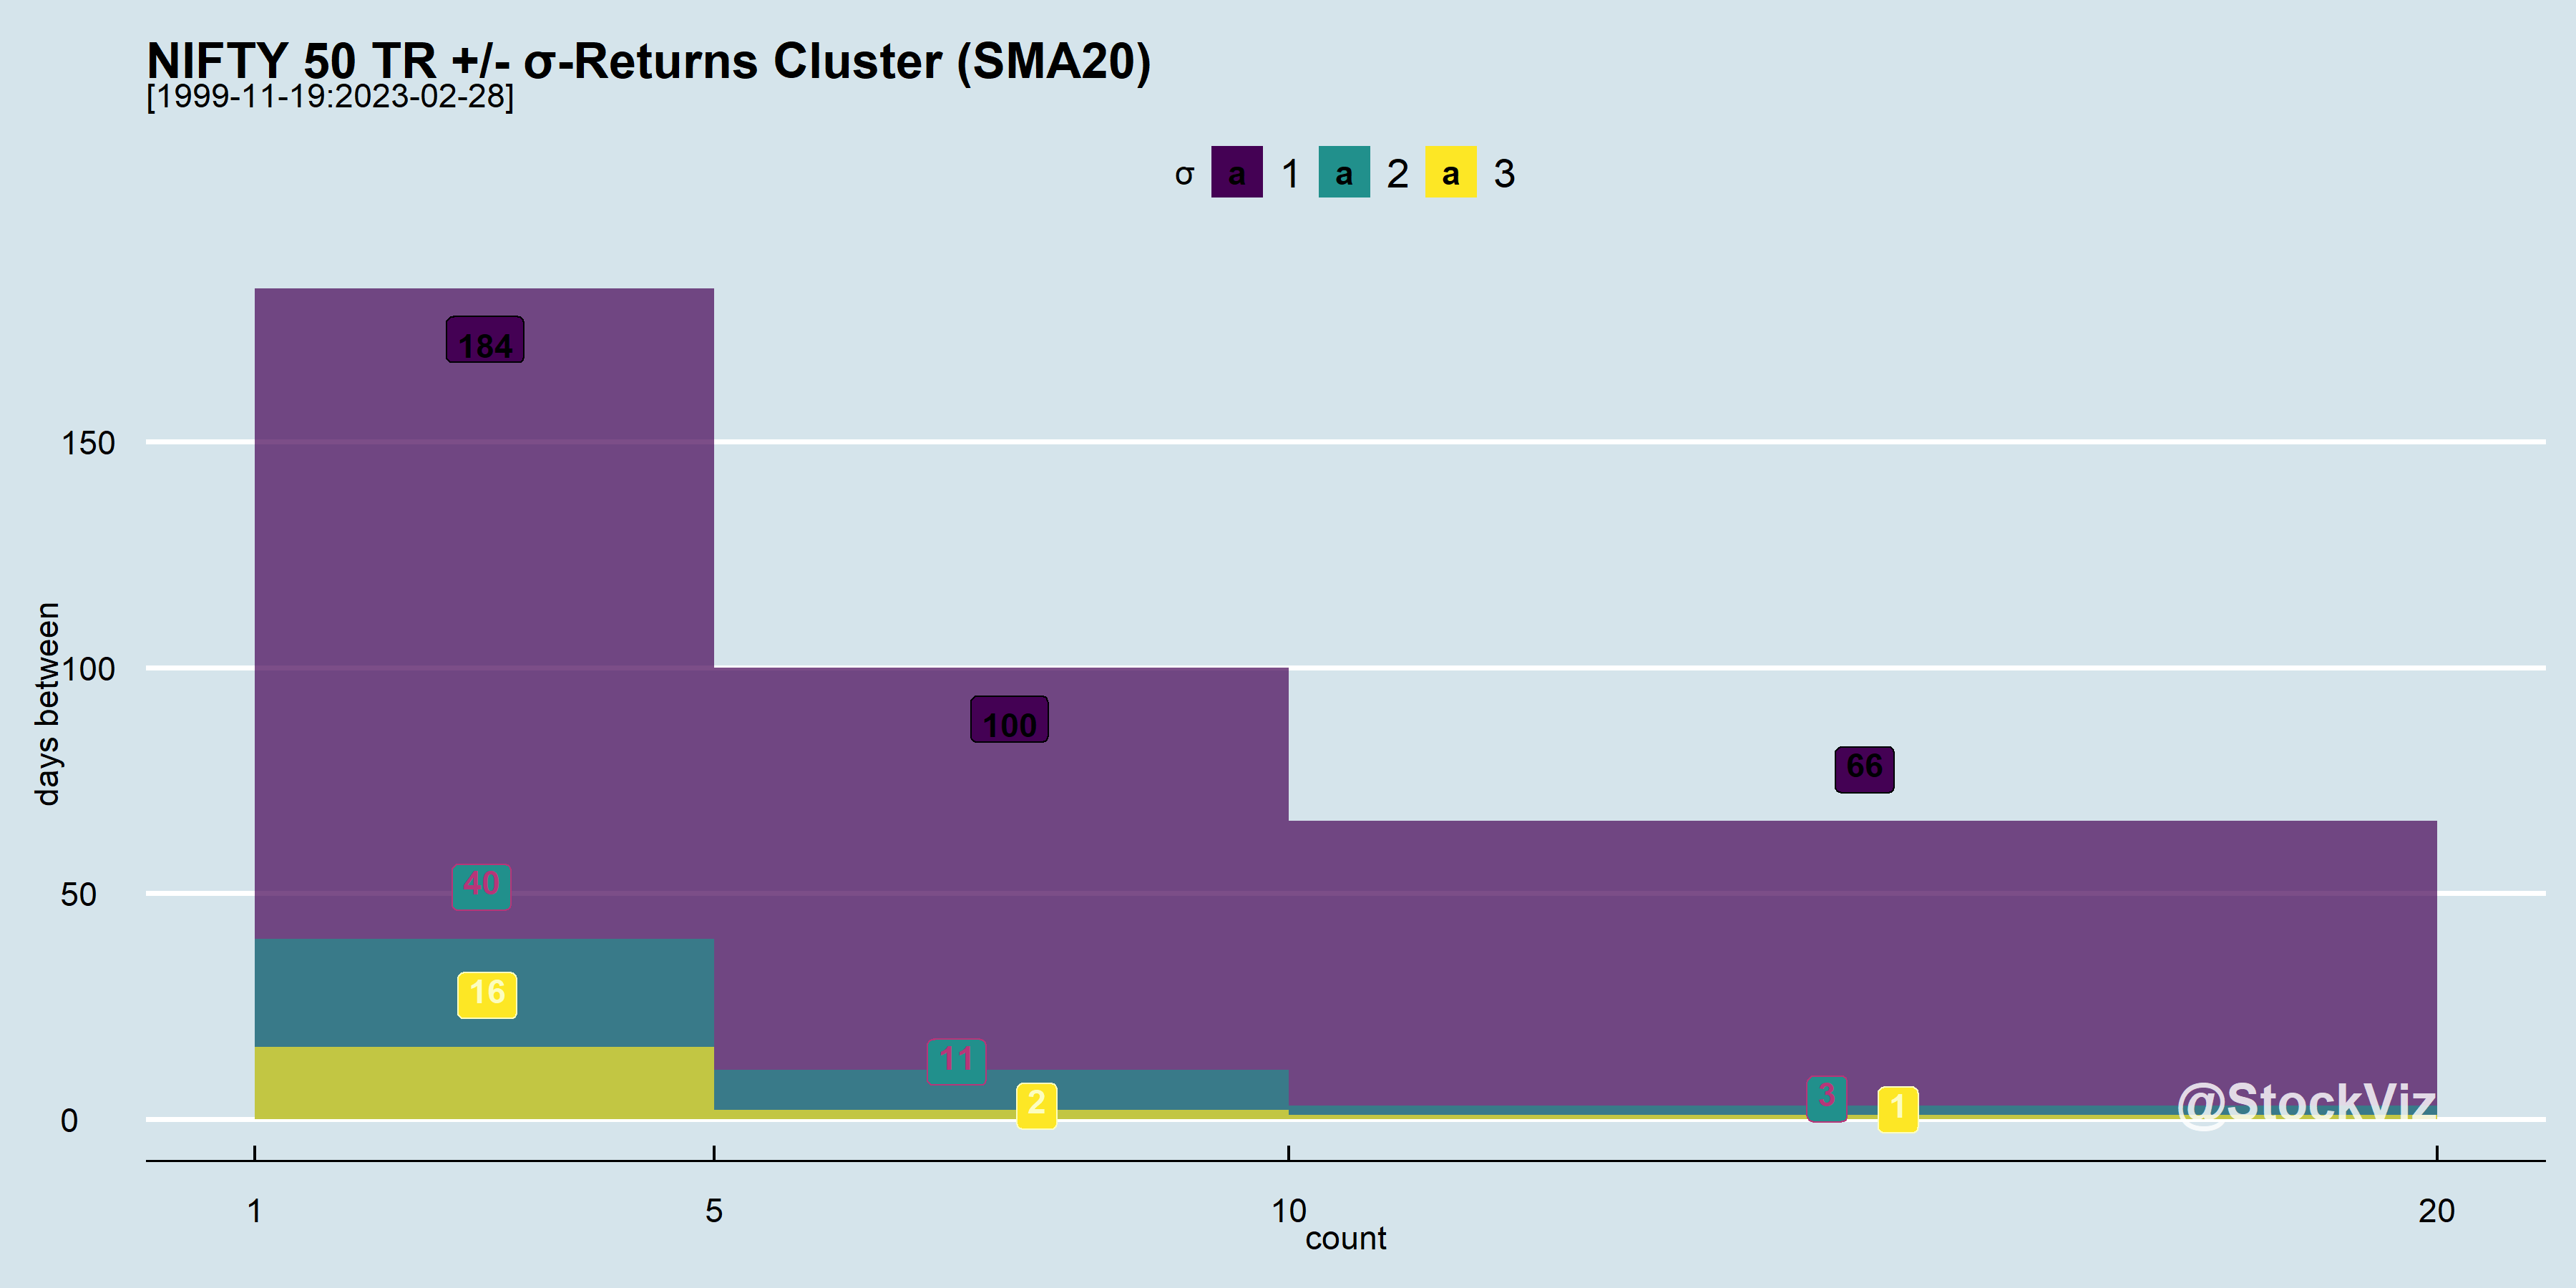
And these σ moves tend to happen close to each other. i.e., volatility clusters.
What the histogram above is showing is that most of the 3σ moves have happened within 5 days of each other! Let’s zoom in on a 10-year period of the index and mark the outliers on it:
Now, lets pick a very simple actively managed strategy that tries to side-step the –σ moves. The details of the strategy itself is unimportant. Suffice to say that it creates excess returns compared to buy & hold.
The average daily return of this strategy is 0.07%. The worst daily return is ~ -7% and the best is ~18%. At least some of the left-tail has been clipped but at what cost?
Notice how both the number of large Up and Down days are lower here compared to buy & hold?
Outliers still cluster but there a lot less of them.
This is the nature of market volatility. Investors have to either commit to buy & hold and catch all the moves or commit to an actively managed strategy knowing that while trying to side-step –σ moves, some +σ moves will also be sacrificed. It is the FOMO that keeps investors switching between the two, resulting in sub-par returns.
Sharpe Ratios are often used to sort through competing investments. It is the original “risk adjusted returns.” It’s a mathematical expression of the insight that excess returns over a period of time may signify more volatility and risk, rather than investing skill (investopedia, wikipedia).
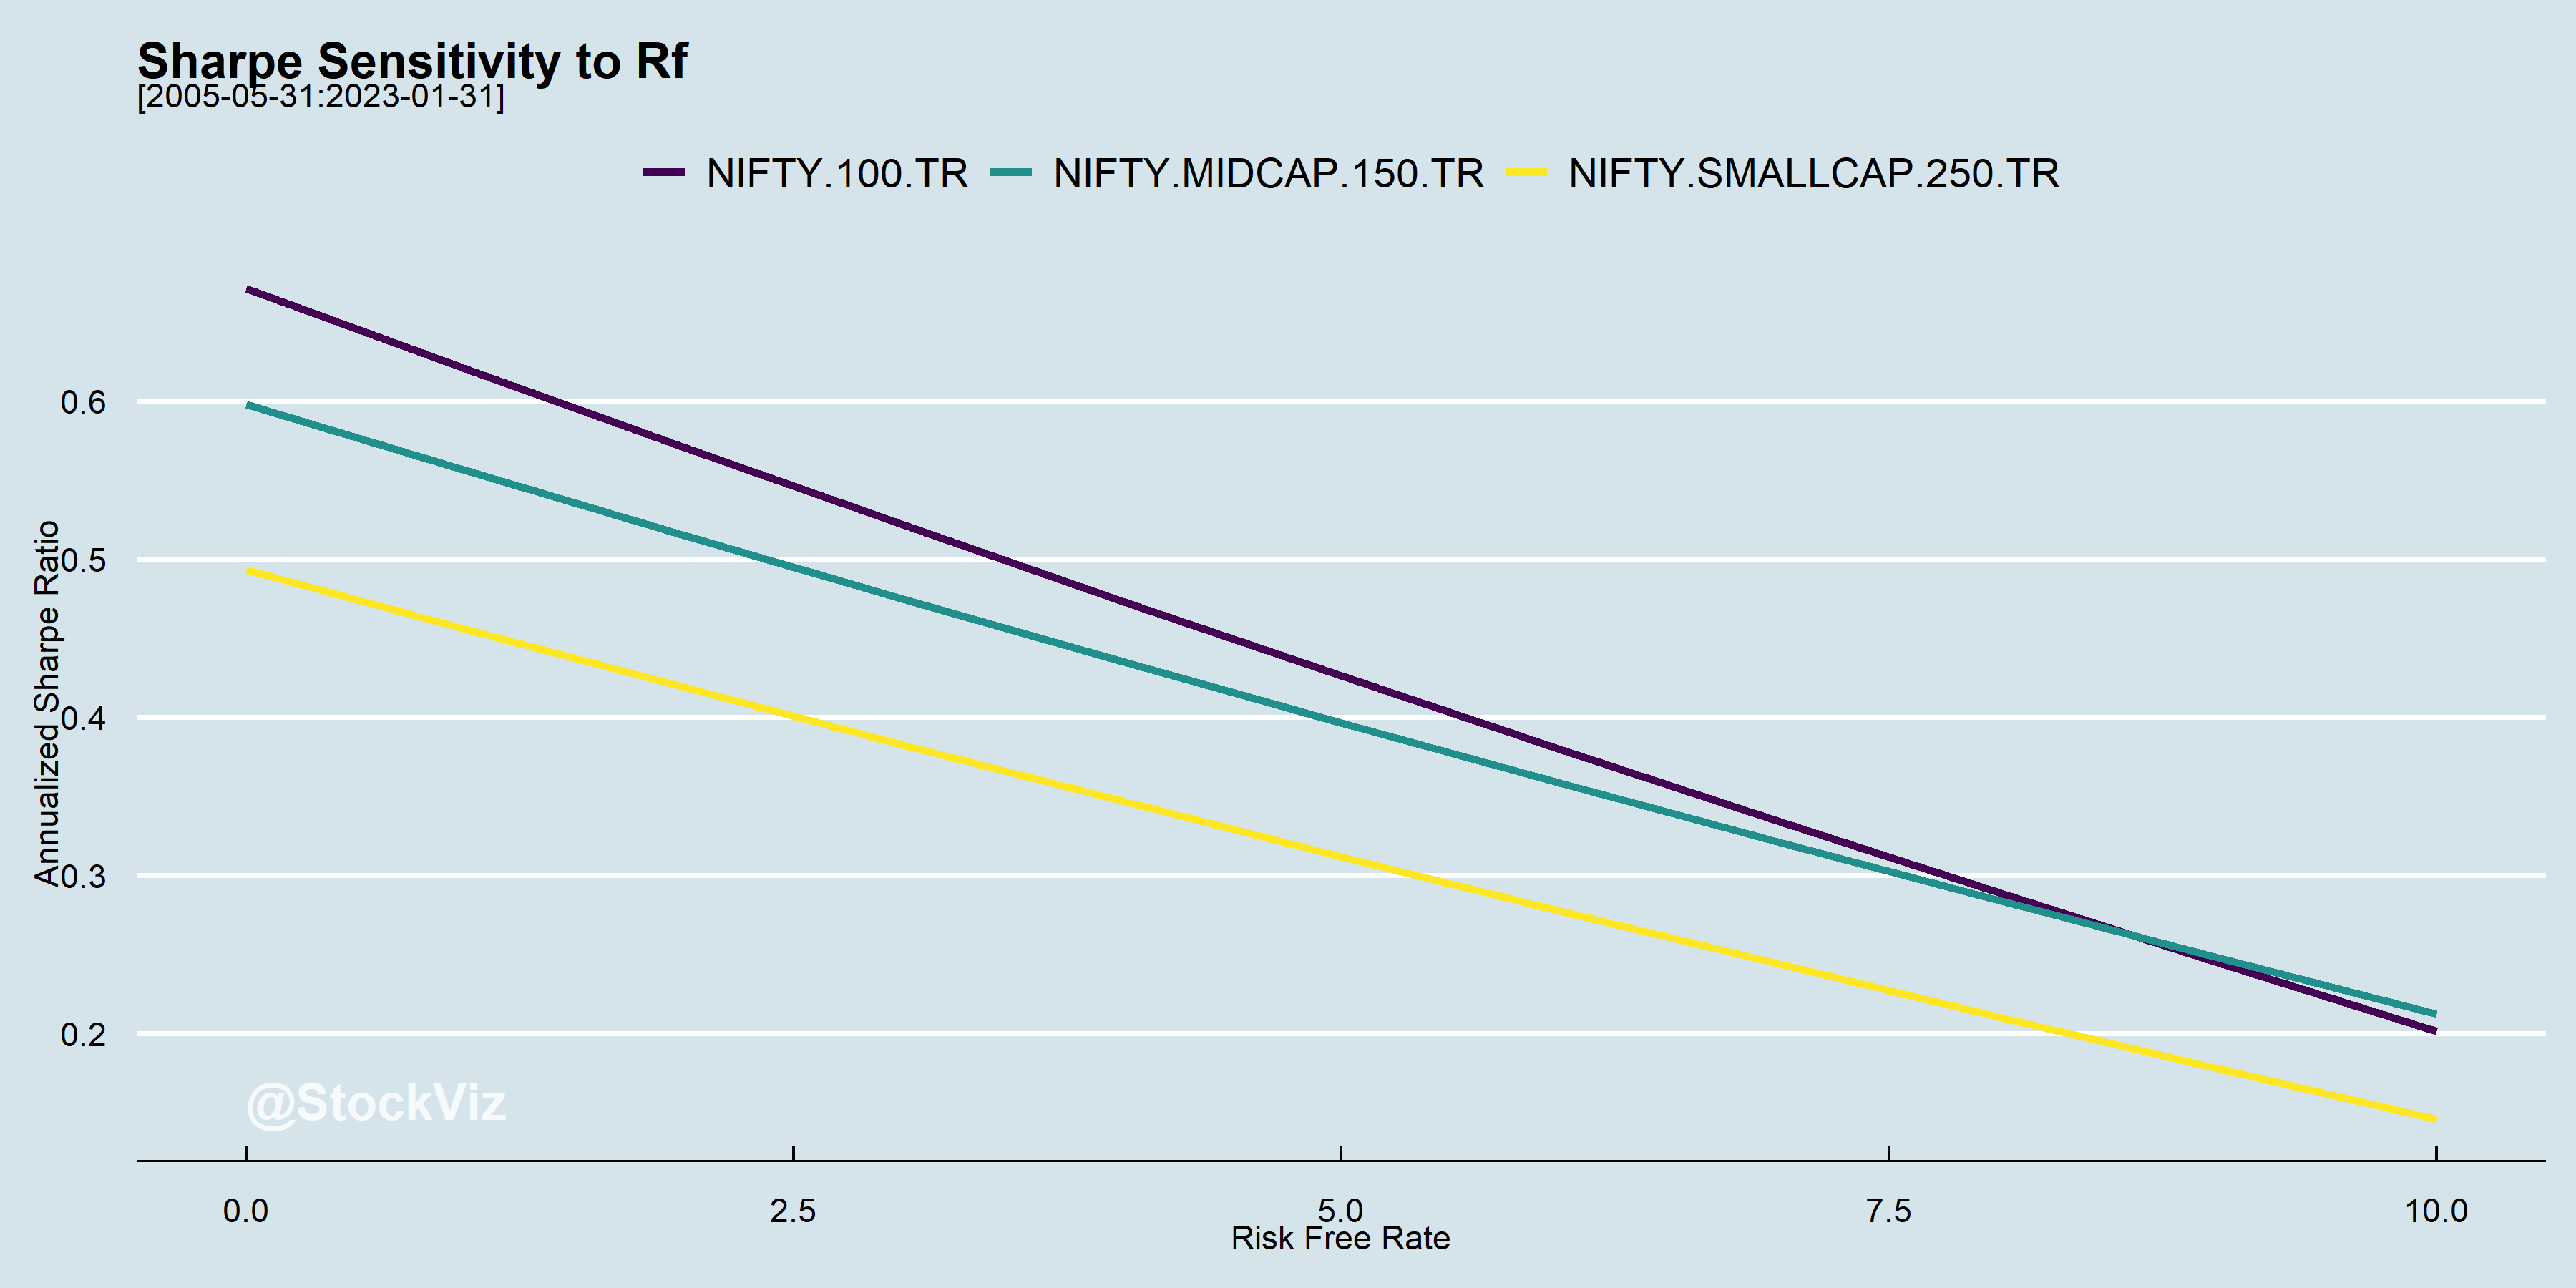
Rb or Rf, the risk-free return, is usually cumbersome to handle. So, typically, it is either set to zero or a constant value. The problem is that rates vary over time and has an impact on the relative ordering of investments.
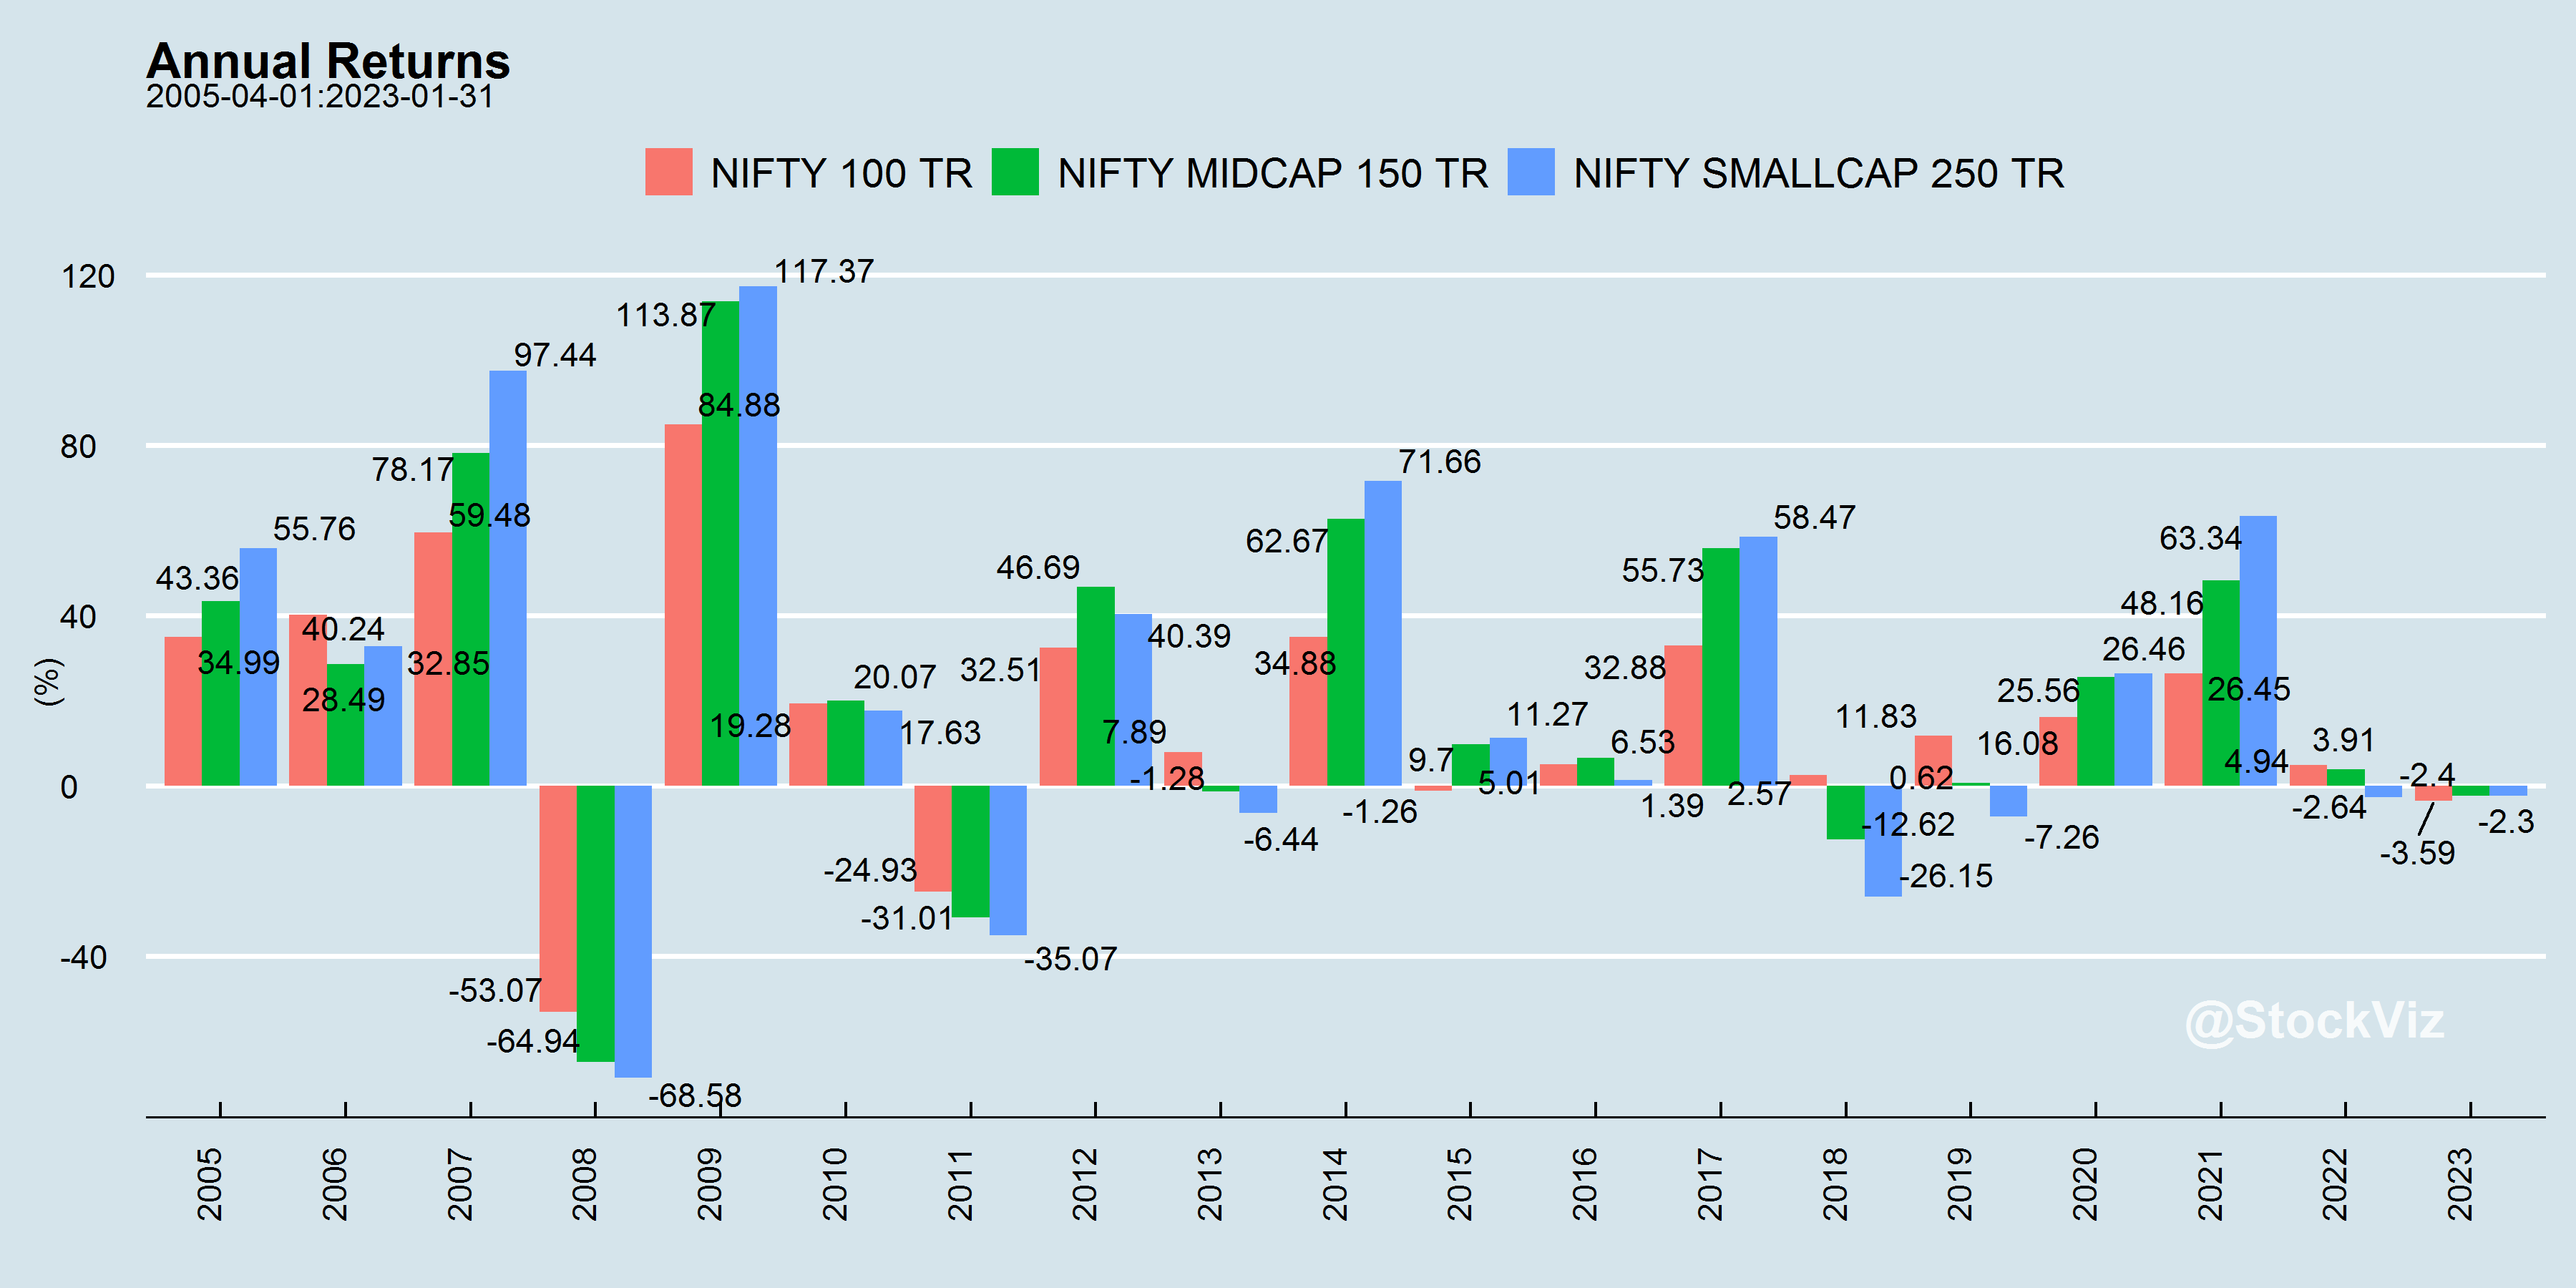
At high interest rates, SR(mid-caps) > SR(large-caps)
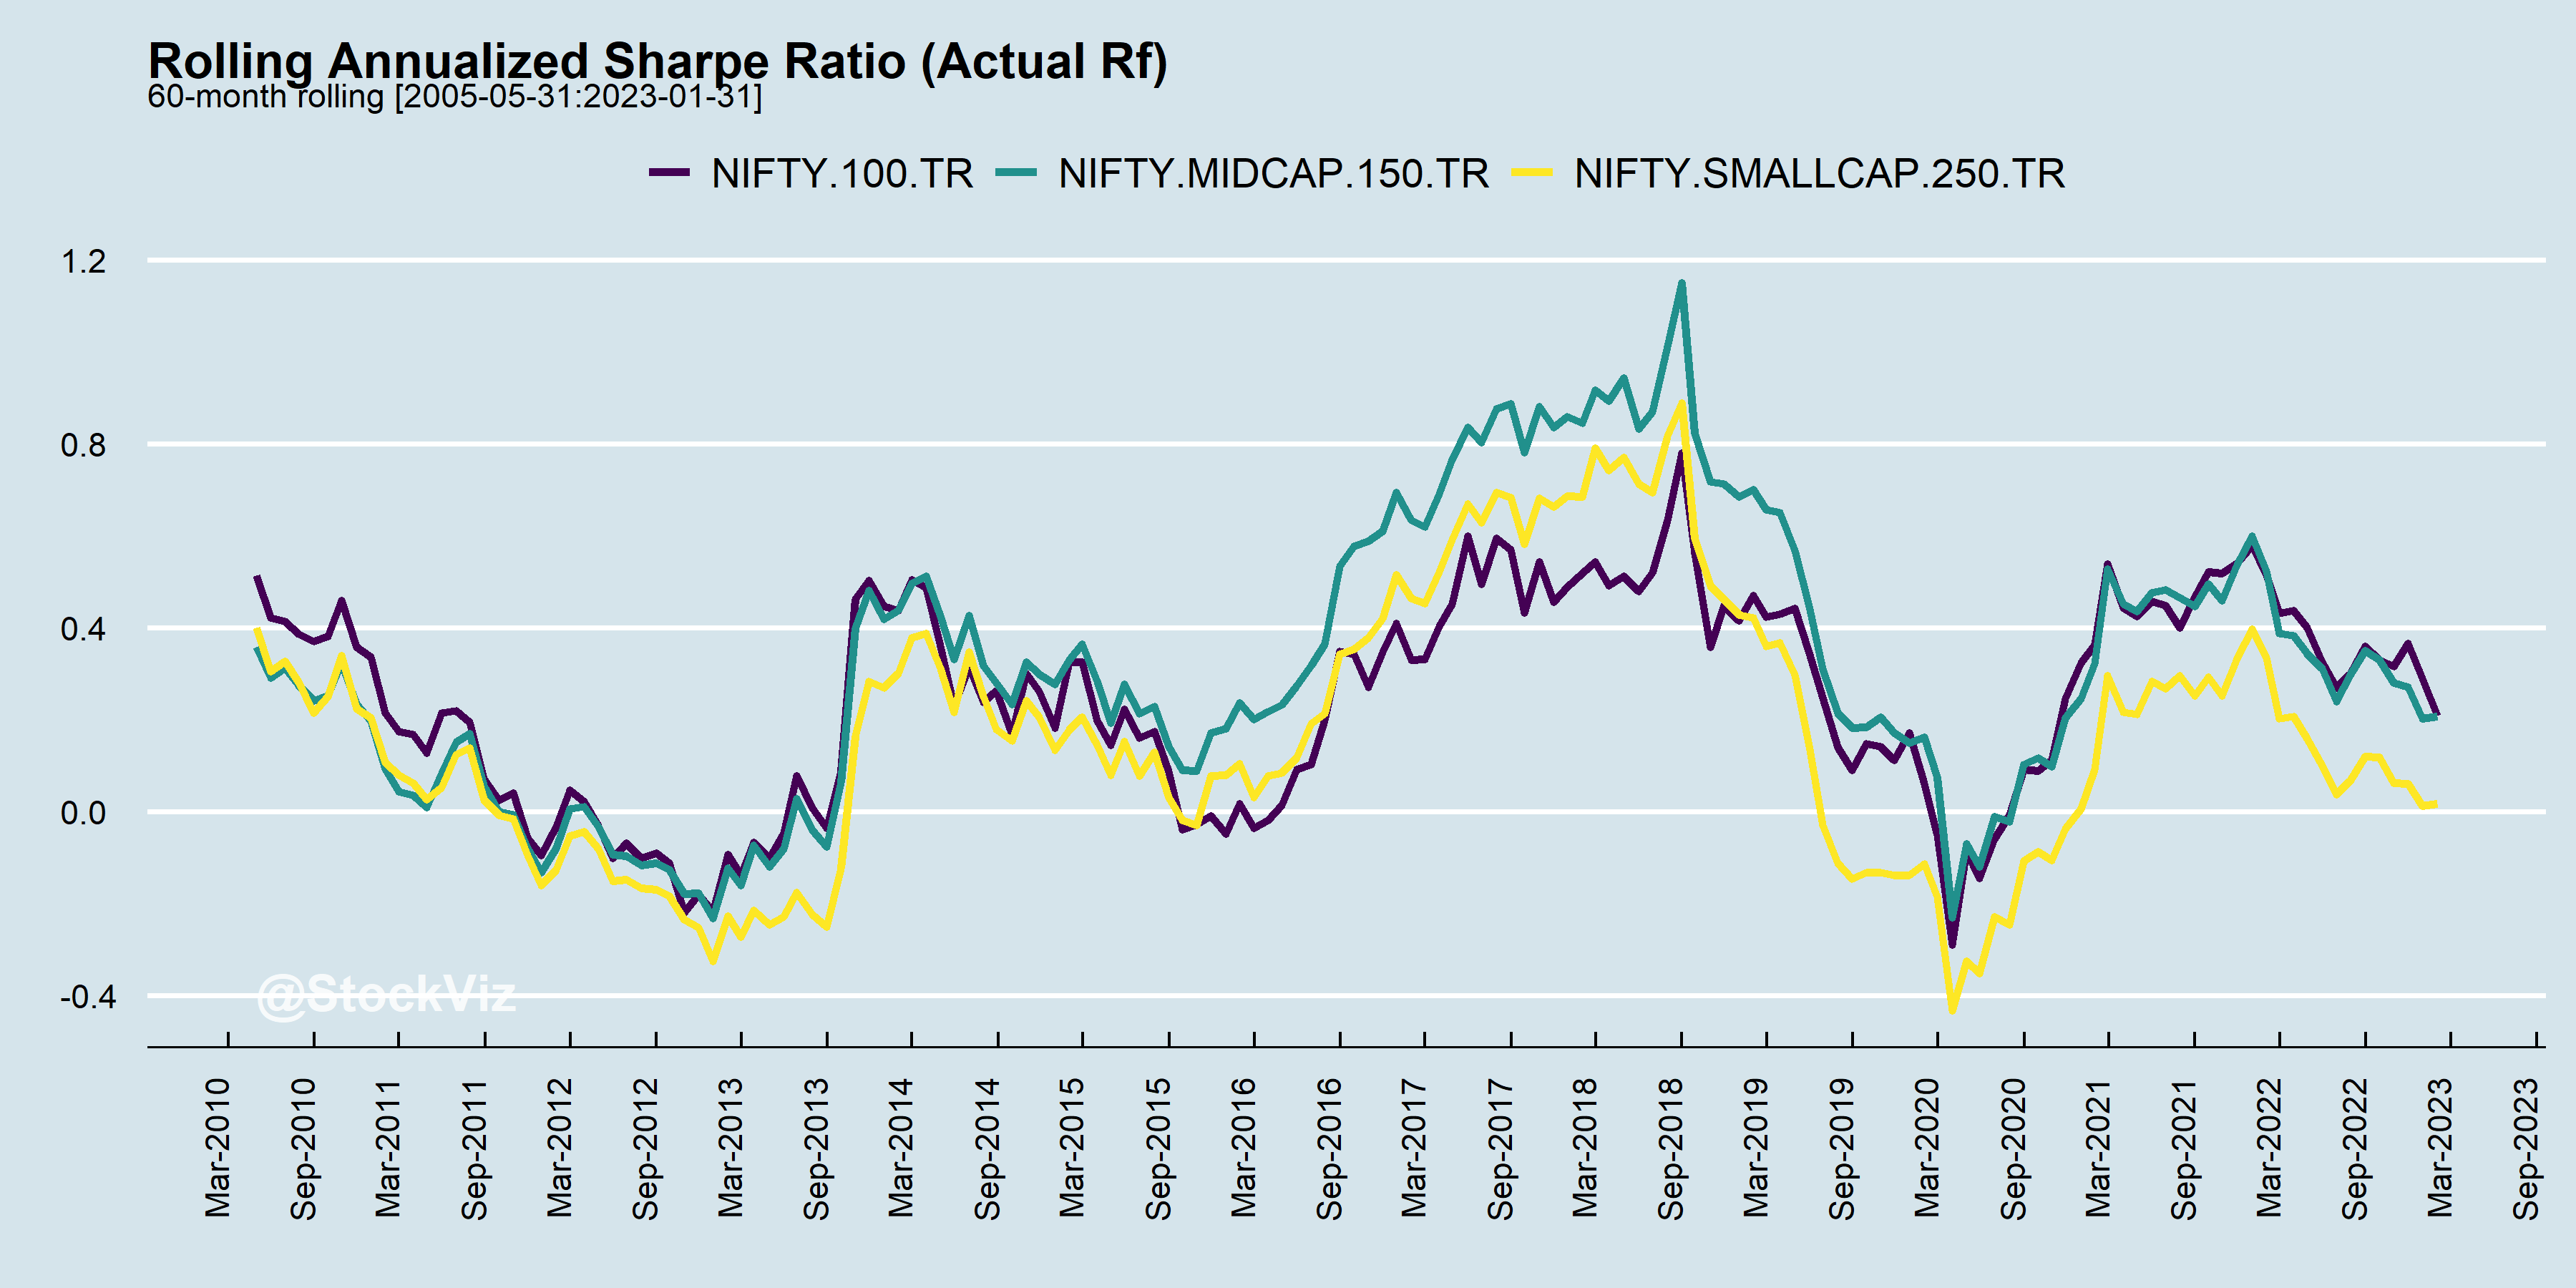
Ideally, you want your Sharpes to be positive and stable. Unfortunately, that is never the case.
During bull markets, Sharpes trend up and reverse course in bears.
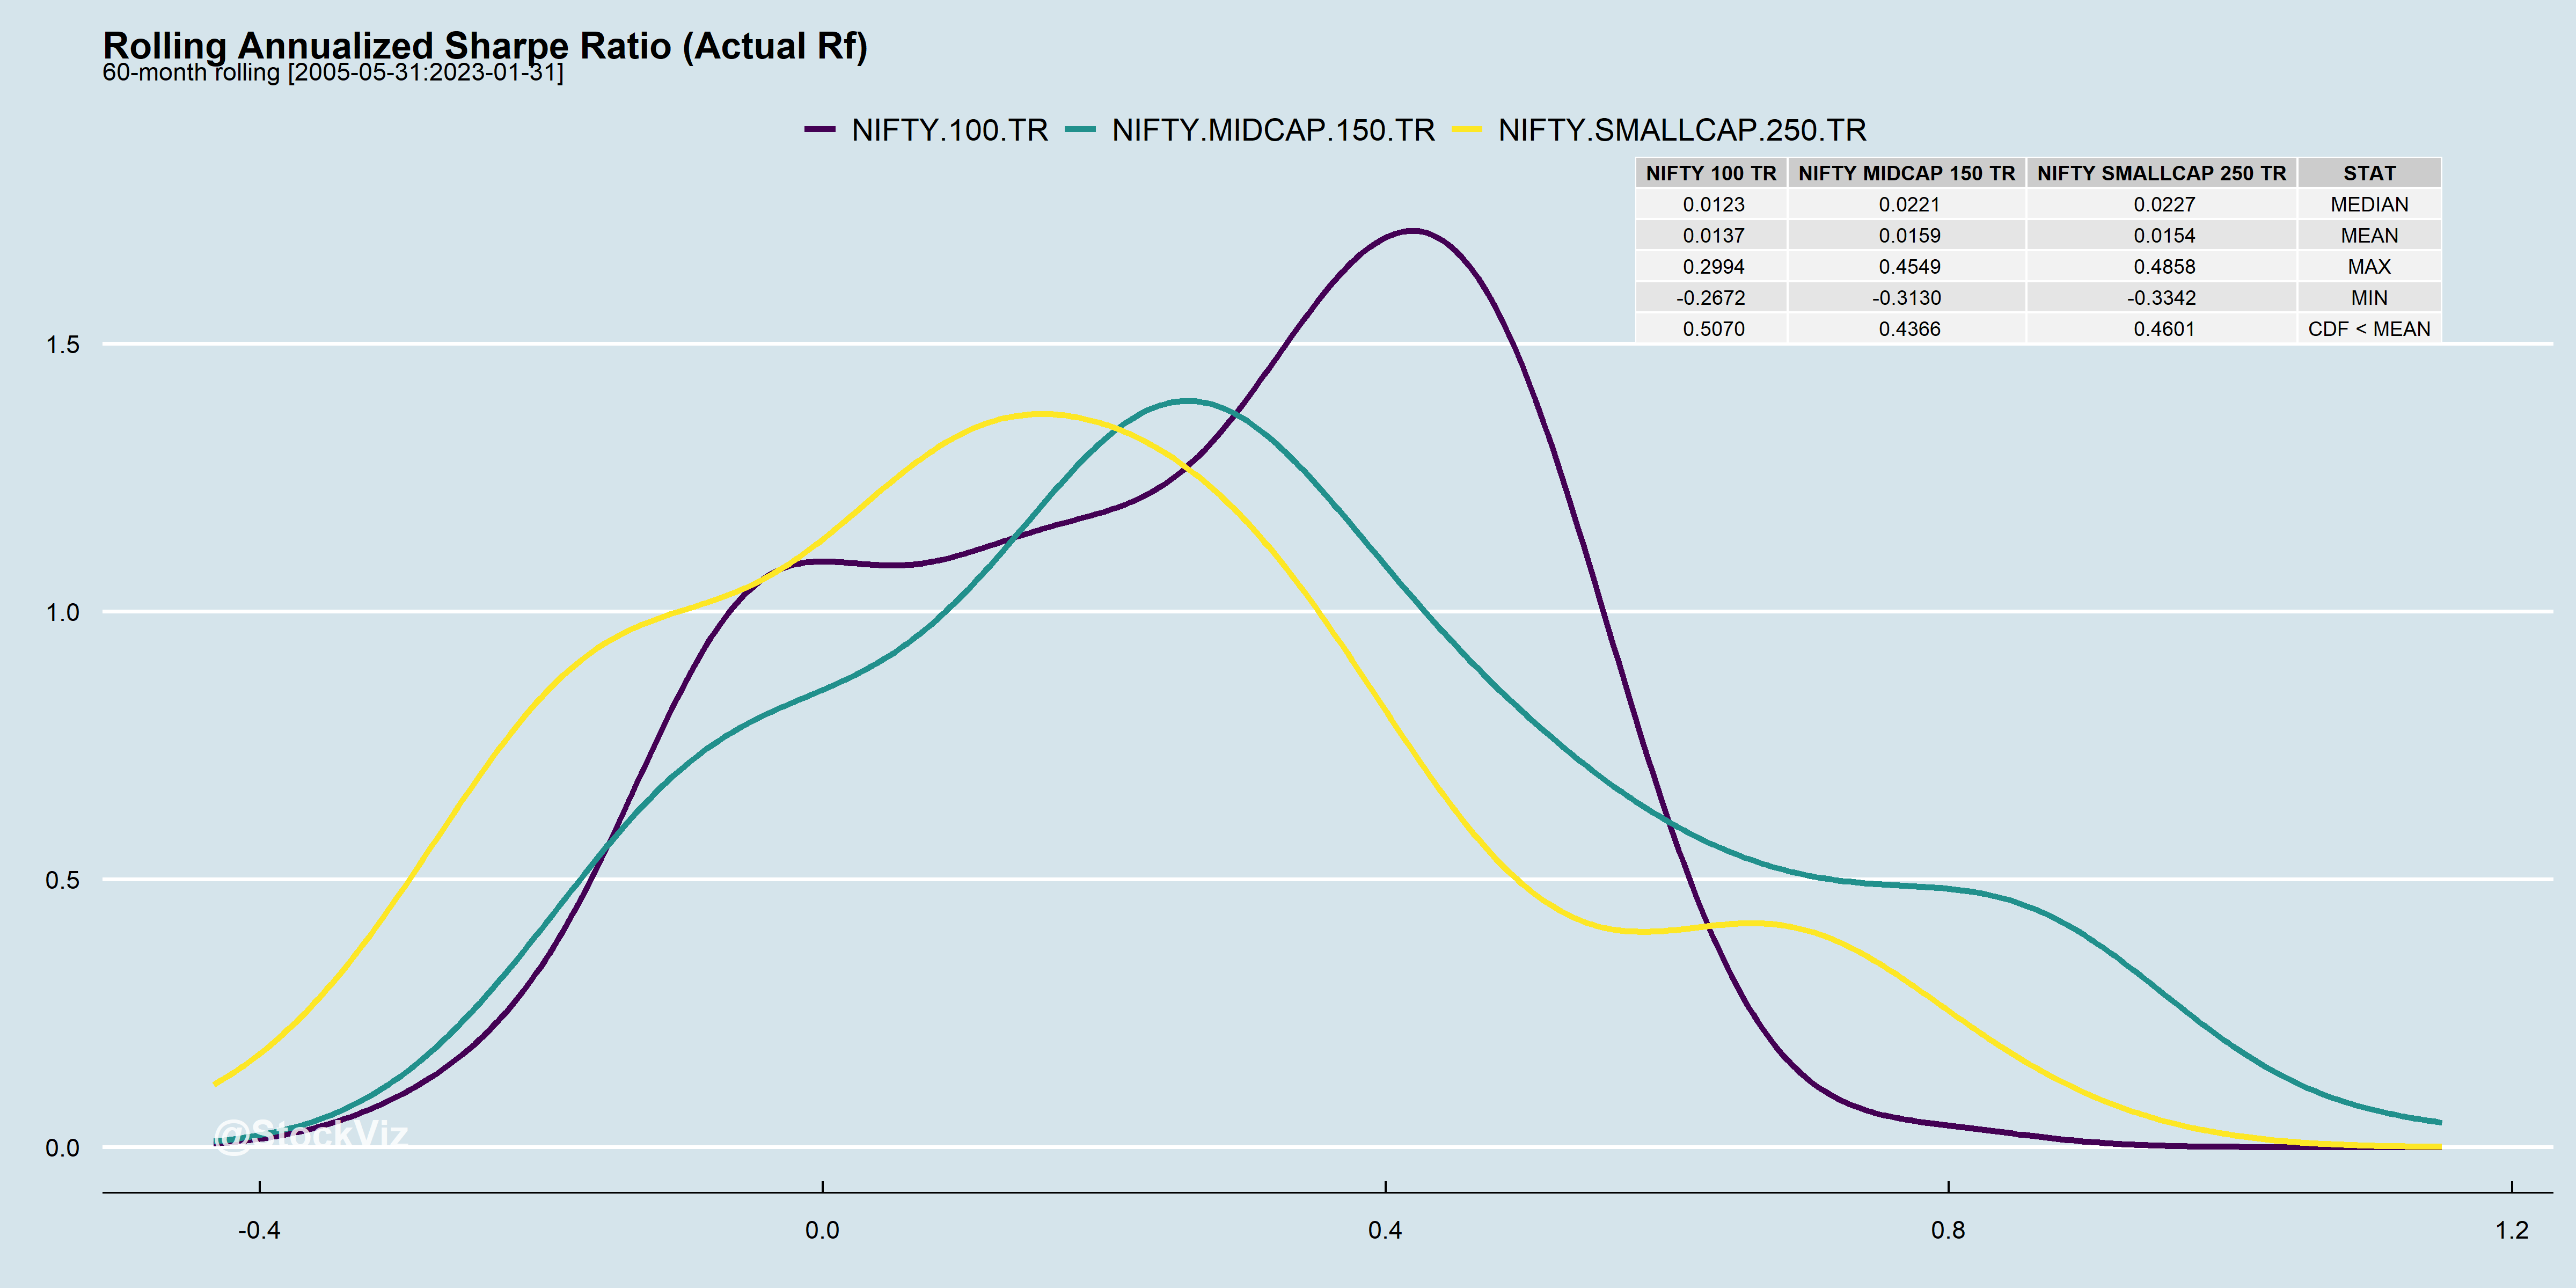
At the end of the day, it boils down to whether the returns are worth the risk.
You might very well be trying to catch lightening in a bottle.
For more index stats, visit our Index Metrics dashboard.
In our introduction to factors, we discussed how portfolio returns are mostly explained by market risk (rm – rf: market risk premium.) Whatever cannot be explained by the market is α, or the portfolio manager’s skill. If you strip away the financial jargon, this is nothing but linear regression.
Also, what exactly is “market risk?” A few years ago, the only index funds on the market were of the NIFTY 50 and MIDCAP 150 indices. However, the number of index funds keep ticking up and there are now several strategy funds covering quality, value, low-volatility, momentum, etc… in the market. So, if an investor can access these vanilla strategies at a low cost, shouldn’t the definition of the “market” expand to incorporate those?
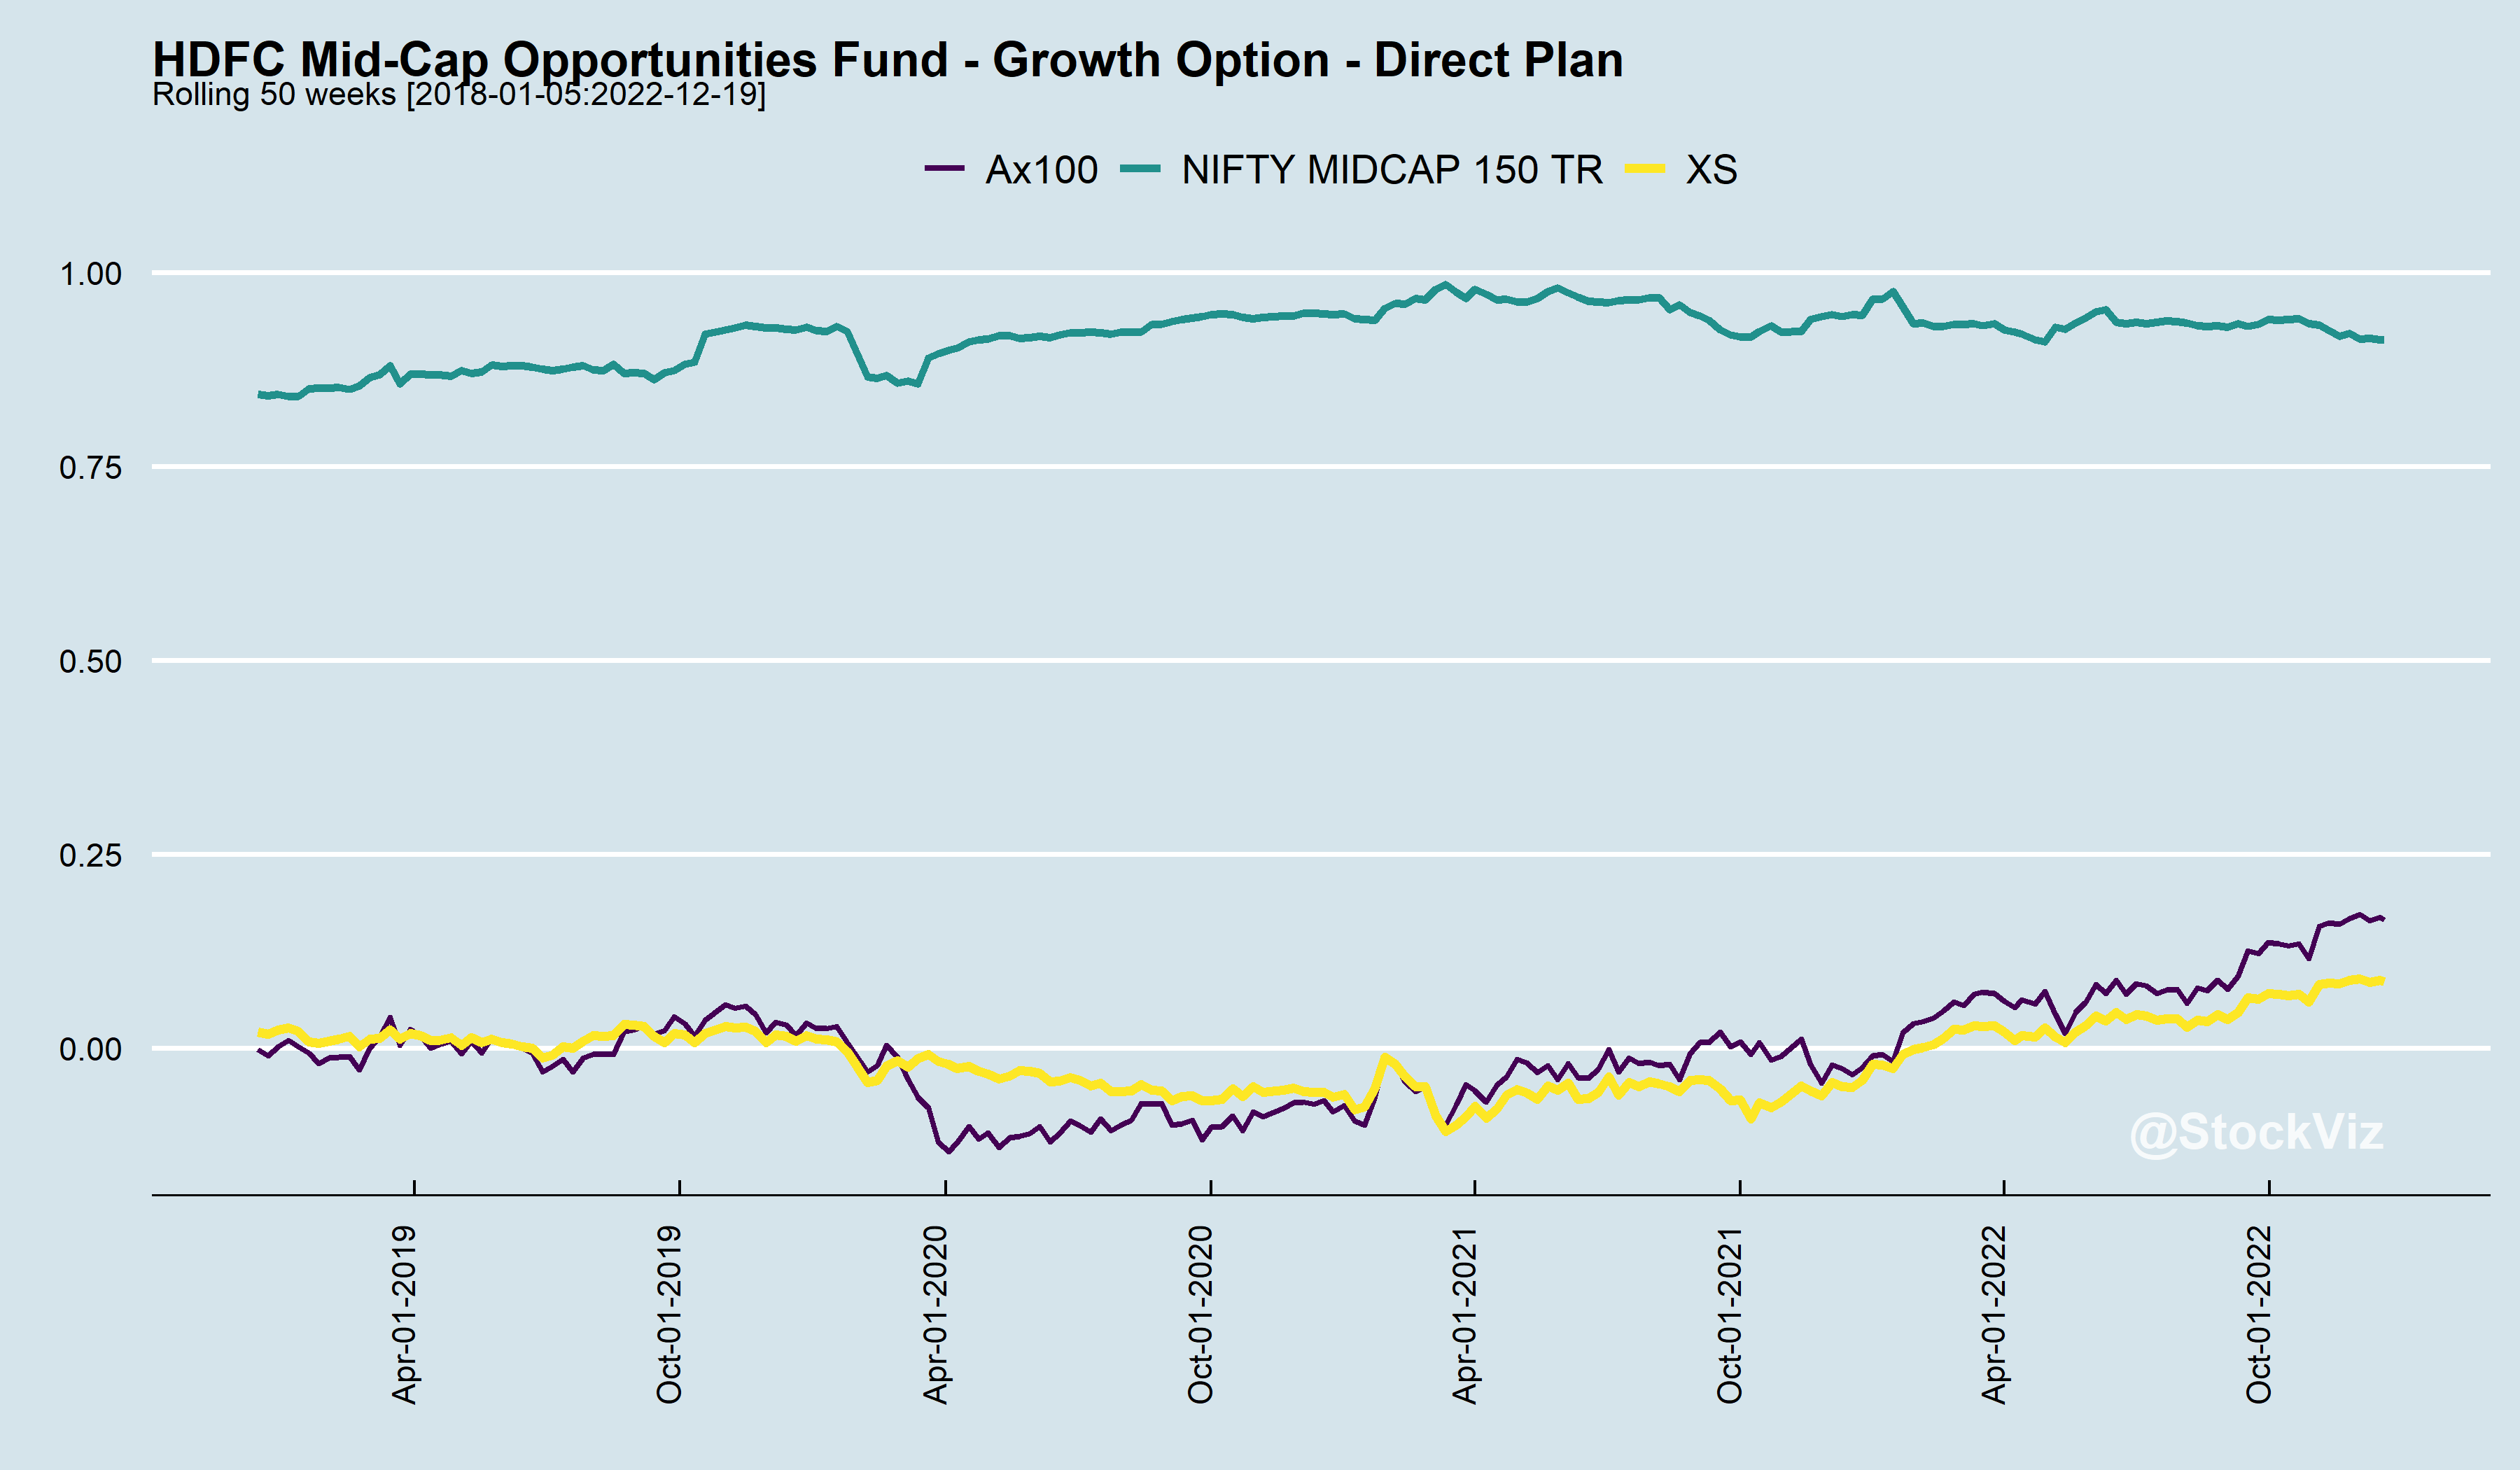
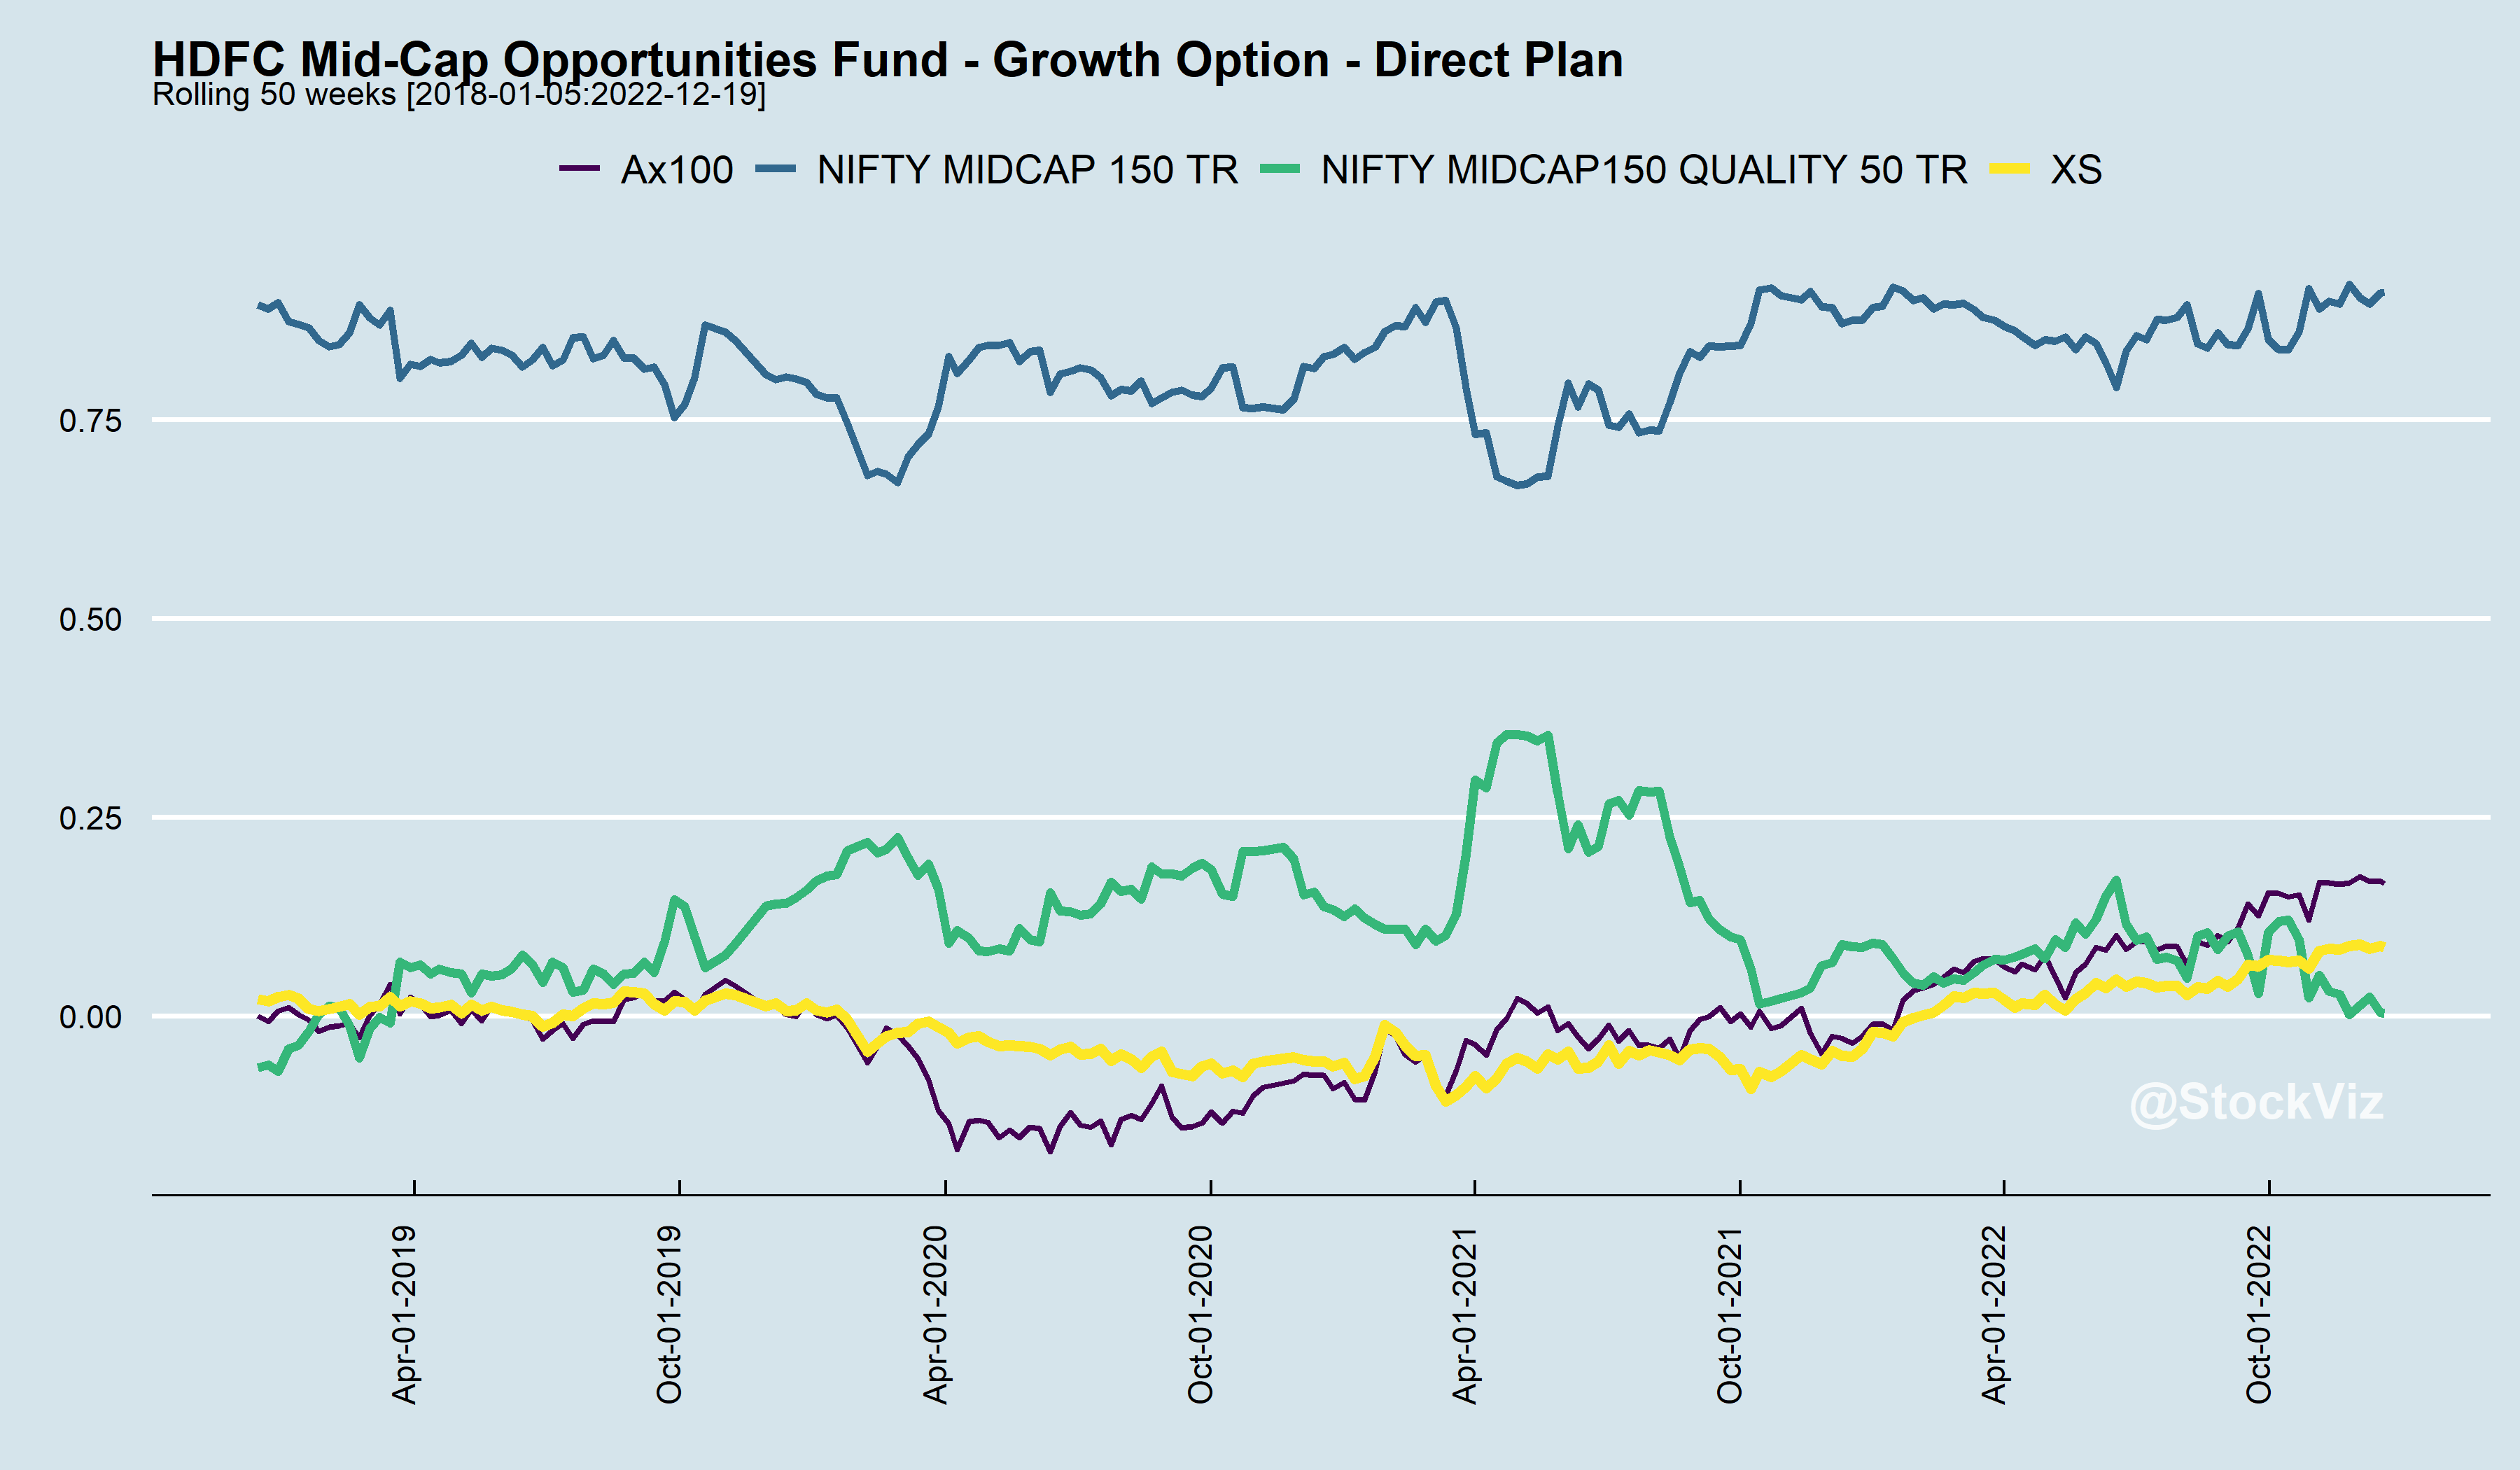
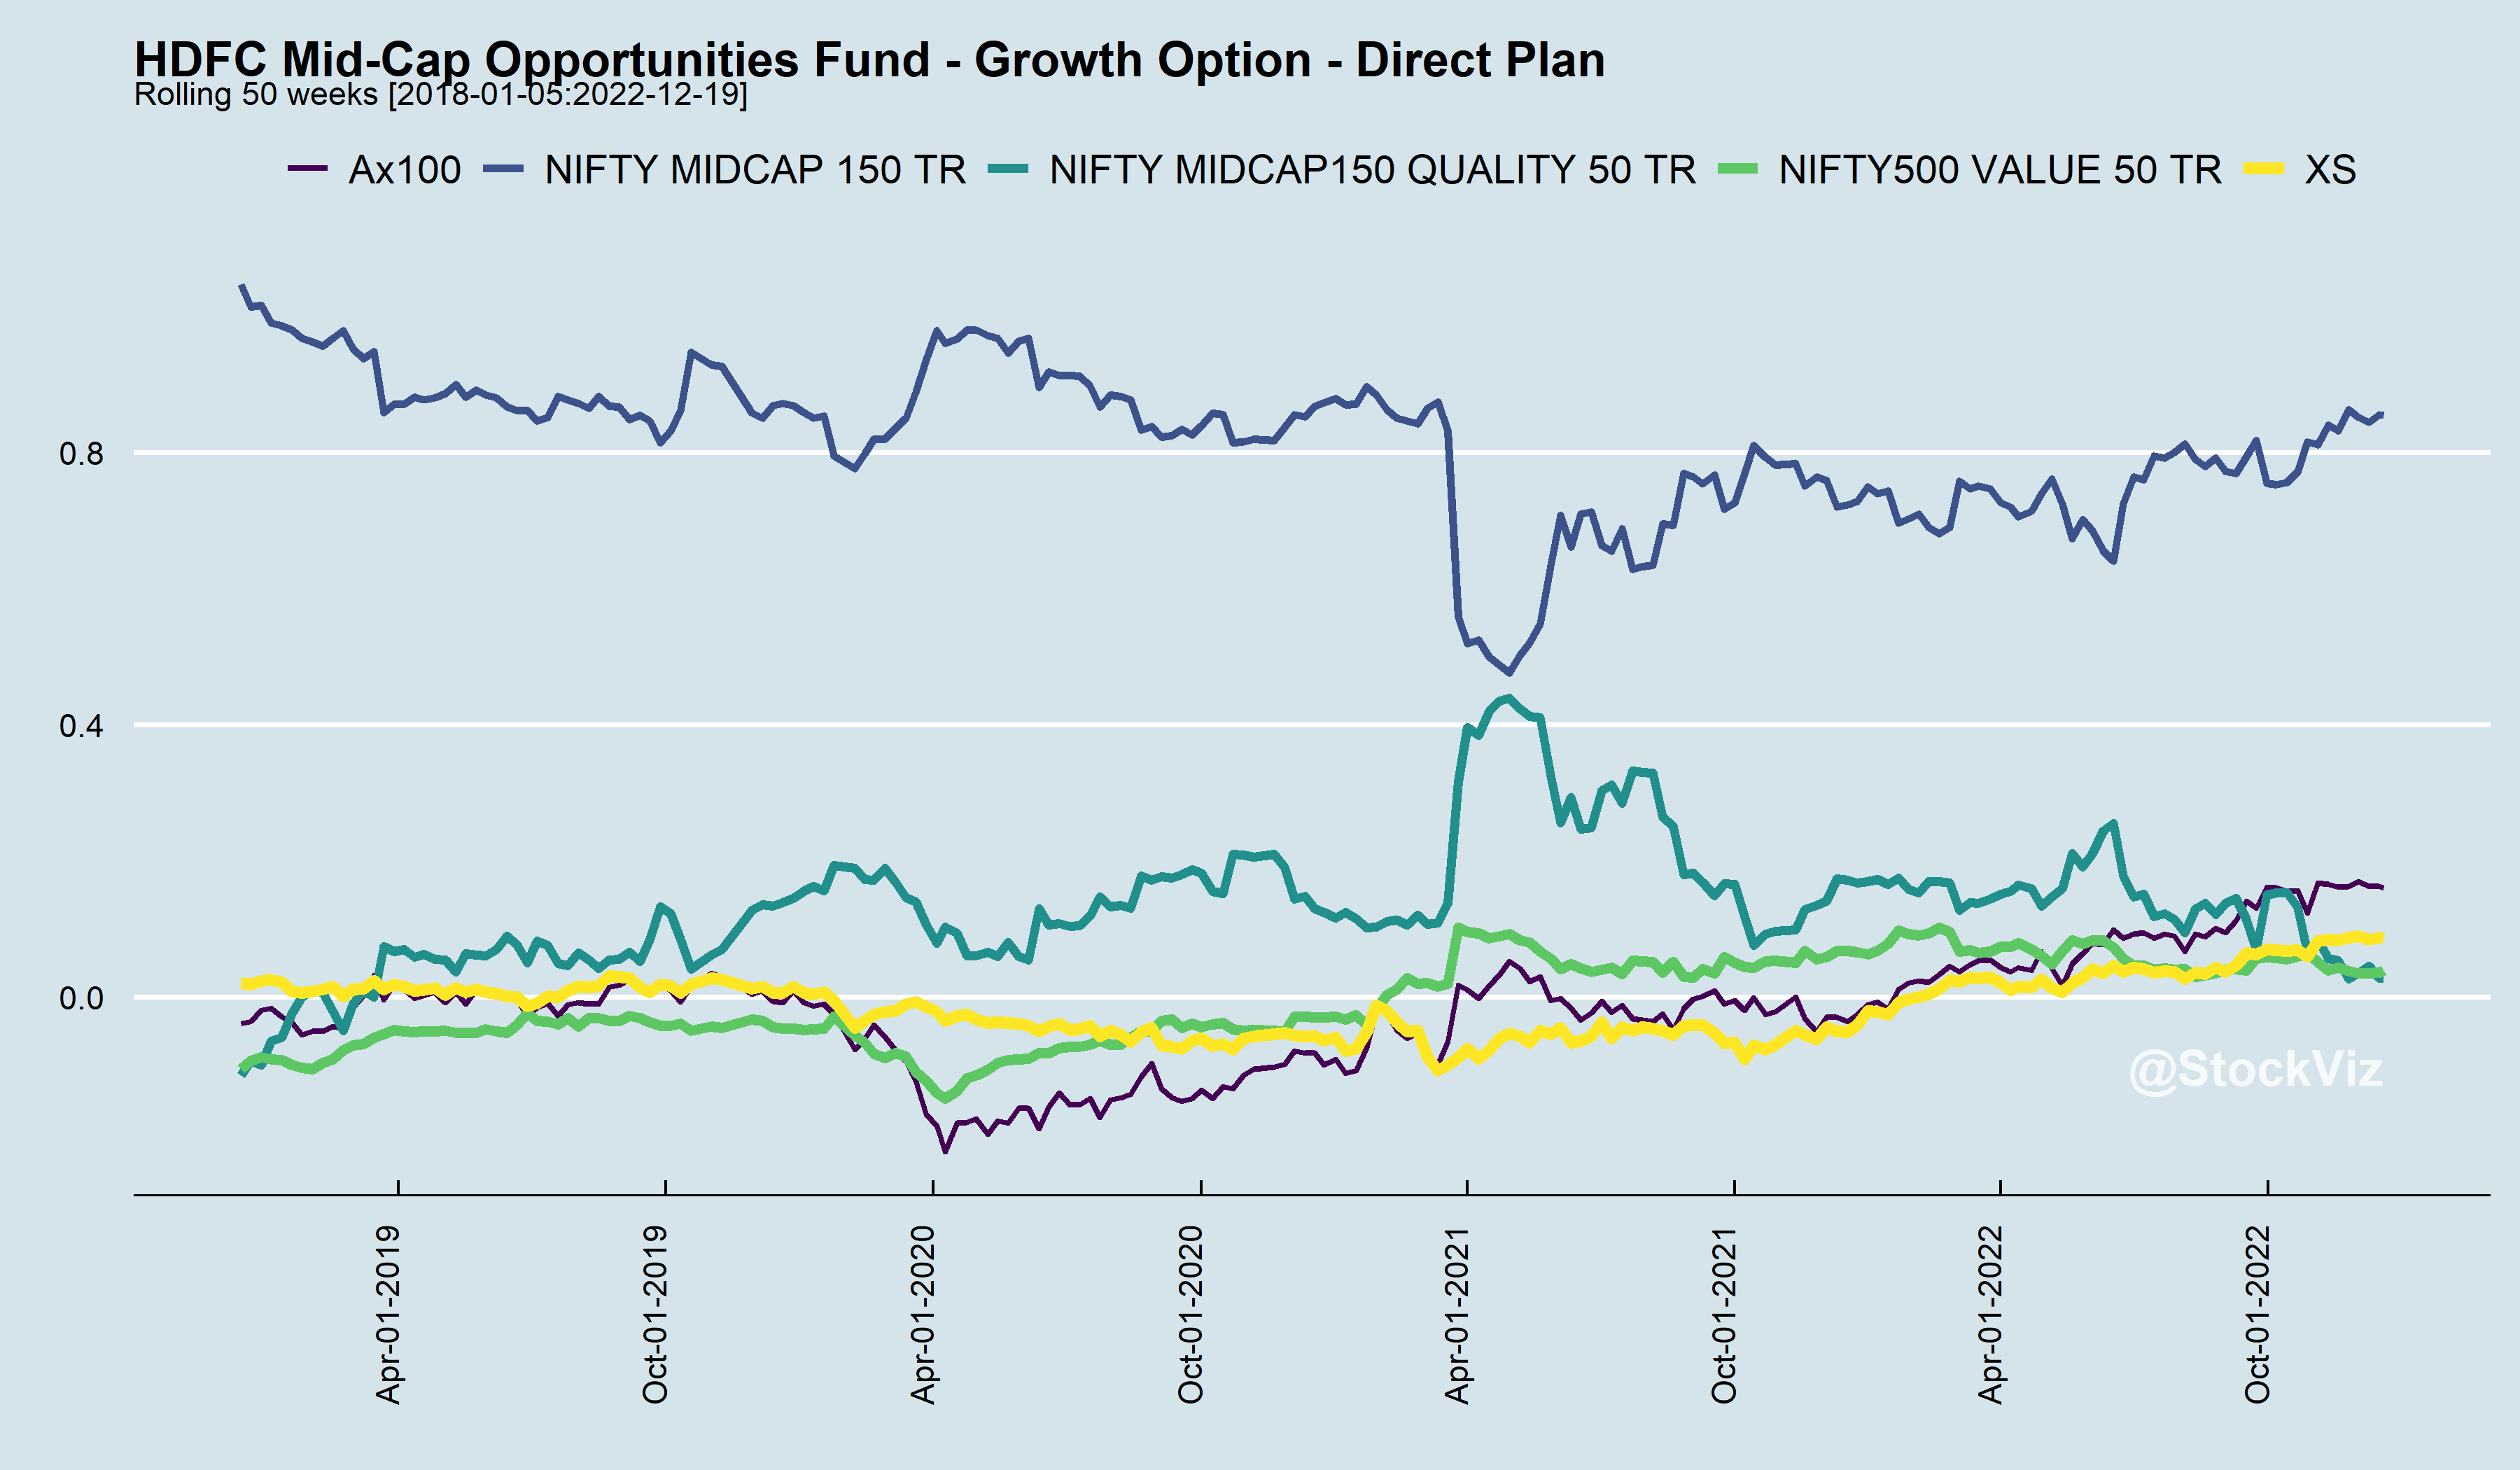
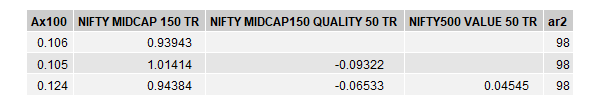
For example, take the HDFC Mid-cap Opp. Fund. You could regress its returns against the NIFTY MIDCAP 150, the NIFTY MIDCAP150 QUALITY 50 and NIFTY500 VALUE 50 indices to get an idea of how its α over them has evolved over time.
Rolling regressions gives you an idea of portfolio tilts and the fluctuating nature of α (Ax100). Also, its worth noting that α is only tangentially related to excess returns (XS). There are periods here where XS was positive in spite of negative Ax100 and vice versa.
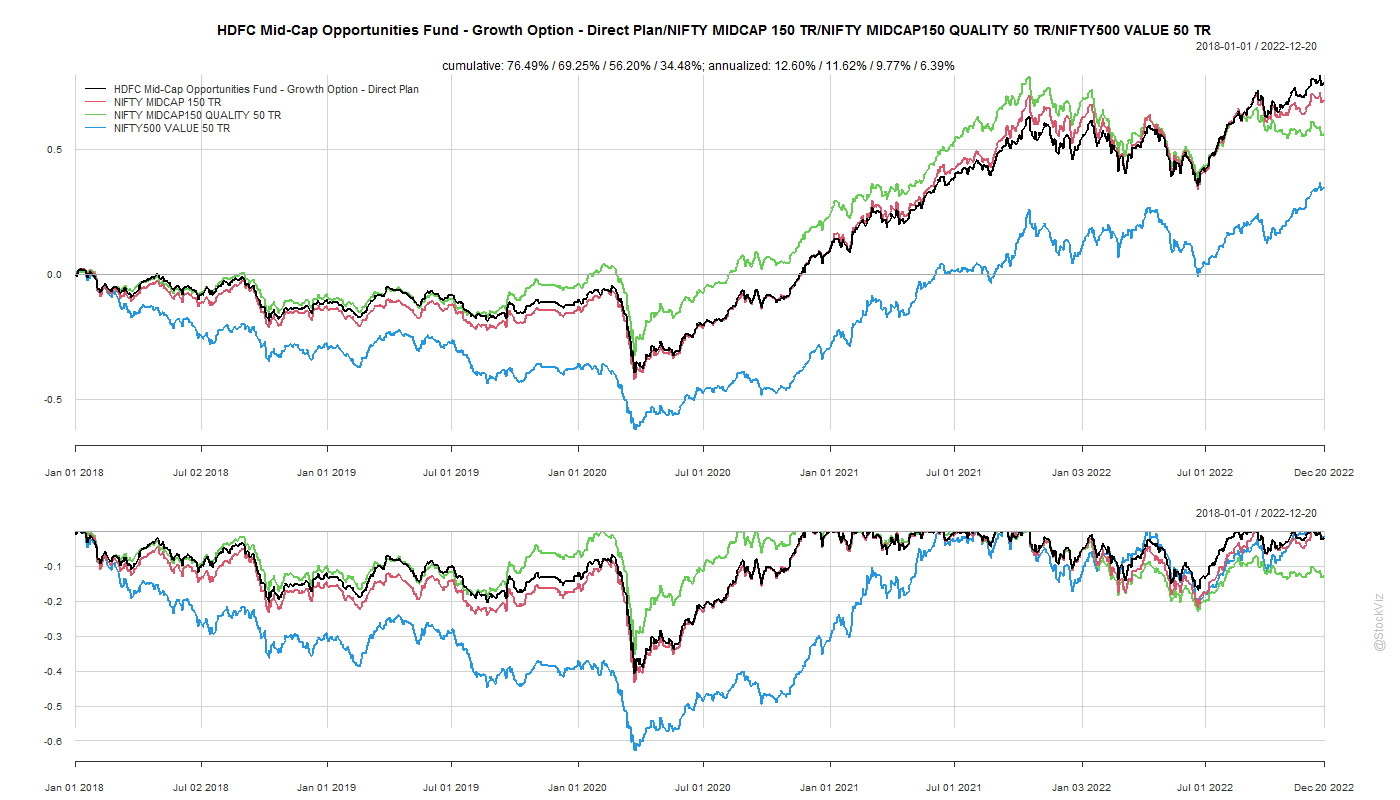
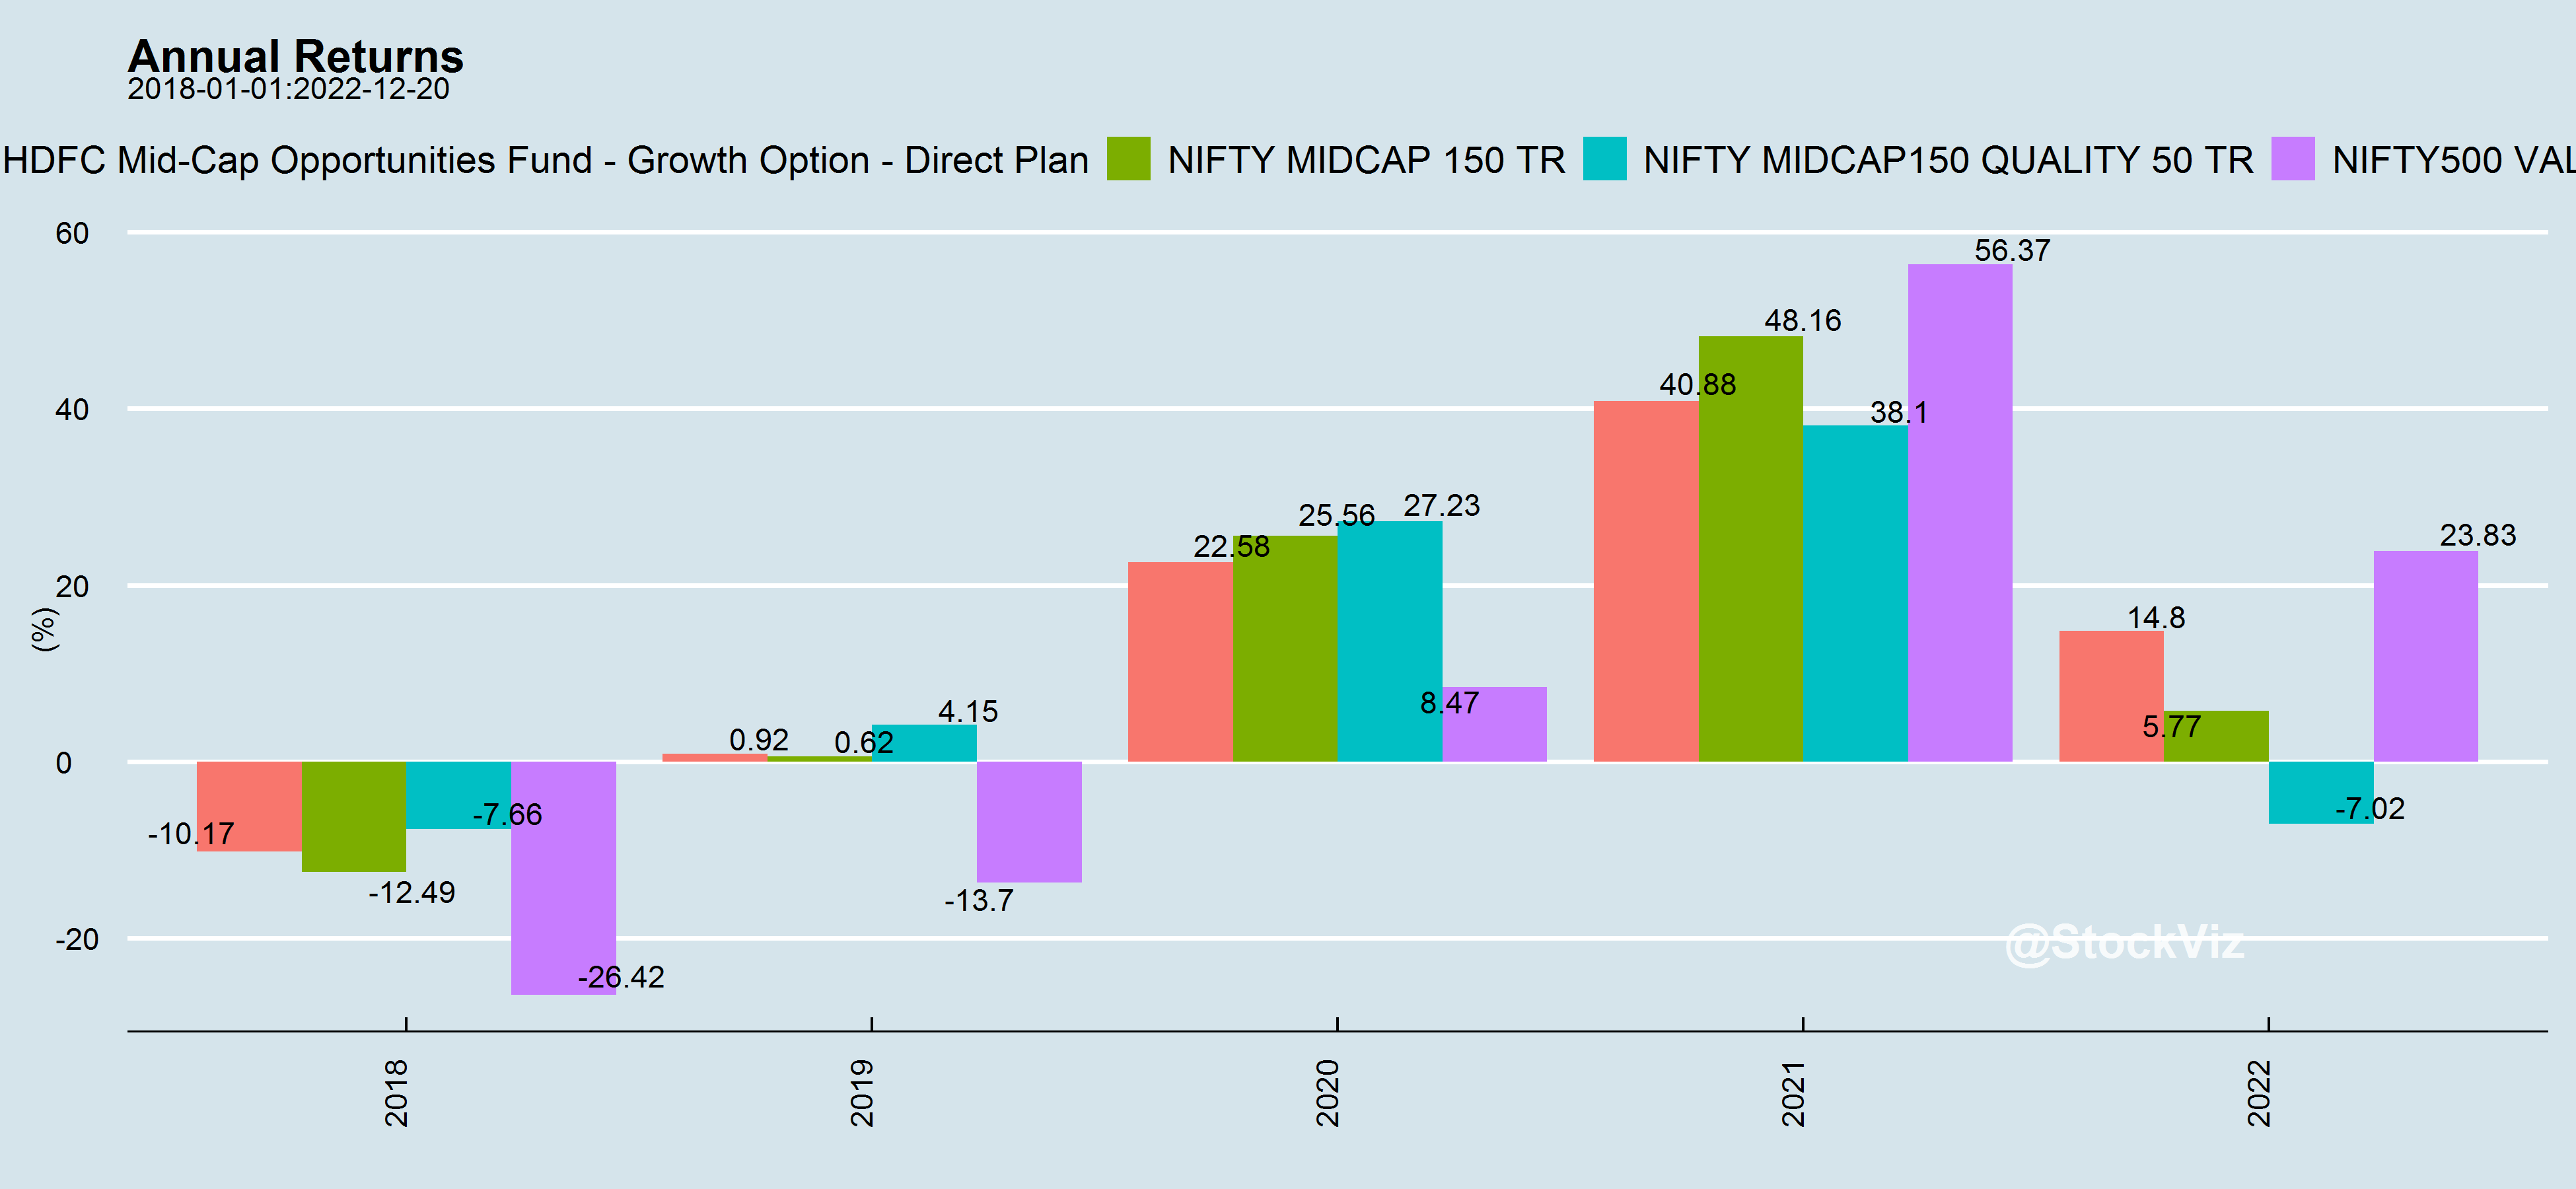
Styles go in-and-out of favor. Sometimes Quality performs better than Value and sometimes a simple cap-weighted index will outperform everything else. An actively managed portfolio’s relative performance to these styles change over time as well.
tl;dr:
α is a statistical derivation.
Don’t go chasing α – it keeps fluctuating.
α is not the same as excess returns.
When in doubt, index and forget.
You are always in doubt.
We have setup a script that auto-updates every day with these regressions on select large-cap and mid-cap funds. The report is available here.