Charting Alpha
Most mutual fund investors chase recent performance. However, experience shows that alpha, or out-performance, is rarely sustained in the fund universe. To visualize how alpha fluctuates across different time-periods, we extended the relative strength spread notion of stocks to mutual funds. By normalizing performance across multiple funds vs. a single benchmark, the CNX 500 index, we can get a sense for how stable the alpha is.
Exhibits
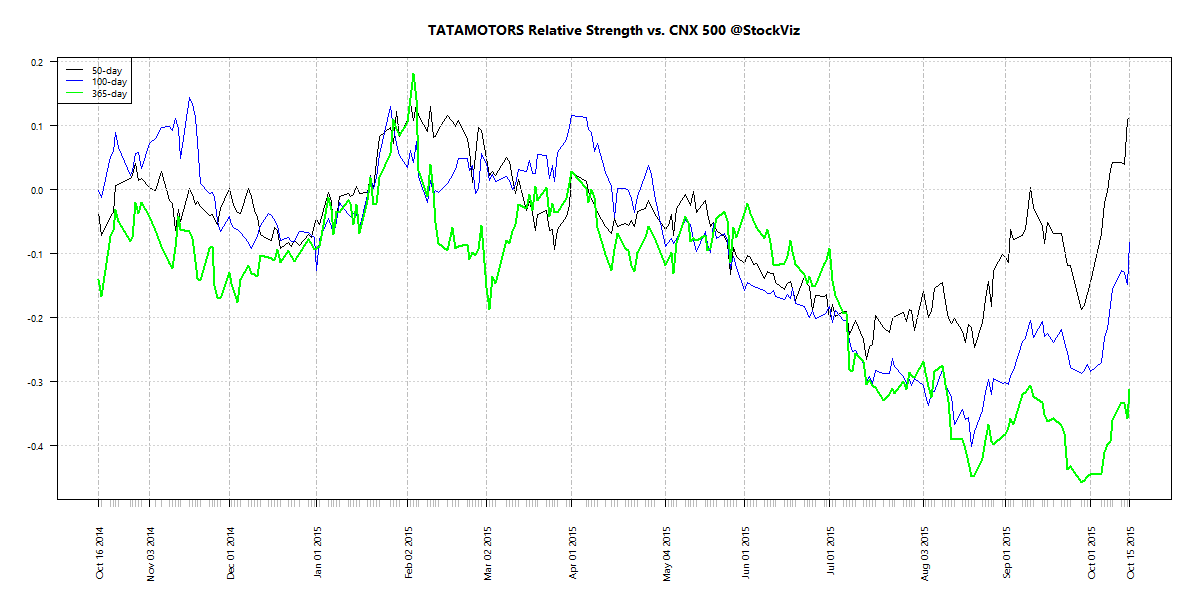
Have a look at the RS-Spread chart of the HDFC Growth Fund:
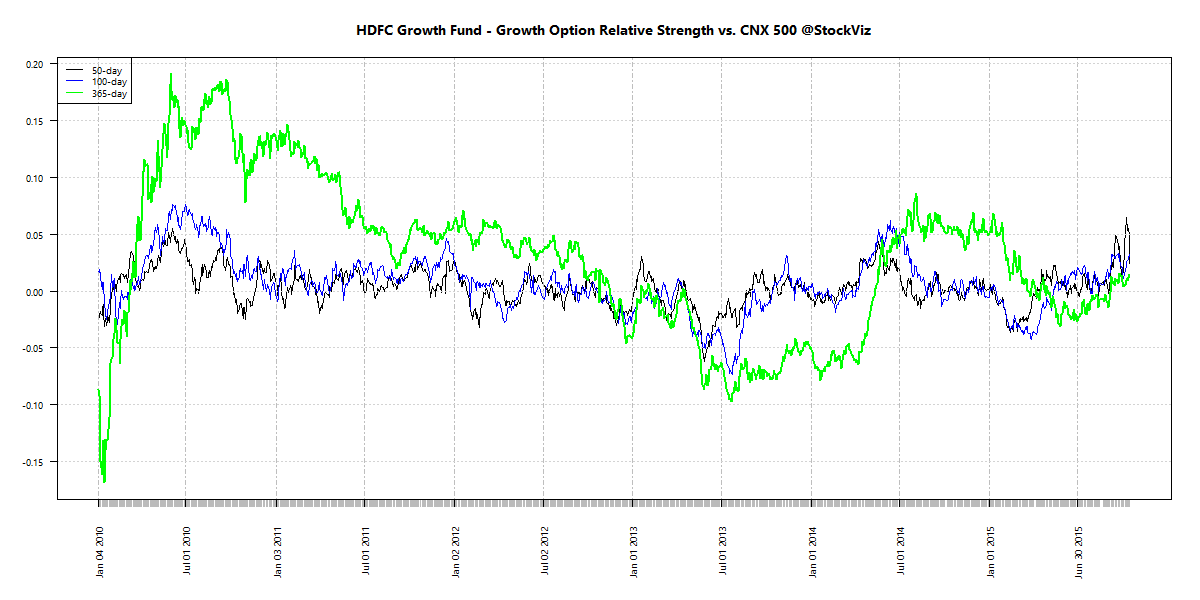
Notice how 1-year alpha was below zero between Oct’2012 and May’2014 and is now back below zero again. This should indicate that whatever strategy the fund is employing is not that great in generating sustainable alpha. Now compare that to the Birla Sun Life Frontline Equity Fund:
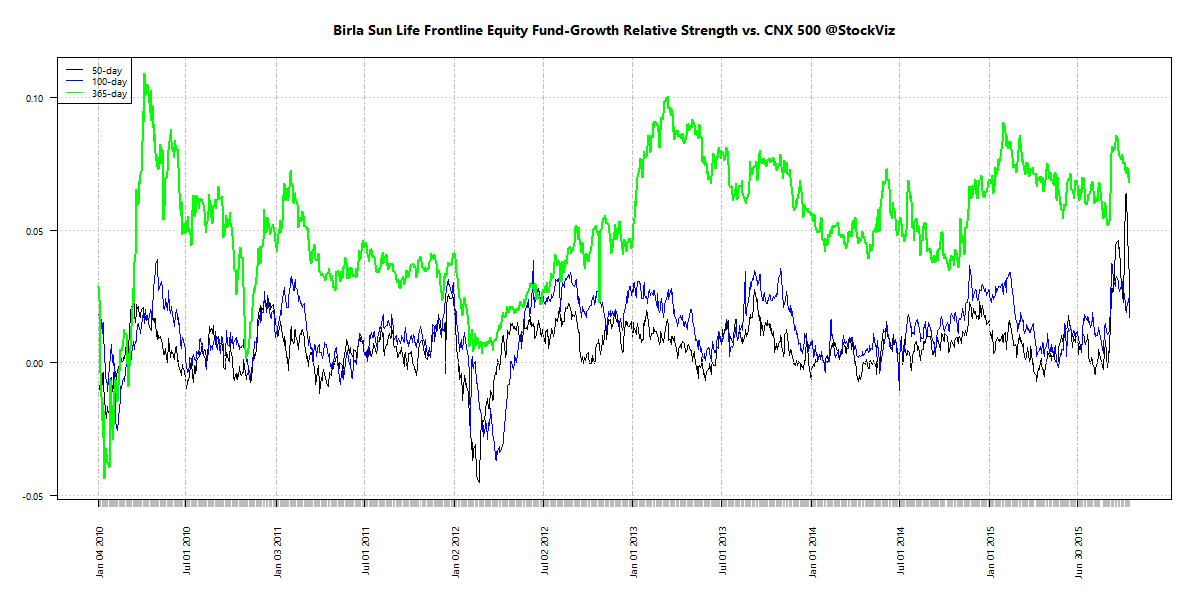
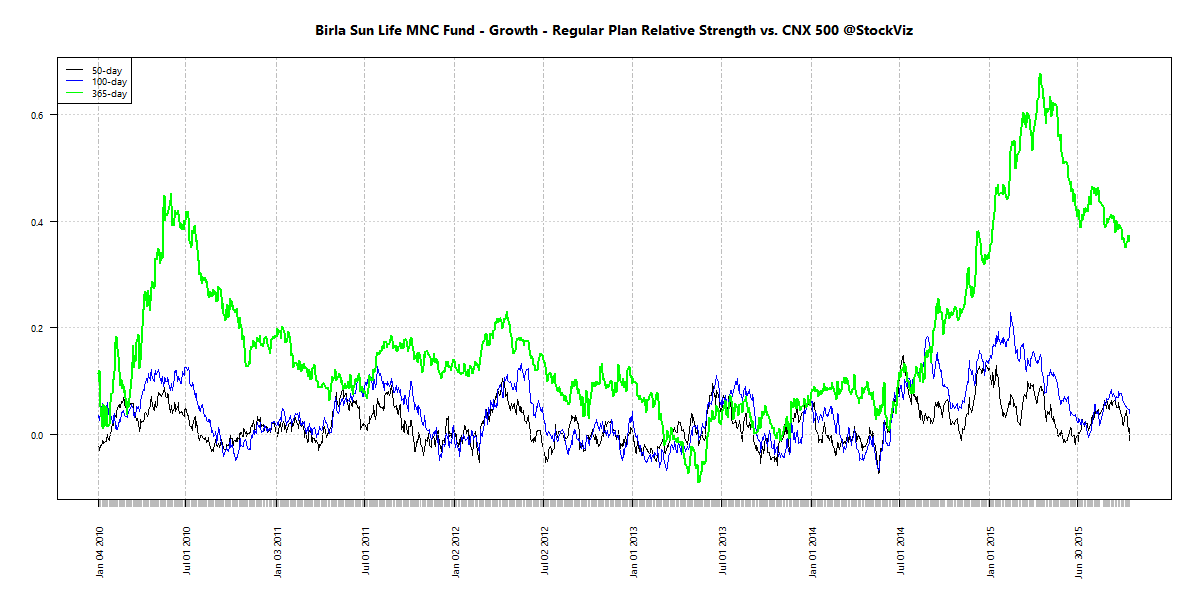
Notice how the fund has managed to outperform over the last 5-years. Here’s the MNC fund’s RS-Spread chart:
The FundCompare Tool
We update these charts daily for more than 100 funds. You can access them through our FundCompare tool. If you have any questions, give us a call or Whatsapp us!