Equities
| MINTs | |
|---|---|
| JCI(IDN) | +2.87% |
| INMEX(MEX) | +0.97% |
| NGSEINDX(NGA) | +6.47% |
| XU030(TUR) | +5.60% |
| BRICS | |
|---|---|
| IBOV(BRA) | -3.03% |
| SHCOMP(CHN) | -4.50% |
| NIFTY(IND) | -0.47% |
| INDEXCF(RUS) | +6.07% |
| TOP40(ZAF) | +0.48% |
Commodities
| Energy | |
|---|---|
| RBOB Gasoline | +12.95% |
| Brent Crude Oil | +13.19% |
| Ethanol | -2.07% |
| Natural Gas | +11.93% |
| WTI Crude Oil | +9.49% |
| Heating Oil | +10.74% |
| Metals | |
|---|---|
| Gold 100oz | -1.90% |
| Copper | -4.58% |
| Palladium | -12.09% |
| Platinum | -0.53% |
| Silver 5000oz | -3.64% |
Currencies
| MINTs | |
|---|---|
| USDIDR(IDN) | -0.60% |
| USDMXN(MEX) | +1.15% |
| USDNGN(NGA) | +0.09% |
| USDTRY(TUR) | +2.53% |
| BRICS | |
|---|---|
| USDBRL(BRA) | -3.81% |
| USDCNY(CHN) | +0.81% |
| USDINR(IND) | -0.68% |
| USDRUB(RUS) | -3.96% |
| USDZAR(ZAF) | -2.59% |
| Agricultural | |
|---|---|
| Corn | +3.54% |
| Cotton | -2.46% |
| Soybean Meal | -1.17% |
| Soybeans | -3.69% |
| Coffee (Arabica) | -7.60% |
| Feeder Cattle | +2.07% |
| Sugar #11 | -0.91% |
| Wheat | +6.17% |
| White Sugar | -0.99% |
| Coffee (Robusta) | +6.26% |
| Cattle | +4.84% |
| Cocoa | -11.06% |
| Lean Hogs | +28.32% |
| Lumber | -5.14% |
| Orange Juice | -9.62% |
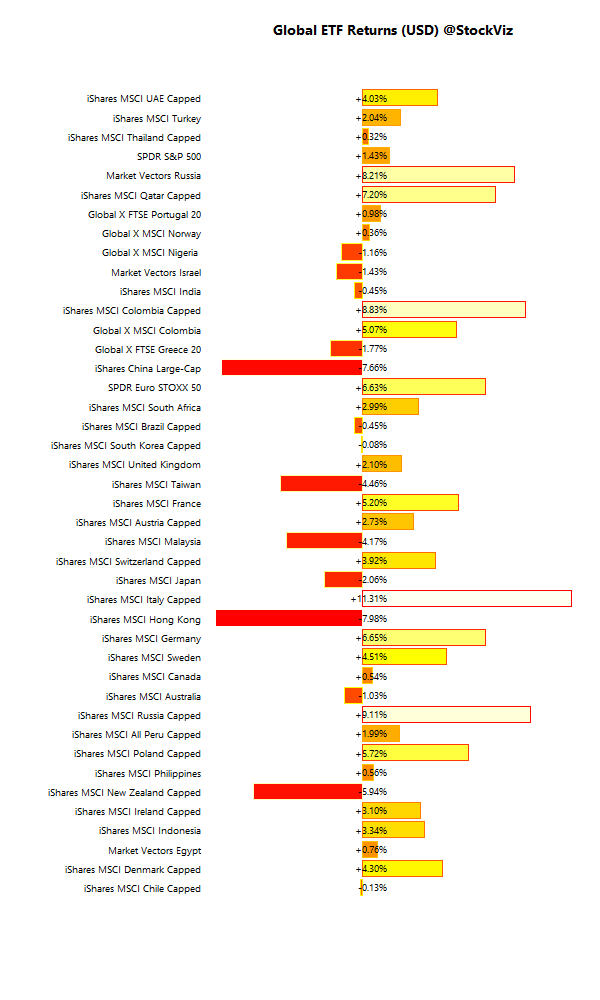
International ETFs (USD)
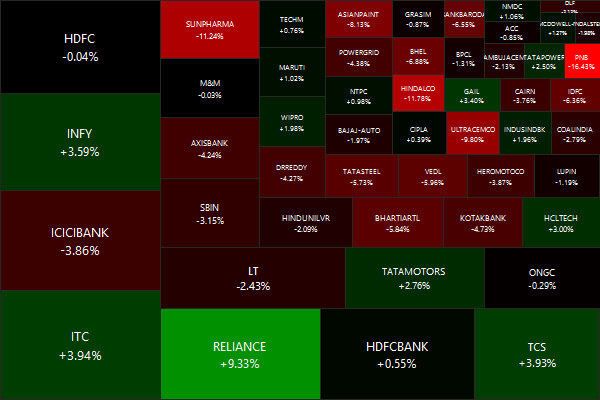
Nifty Heatmap
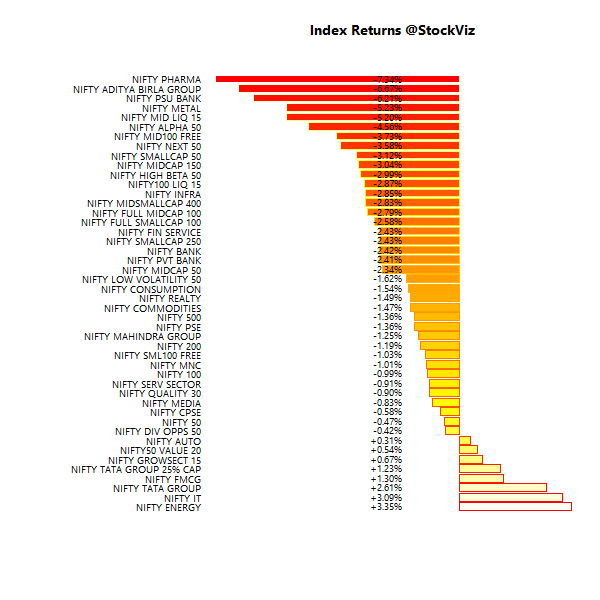
Index Returns
More: Sector Dashboard
Market Cap Decile Performance
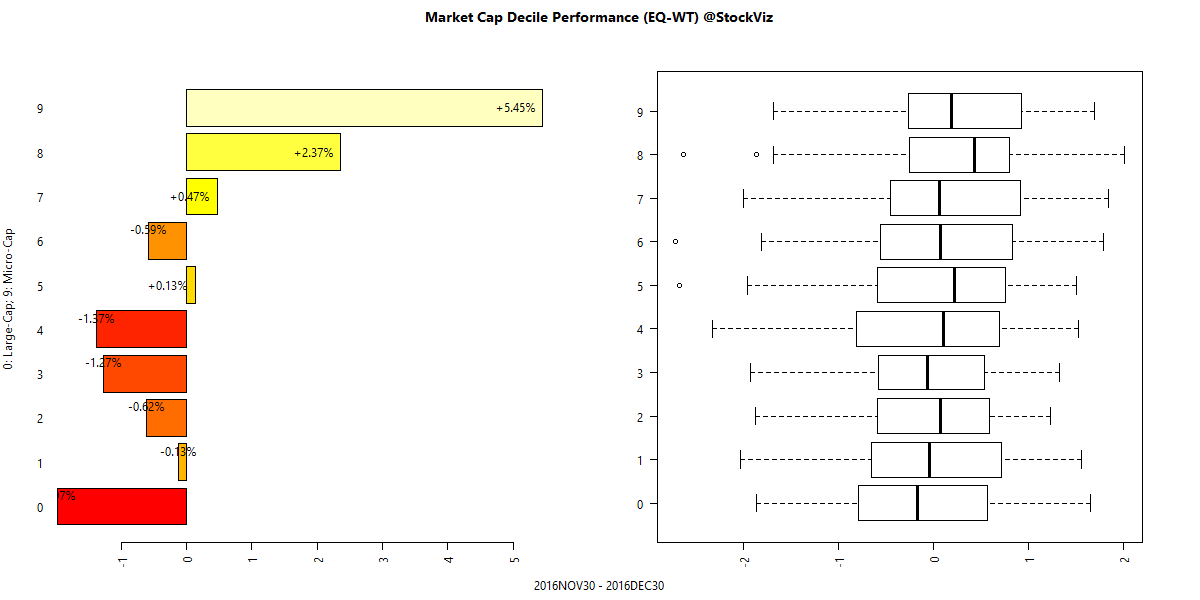
More: Equal-Weight Deciles, Cap-Weight Deciles
ETF Performance
| NIFTYBEES | -0.51% |
| CPSEETF | -0.75% |
| BANKBEES | -2.69% |
| JUNIORBEES | -3.04% |
| GOLDBEES | -3.06% |
| INFRABEES | -3.26% |
| PSUBNKBEES | -7.03% |
All the hoopla about how demonetization was a gift to PSU banks was dialed down a bit once reality sunk in… there are only losers here.
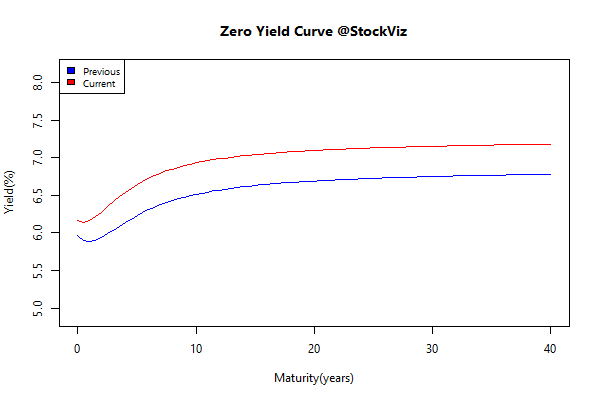
Yield Curve
Bond Indices
| Sub Index | Change in YTM | Total Return(%) |
|---|---|---|
| 0 5 | +0.35 | -0.51% |
| 5 10 | +0.35 | -1.28% |
| 10 15 | +0.41 | -2.51% |
| 15 20 | +0.37 | -2.87% |
| 20 30 | +0.46 | -4.50% |
Bonds got shellacked across the curve…
Investment Theme Performance
| Enterprise Yield | -0.18% |
| Balance Sheet Strength | -0.99% |
| Value in Flight | -1.64% |
| Momo (Relative) v1.1 | -2.06% |
| Momo (Velocity) v1.0 | -2.29% |
| Magic Formula | -2.31% |
| Momo (Acceleration) v1.0 | -2.35% |
| Quality to Price | -2.36% |
| Momentum | -2.69% |
| Velocity | -3.31% |
| Acceleration | -3.57% |
| Financial Strength Value | -4.07% |
| HighIR Momentum | -4.44% |
Strategies with built-in stop-losses out performed…
Equity Mutual Funds
Bond Mutual Funds
Book reviews
For the books that I read and write about, follow the tag ‘review.’