Get onboard with the embedded assumptions before diving head-first.
The 60/40 allocation – 60% in equities, 40% in bonds – is the bedrock on which most portfolios in the US are built. Jack Bogle was its biggest proponent and it serves as a benchmark in most portfolio discussions.
This post is part of our series on diversification and asset allocation. Previously:
From a cumulative performance point of view, it is easy to see why it is attractive.
Even with an annual rebalance, the 60/40 delivered. How did it achieve this remarkable feat? Should investors expect similar magic with the same allocation to Indian equities/bonds?
The biggest difference: Volatility
Ever since Volcker got done slaying inflation in the 80’s, US bond yields have been on a secular decline with declining volatility and increasingly occupying the place of a “flight-to-safety” asset.
Indian bonds, however, are in no way comparable to US bonds when it comes to volatility.
Volatility of US Bond returns (3-year, rolling) with those of Indian Gilts:
On a cumulative basis, Indian bond investors have taken a lot of pain for a 50bps out-performance.
Indian bonds haven’t exactly acted as a safe-haven in times of stress for Indian investors. Adding equities into the mix brings out the extreme volatility of Indian stocks:
However, the silver-lining is that Indian asset volatility have been moderating since 2015.
The 60/40
Over a long enough timeline, it looks like the 60/40 should work in India as well.
But, what if, most of the long-term returns that can be seen since 2000 was front-loaded? Rolling-returns over different windows should give us an idea:
The 5-year window shows returns stabilizing around an average of 5% (in USD.)
Embedded forecasts
All investing is forecasting. As much as one would want to follow a 60/40 allocation for its popularity, it behooves to ask: what are the embedded forecasts about Indian equities and bonds in such a strategy?
Bond volatility will continue to go down.
The market will continue to deepen.
Inflation will be range-bound.
Equities will be loosely efficient.
The gap between growth assumptions and equity valuations will be within a gradually tightening band.
Ease of doing business:
Contract enforcement
Flexible labor laws
Infrastructure
Bankruptcy protection and resolution
Policy stability
Basically, India will move towards an environment with a predictable tax regime, a rules-based fiscal policy, and regulations that are fair and strictly enforced.
Take-away
There are millions of permutations and combinations of securities for investors to allocate. The question that every investor should ask themselves is how much time, effort and money they are willing to spend chasing returns that beats low-cost, set-it-and-forget-it strategies like the 60/40.
If you are in investor who craves simplicity & low-cost and your beliefs about the future is mostly in line with the assumptions presented above, then this is the strategy for you.
Every advisor you speak to likely extolls the virtues of diversification. “Buy stocks, bonds, gold, real-estate in x/y/z proportion.” Since no one can predict future returns of individual assets, by buying all of them, investors can protect themselves from steep drawdowns.
But what exactly is “diversification?” Is it right for you? Over what assets should you diversify? And how long should you wait before you expect to see the benefits of such diversification?
There are several theories on sex and all of them are lies. – Santosh Kalwar
Before we dive into the how/what/when, let’s set the backdrop through which we’ll discuss the topic.
American Exceptionalism
Most portfolio research is conducted with US Dollar assets trading in America. It is then ported over unquestioningly to other markets. However, there is no other country like America – the only country in the world that can print US Dollars that every other country in the world needs to hold as a reserve asset. This gives US assets a steady, unrelenting bid.
For example, government bonds are supposed to be low-volatility assets with limited downside. However, Indian investors have a completely different experience compared to Americans with it comes to investing in them. Here’s the rolling 3-year standard deviation of weekly returns of Indian 10-year gilts (in USD) and a US fixed-income fund for comparison.
Not only are Indian bonds more volatile, they have +30% drawdowns that take years to recover.
In a flight-to-safety, Indian bonds get sold and American bonds get bought.
The 60/40 Buy and Hold
Since the mid-90’s, an American investing in American assets did spectacularly well. Not just in equities…
… but in bonds as well.
An US-based advisor can be excused for beating the drum of buy-and-hold. After all, US equities and bonds have always recovered. And they can afford to keep-it-simple with a static 60/40 allocation between stocks and bonds.
However, look at the performance of Emerging Market (EM) equities and bonds. An absolute disaster both in terms of returns and volatility.
So, when advisors wax eloquent of the 60/40 portfolio, what they really mean is US Equity/US Bond 60/40 portfolio. Investors in the rest of the world, especially in EMs like India, will do well to formulate a strategy that works given their reality rather than blindly following US-centric allocations and strategies.
King Dollar
While the US Dollar has appreciated against most currencies since 2010, it is nothing compared to how much it has appreciated against the Indian Rupee.
A falling currency is a headwind against a portfolio trying to preserve purchasing power and presents a performance hurdle of sorts.
While USDINR is not the worst currency pair out there, it pays to think of portfolios in Dollar terms.
The Streetlight Effect
A policeman sees a drunk man searching for something under a streetlight and asks what the drunk has lost. He says he lost his keys and they both look under the streetlight together. After a few minutes the policeman asks if he is sure he lost them here, and the drunk replies, no, that he lost them in the park. The policeman asks why he is searching here, and the drunk replies, “this is where the light is.”
The Center for Research in Security Prices (CRSP) was founded in 1960. They went live in 1964. Initially, the center’s database consisted of monthly share prices of common stock trading on the NYSE, dating back to 1926. Over time, the database grew in size, introducing other exchanges and securities, as well as daily updates.
In India, the Total Return NSE mid-cap index prices are available only from 2005. In search of robustness, researchers use US datasets by default. However, every market is different because the political backdrop in which they operate are different. It is called the political economy for a reason. So, before taking US financial research at face-value, it behooves us to understand the qualitative drivers behind the numbers: are regulation, politics and market structure similar enough for the data-set being analyzed that the conclusions can be applied to the target market?
Besides, with limited datasets, it is easy to play games by cherry-picking data and begin/end dates to fit a narrative. Here is a sample:
OVER THE LAST 10 YEARS, NIFTY 50’s DOLLAR RETURNS TRAIL THE S&P500’s BY A WHOPPING 6.5%
OVER THE LAST 15 YEARS, NIFTY 50’s DOLLAR RETURNS TRUMP THE S&P500’s BY A WHOPPING 3.5%
While trying to figure out the right asset mix and investment strategy, Indian investors have to recognize that they may be looking through a tinted window, at a small dataset.
The Allure of Commodities
The theory behind investing in commodities is that they offer an inflation hedge unmatched by most other asset classes. While the relationship between commodities and equities varies considerably – at times there is a negative correlation – on average, they show a low but positive correlation.
Here comes the BUT: the dataset used to analyze these relationships largely covers prices before commodities were financialized, democratized and packaged into ETFs that can be traded by mom-and-pop investors by the click of a button.
While some advisors may hold onto the trope that commodities “work” if actively managed, historical performance of such funds have been a disaster.
The best way to become a millionaire is to start with a billion dollars and invest in commodities.
Take-away
While diversification is often recommended as a “free lunch” that every investor can partake, a lot depends on the assets that go into the basket. Each one of them have “worked” in the past for different reasons. Increasing financialization means that assets that were uncorrelated in the past because of trading friction suddenly become correlated during market panics. Currency depreciation is a real problem for Indian investors, silently eroding purchasing power.
Portfolio construction should be done against this backdrop – not blindly throwing together a bunch of assets and hoping that it works. We will discuss some of these approaches in subsequent posts.
There is perhaps no bigger wealth destroyer than the government.
“If you put the federal government in charge of the Sahara Desert, in 5 years there’d be a shortage of sand” – Milton Friedman
It sounds logical that State Owned Enterprises (SOE) will lag their private sector counterparts. The most obvious reason being that incentive structure of both sectors makes a lot of difference.
A company run where everyone is driven to achieve more efficiency and compete in order to deliver value to its shareholders and managers are incentivized to achieve that goal will always do better than SOEs.
But in India it’s not mere underperformance but pure wealth destruction, which cannot only be attributed to lack of business acumen or slow agility.
It’s mix of that with heavy load of political influence. The short-sightedness and stupidity of the government and at the end the government not thinking about using these enterprises to create wealth.
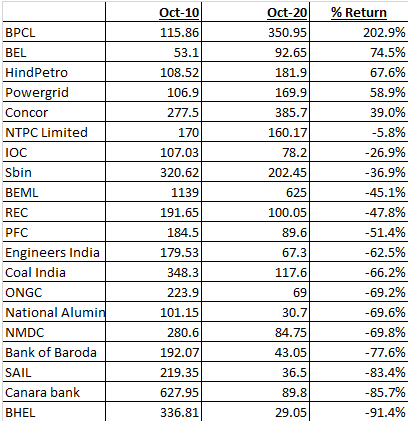
Here is evidence of 20 biggest well-known names and their performance over the last 10 years not counting dividends.
Only 3 companies and actually only BPCL delivering 20%+ annualized returns over the last 10 years and this is also can be attributed because the government is interested in divesting it’s majority stake in it. So it’s the fact the government is getting out is driven the stock, that’s some vote of confidence by the market on the capacity of the state.
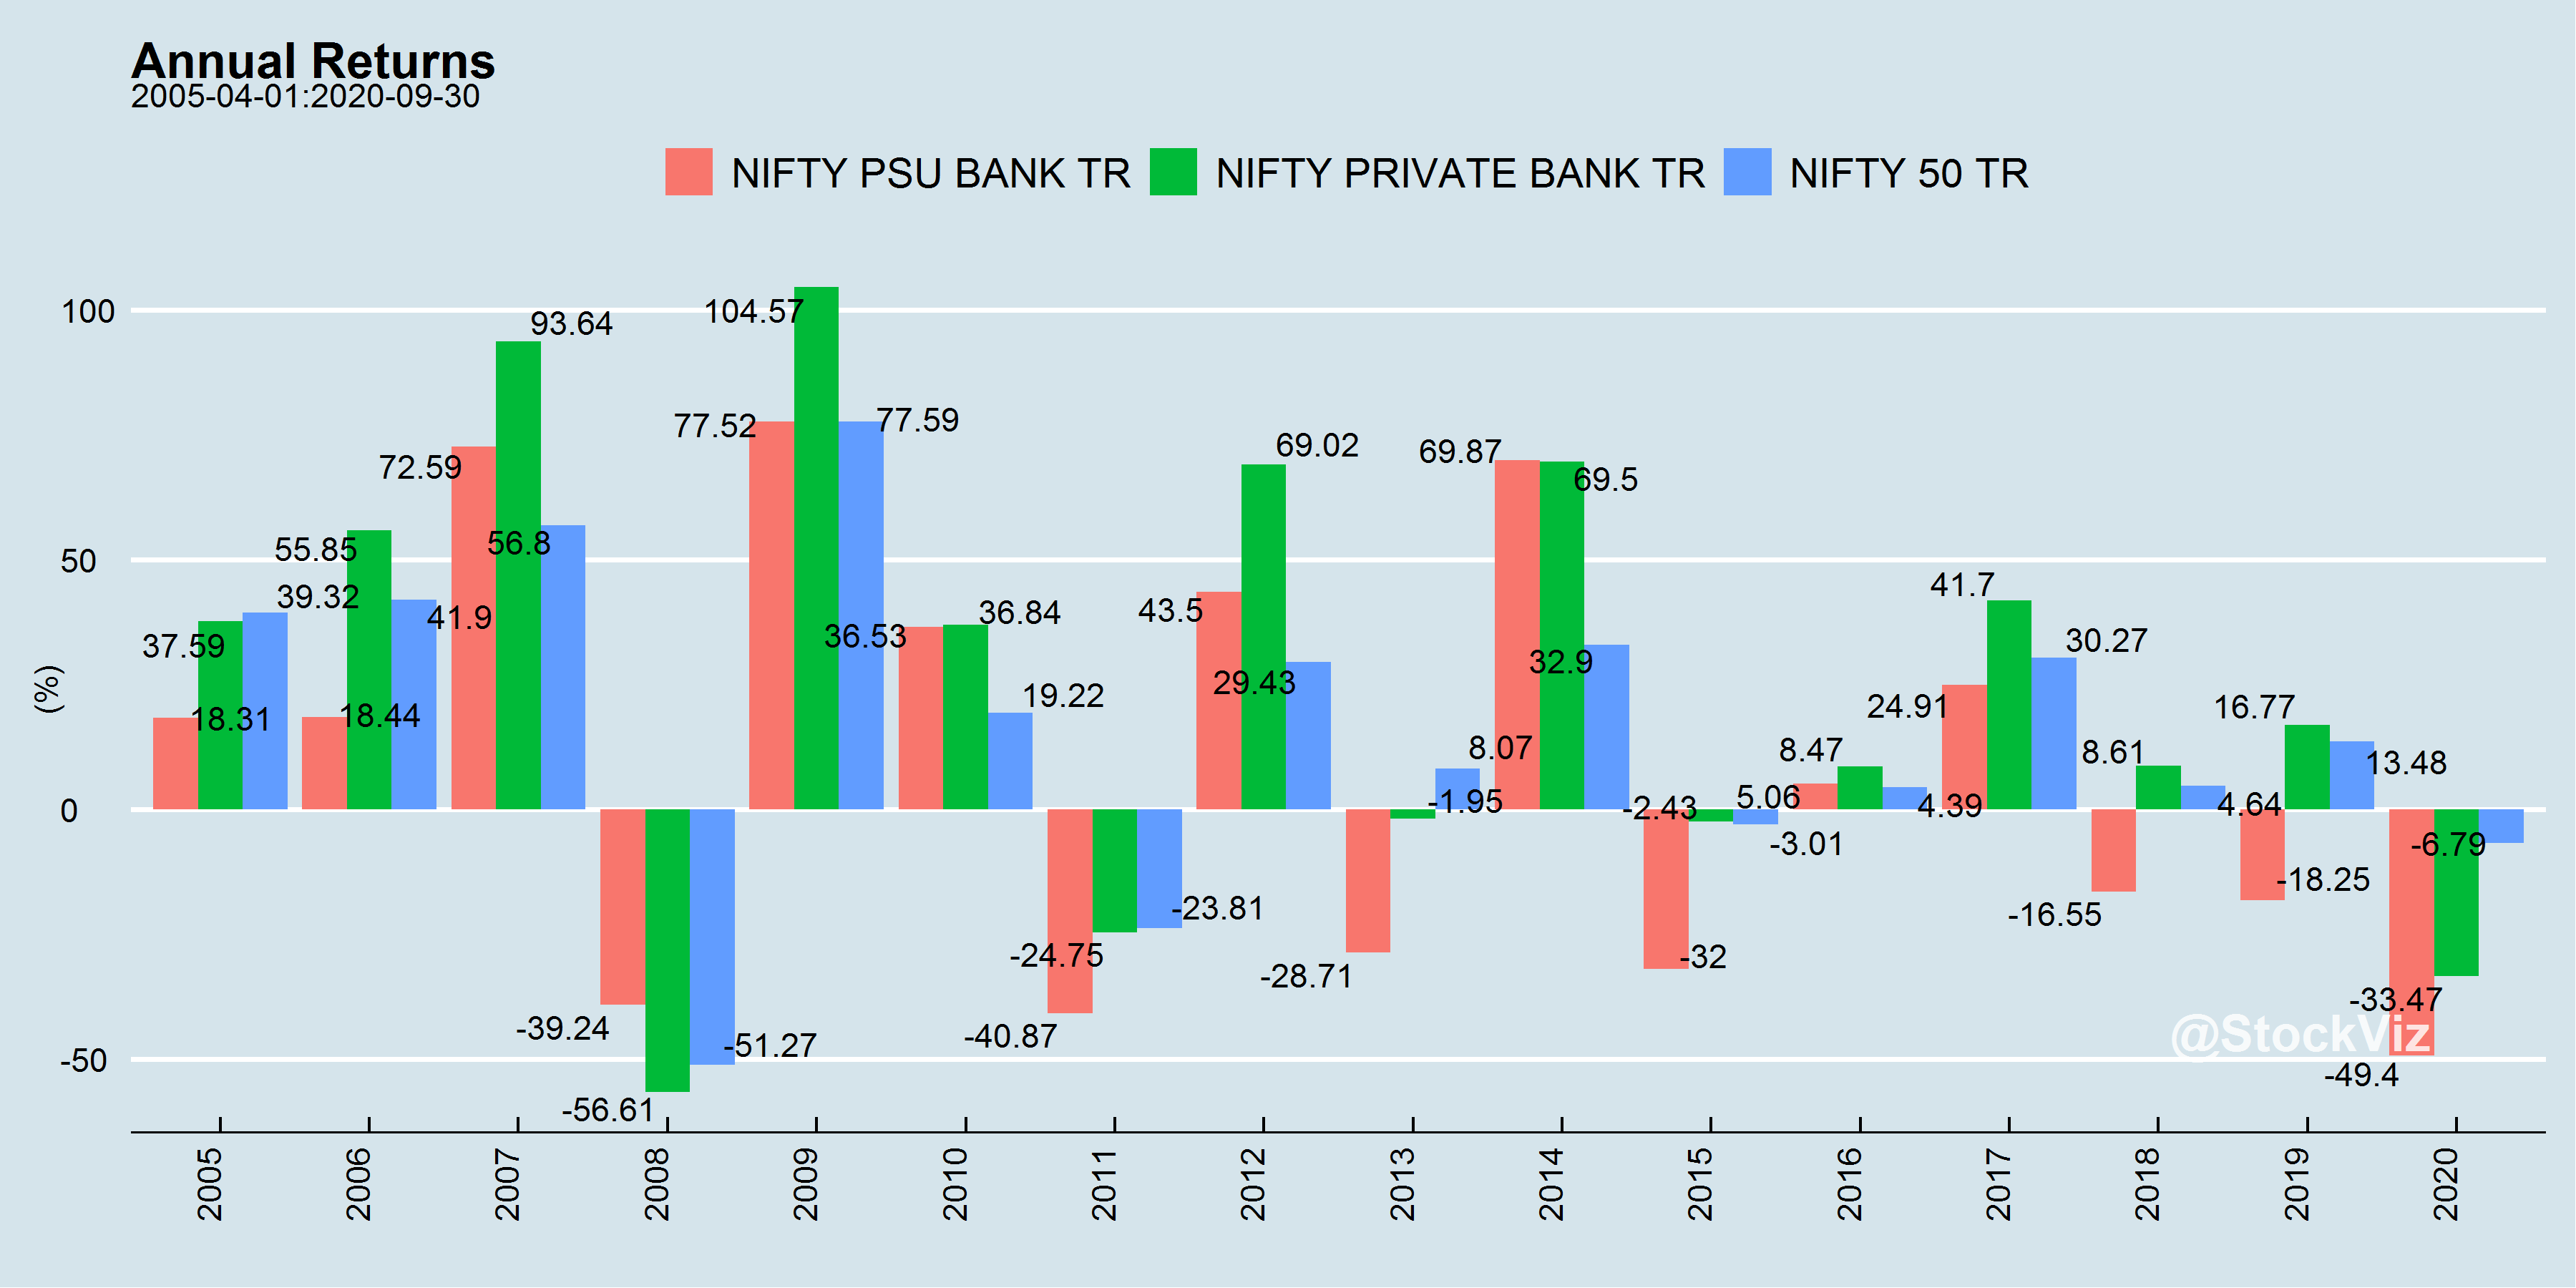
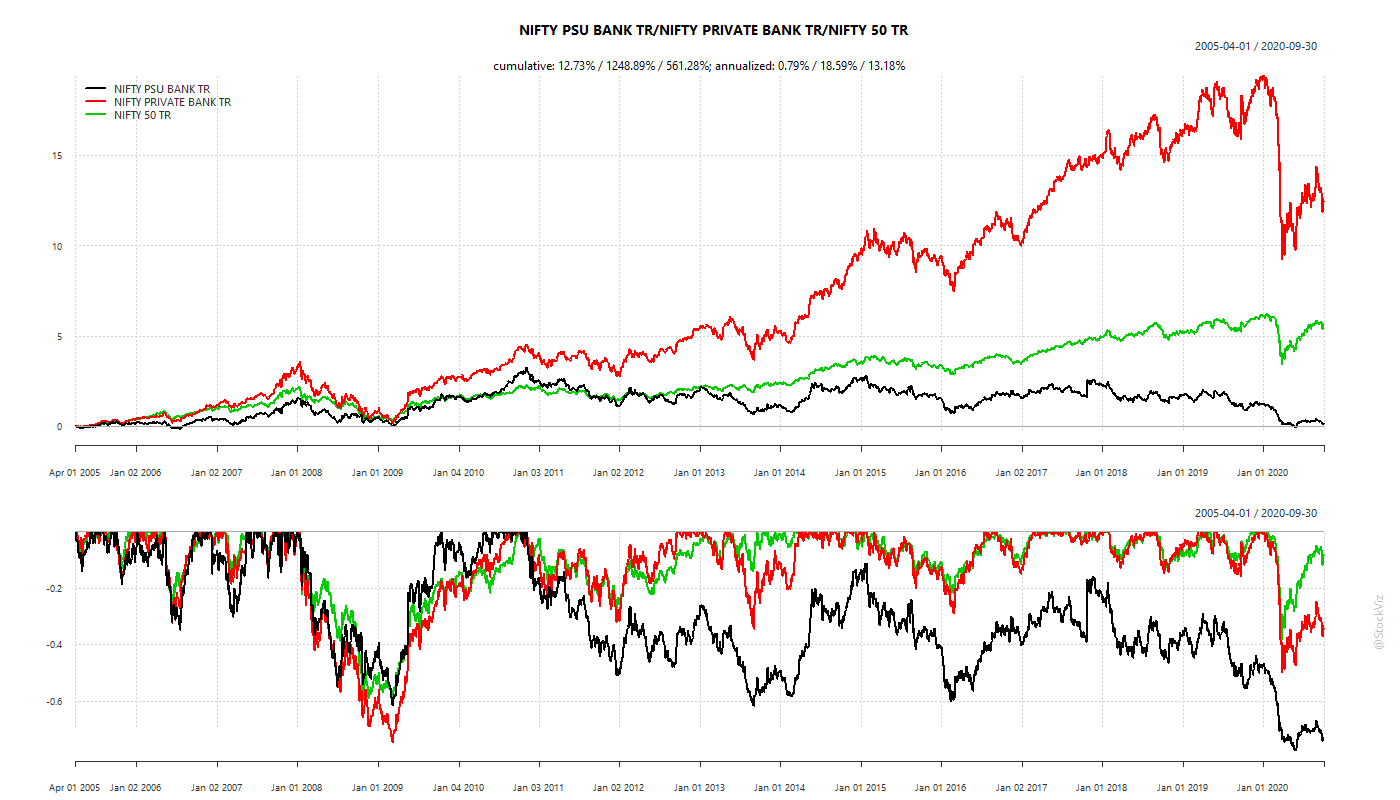
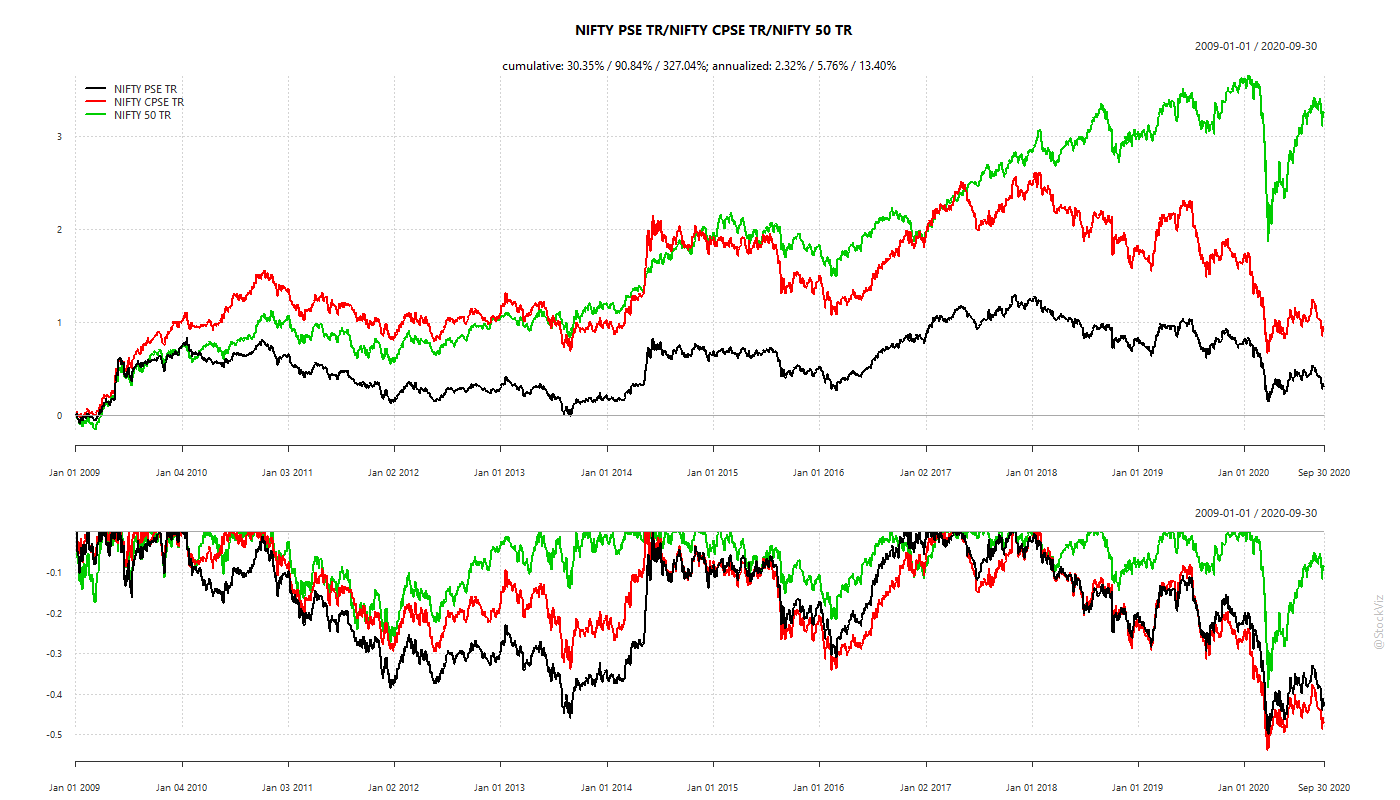
Now let us look at performance of the PSU indices vs Nifty
Consistent underperformance by State owned banks versus private sector in the last 10 years.
Far more underperformance than outperformance.
Apples and rotten apples
We rest our case.
In general just stay away from a government owned companies.
Post Script
The story goes (and it is perhaps apocryphal) that Gorbachev sent a key aide to London to learn a thing or two about what the British were doing well, which the Soviets clearly weren’t.
The British played good hosts and Gorbachev’s aide was taken for a tour of the city with places like the London Stock Exchange and the London School of Economics being on the itinerary.
As Yuval Noah Harari writes in Homo Deus—A Brief History of Tomorrow: “After a few hours, the Soviet expert burst out: ‘Just one moment, please… We have been going back and forth across London for a whole day now, and there’s one thing I cannot understand. Back in Moscow, our finest minds are working on the bread supply system, and yet there are such long queues in every bakery and grocery store.”
Gorbachev’s aide was surprised that in London there were no lines in front of supermarkets and shops for bread, even though millions of people lived in the city. The aide ended up saying: “I haven’t seen a single bread queue. Please take me to meet the person in charge of supplying bread to London. I must learn his secret.”
Of course, it need not be said, there was no one in charge for supplying bread to the city of London. And this is precisely why there were no queues.
Our previous discussions on timing revolved around changing exposures to all factors. This includes both price based factors (volatility, momentum) and fundamental factors (quality, value.) While my personal preference, given its ease of implementation and low turnover, is factor rotation, multi-factor investing is a legitimate contender as well.
However, in the absence of liquid ETFs and index funds that track these individual factors, implementing such strategies is non-trivial and comes with cost-challenges and tracking errors. At the same time, being exposed to a single factor is a test of endurance – very few investors have the patience and time-horizon to stick through the ebb and flow single-factor portfolios. We touched upon this on our post of Magic Formula, a deep-value investment strategy.
So, is there a simple way to time a single factor?
Today, we pick the Value factor and run through some intuitive approaches to time it.
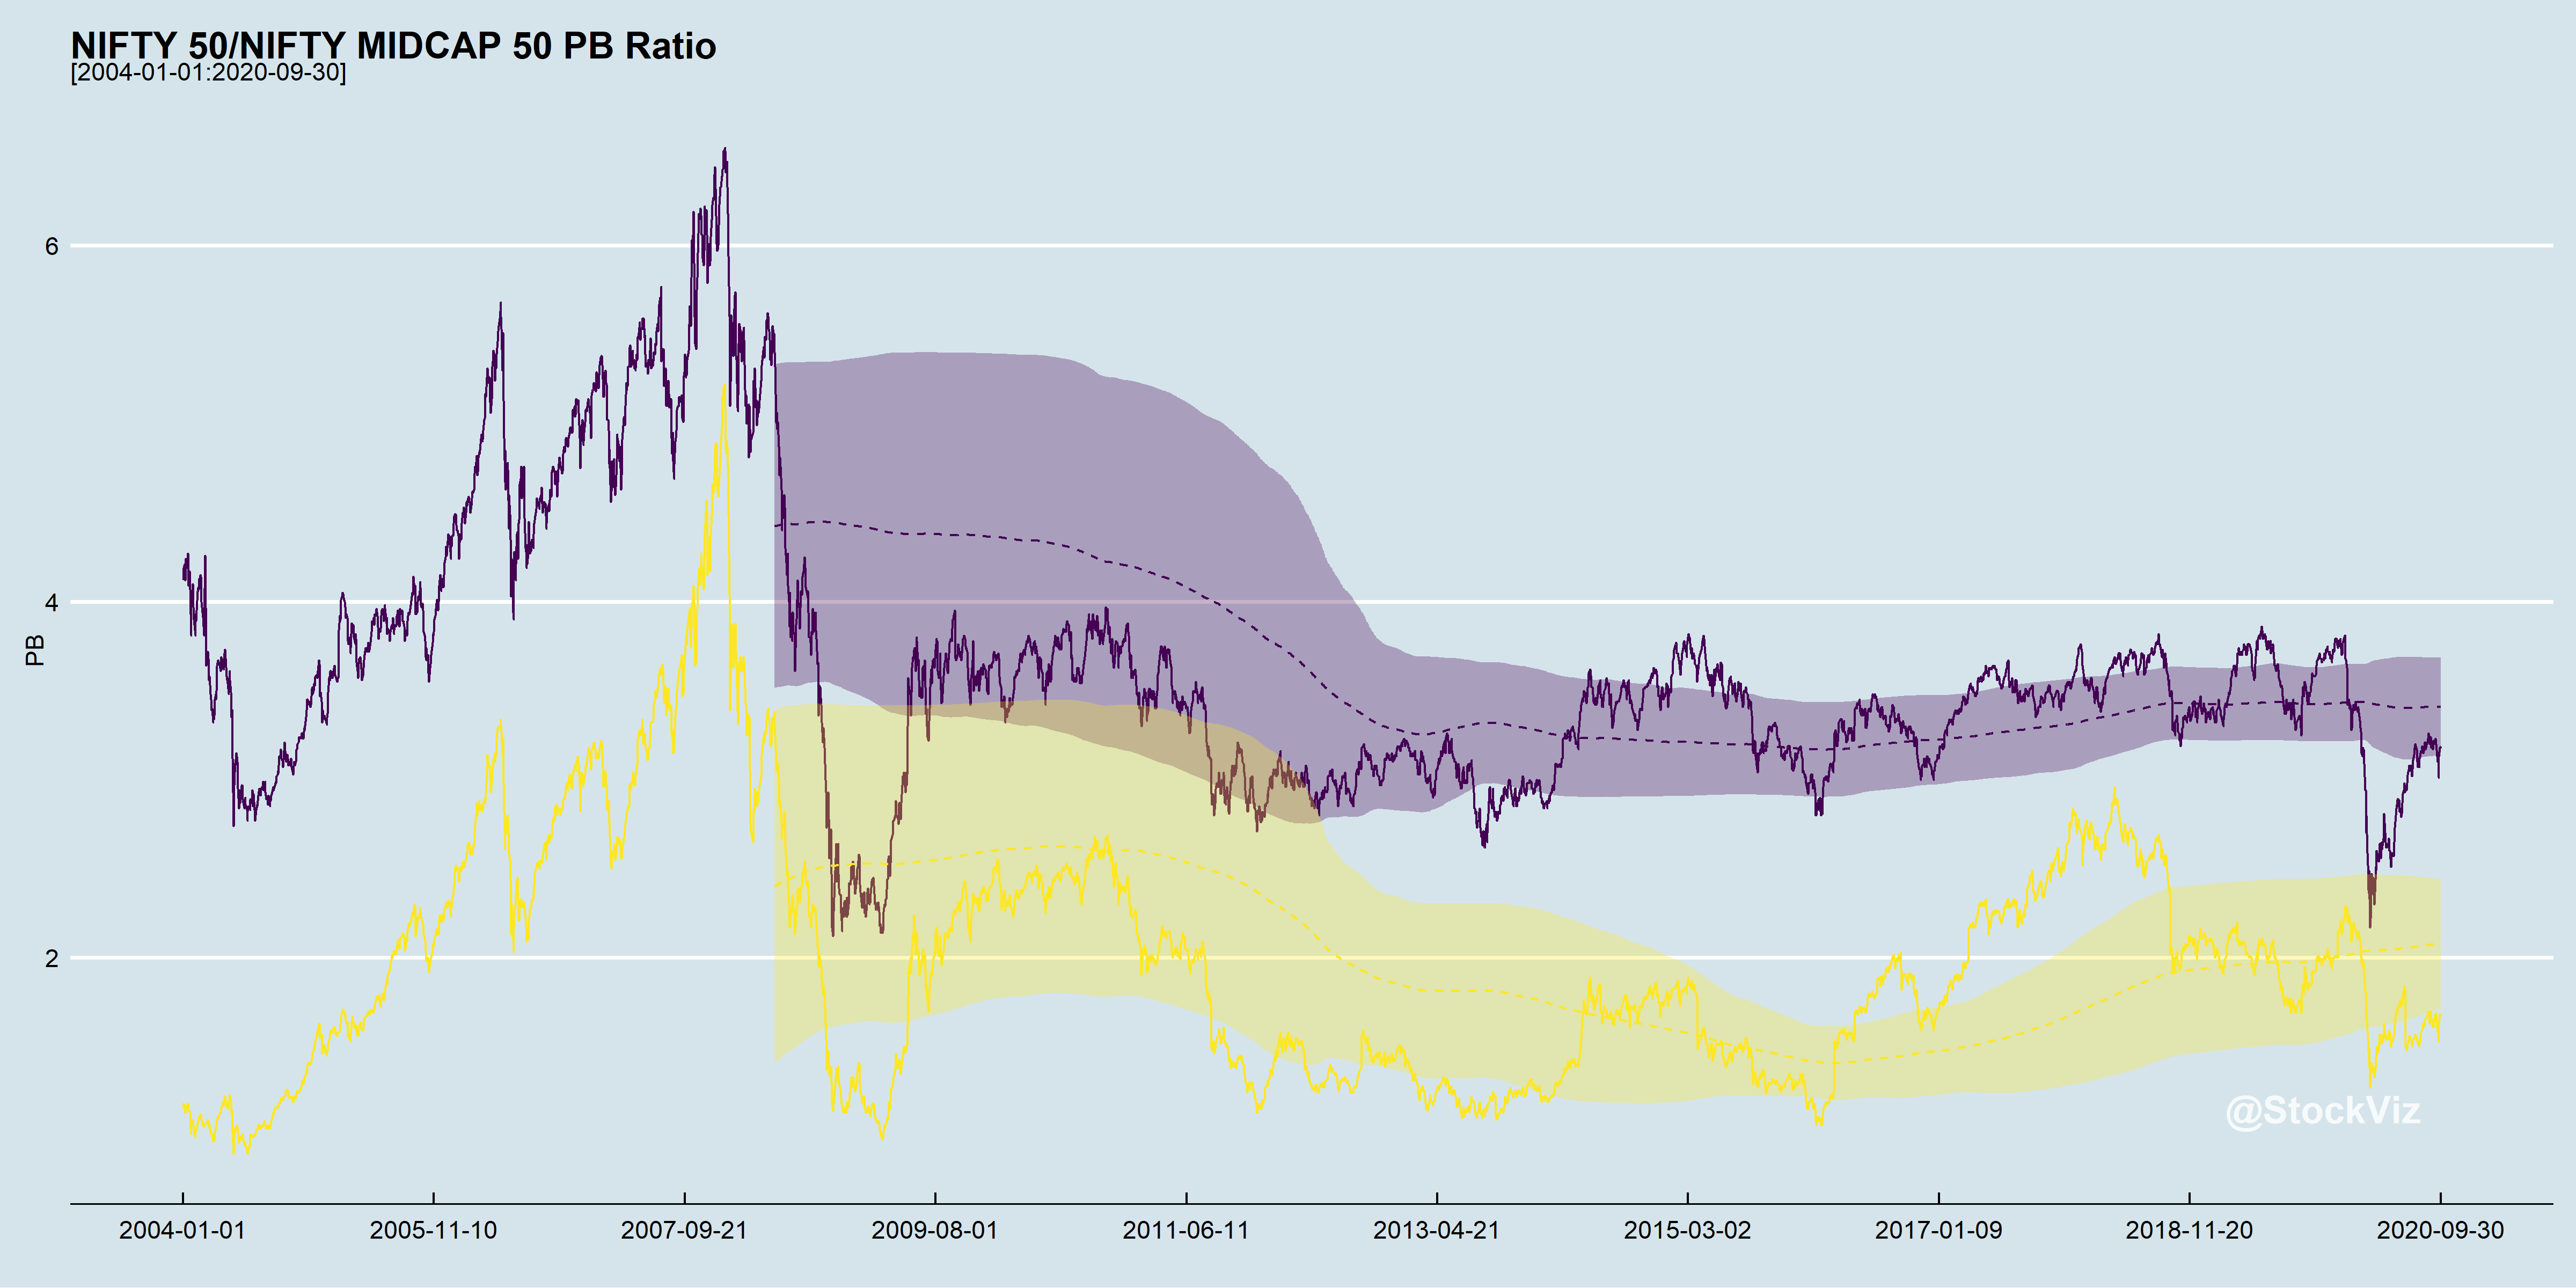
The Market Price-to-Book
Value factor strategies use relative value rankings to create portfolios. The problem with relative value is that if the market as a whole is expensive, which it usually is at the peak of bull markets, then the portfolio ends up with junk that can’t find a bid even during a bullish regime. Consequently, when the market inevitably turns, these portfolios suffer steep drawdowns.
What if, we were long the value factor only when the market is between a one-standard-deviation of historical valuations?
Timing the Value Factor
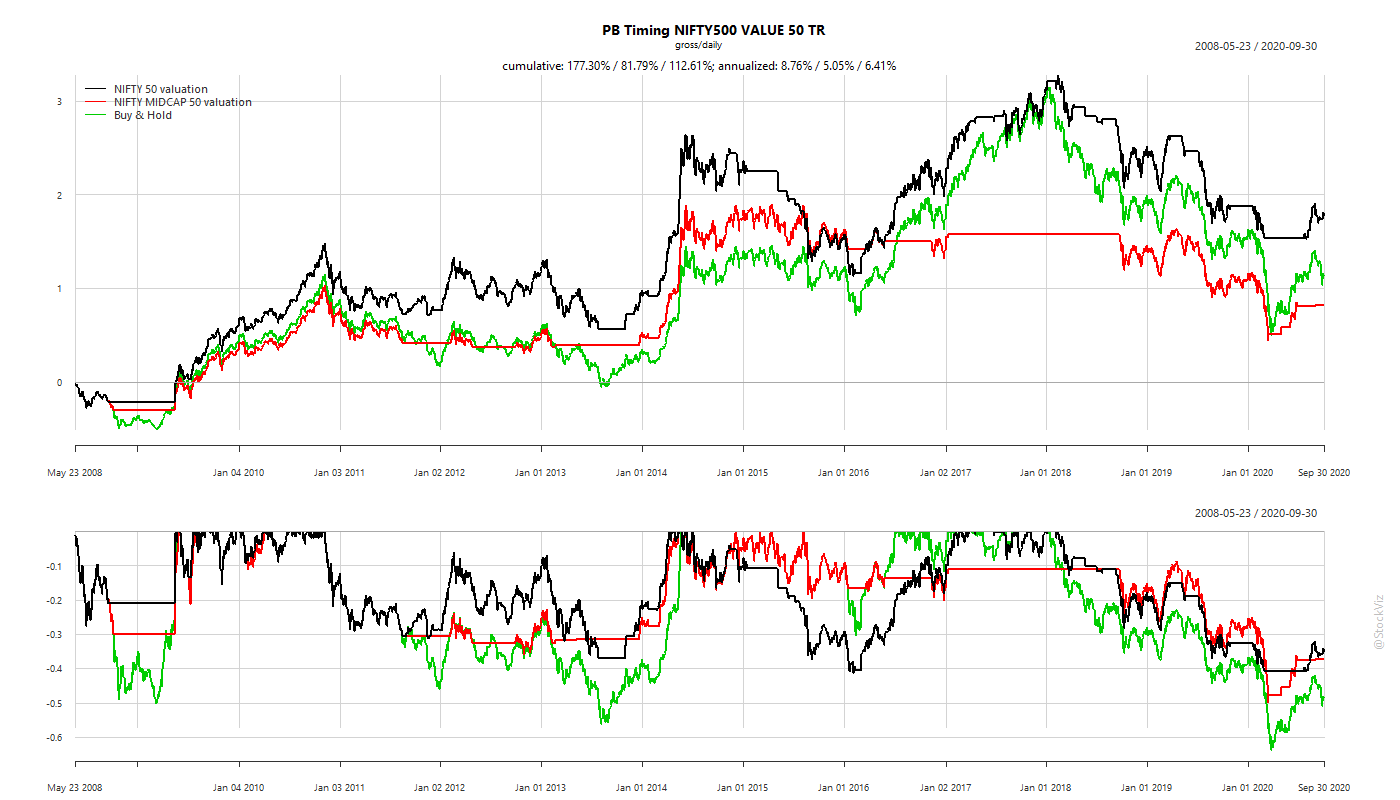
We go long the NIFTY500 VALUE 50 TR index if NIFTY 50 (alternately, MIDCAP 50) price-to-book is between bands. Stay in cash otherwise.
Using the NIFTY 50 PB ratio holds promise with annualized returns of the strategy clocking in at 8.75% vs. buy-and-hold’s 6.41% and shallower drawdowns to boot. However, we expect costs and taxes to pare away most of those excess returns.
Also, the problem with strategies that “go to cash” is that it brings with it cash management problems. Investors find other uses for the cash in their account and it is quite possible that when the time comes to buy, the cash would be blocked for use some where else.
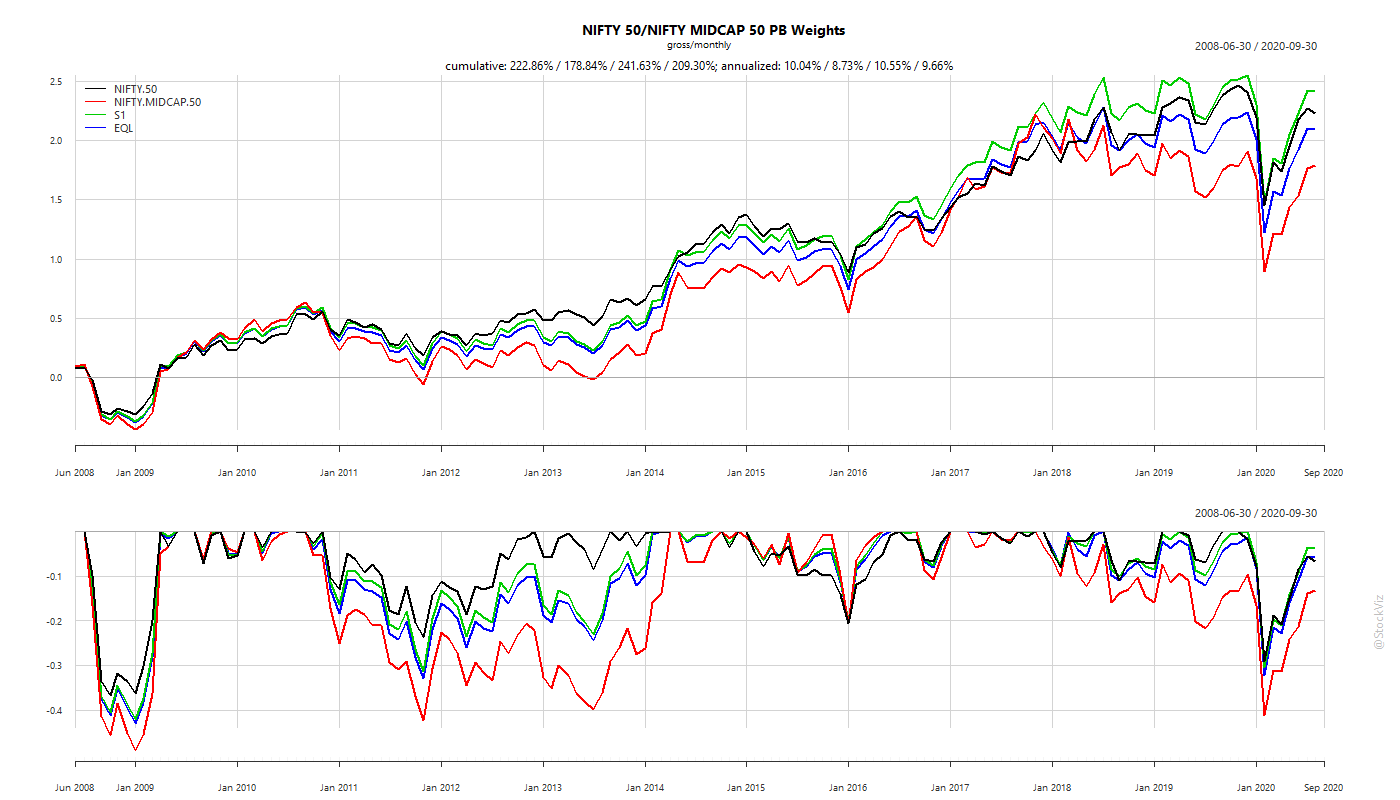
Using Market PB to Manage Exposures
An alternative to timing the Value factor is to change the relative exposures of large and mid-cap allocations based on the market’s price-to-book. Here, you are always invested in the market but over-weight the cheaper index.
Suppose, the relative ratio, R = MIDCAP PB/NIFTY PB
Then, at the end of every month, re-weight the portfolio so that,
S1 = R * NIFTY + (1-R) * MIDCAP
On a monthly rebalance frequency, S1 clocks in a slightly higher annualized return compared to NIFTY 50 TR. However, it remains a disappointment after you consider transaction costs and taxes.
Combining Value and Momentum
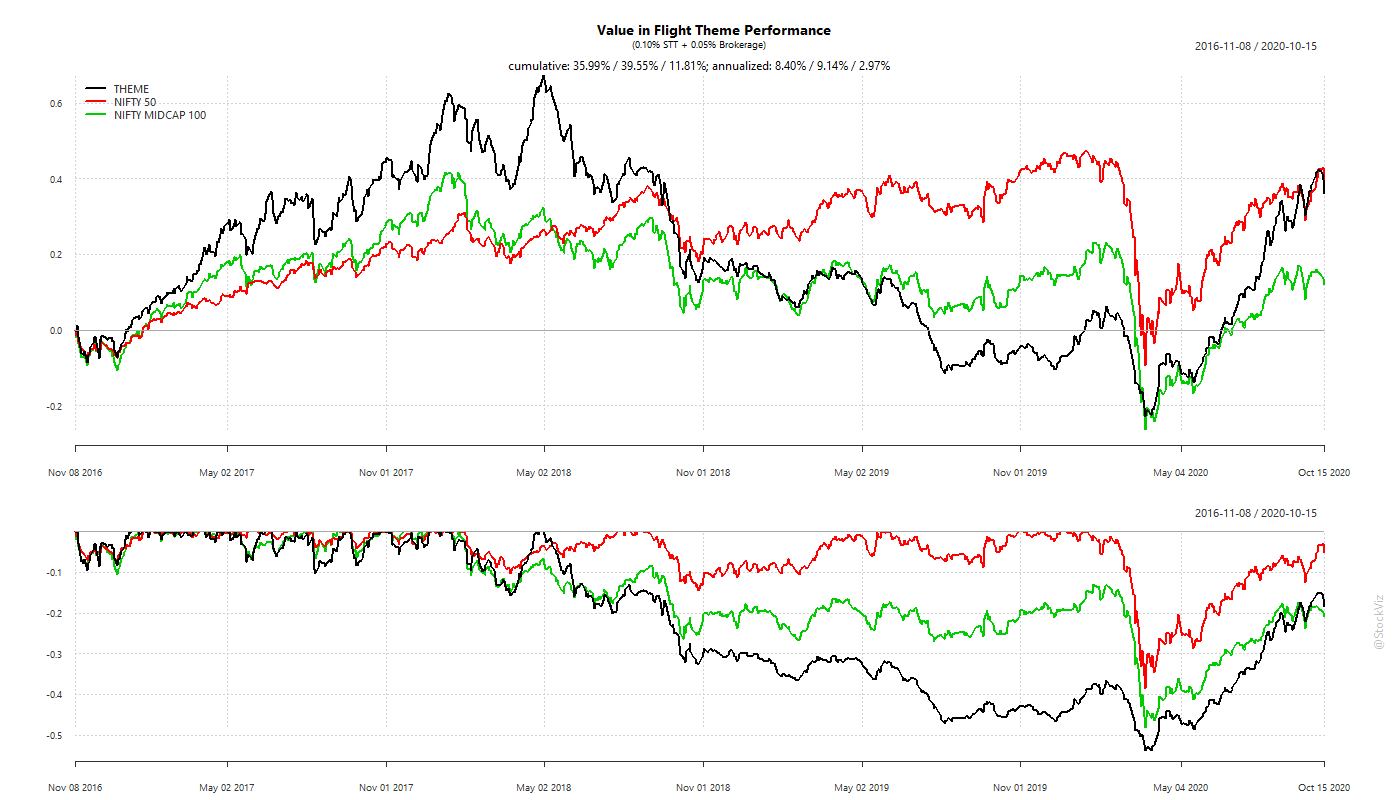
What if, we first applied a relative-momentum cut-off before ranking stocks based on value? And managed risk by having a 10% trailing stop-loss? Would that overcome the adverse selection problem? After all, you are applying a value filter on stocks that are already moving higher.
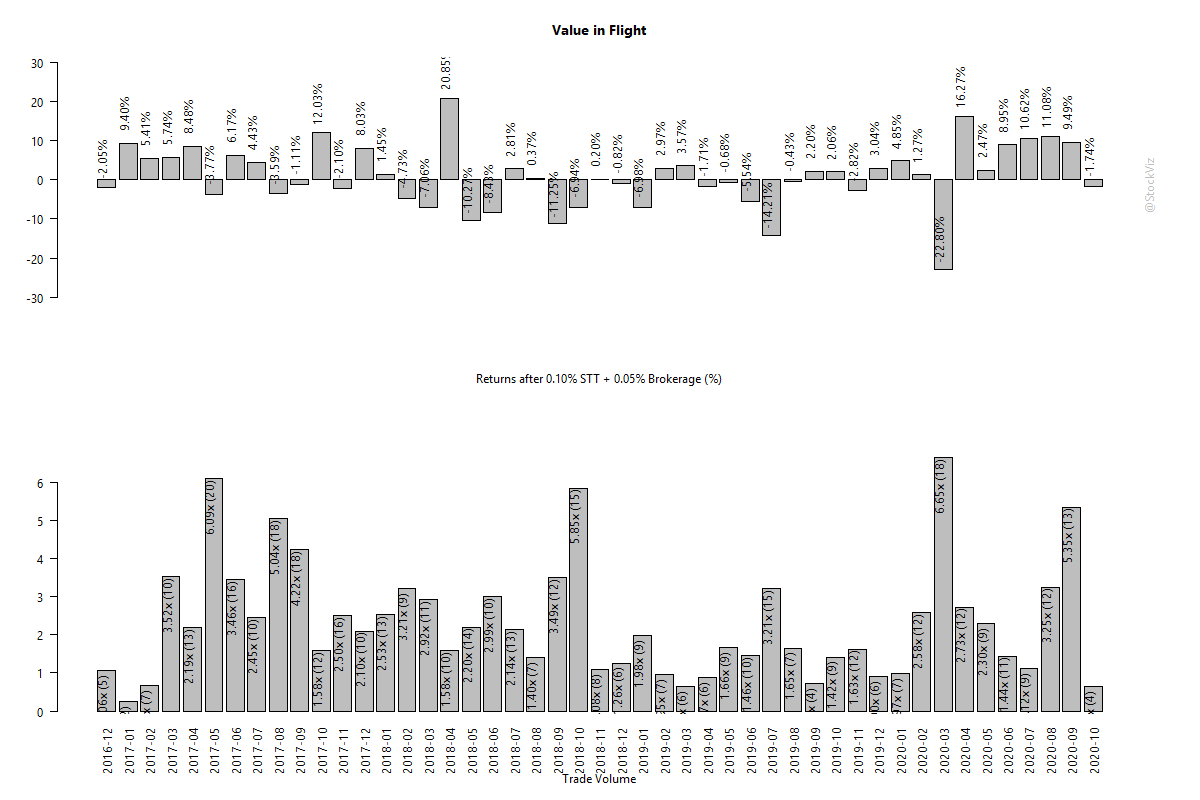
We setup such a portfolio, Value in Flight, to track such a strategy.
What leaps out of this performance chart is that momentum over-powers value both on the upside and on the downside. During a bull market, investors likely fool themselves into believing that they have invested in a “value” portfolio while it is momentum driving returns.
Besides, using momentum with a stop-loss increases churn.
The bottom half of the chart shows how churn increases with market volatility.
It appears that combining value and momentum incurs all the costs of a momentum strategy and all the downsides of a relative-value strategy.
Conclusion
We tested three intuitive approaches to avoid adverse selection in relative value strategies. The first one used market valuations to time the value factor while the second used it to change relative weights within a portfolio. The third tried to combine momentum and value. None of these approaches make sense after considering transaction costs and taxes.
While the number of blind alleys in investment strategy research is potentially unlimited, we believe that the last word on this subject is yet to be written.
In Merchants of Doubt: How a Handful of Scientists Obscured the Truth on Issues from Tobacco Smoke to Climate Change (Amazon,) authors Oreskes and Conway describe how the Big-Tobacco’s efforts to obfuscate evidence against smoking founded an entire industry dedicated to spreading FUD against science.
History shows us clearly that science does not provide certainty. It does not provide proof. It only provides the consensus of experts, based on the organized accumulation and scrutiny of evidence.
There are always uncertainties in any live science, because science is a process of discovery.
The inherent uncertainties involved in the scientific exploration of a topic provides the opening for the Merchants of Doubt. By highlighting these uncertainties and engaging in relentless campaigns of doubt-mongering, these MoDs have twisted the scientific process and created an anti-science brigade.
With the rise of radio, television, and now the Internet, it sometimes seems that anyone can have their opinion heard, quoted, and repeated, whether it is true or false, sensible or ridiculous, fair-minded or malicious. The Internet has created an information hall of mirrors, where any claim, no matter how preposterous, can be multiplied indefinitely. And on the Internet, disinformation never dies.
Is it any wonder that there are people who still believe that the Earth is flat?
Recommendation: When you read this book along with This Is Not Propaganda, you’ll want to kill-off all social media/messaging companies and see yourself agreeing with the basic plot of Utopia. So, avoid, to preserve sanity.