On StockViz, we have over 50 quantitative models that are available for investing. They all have different risk and return profiles. It is fairly simple to pull up, say, the Sharpe Ratio of a particular model by navigating to its home page. However, it doesn’t say how it compares to all the other models we have going.
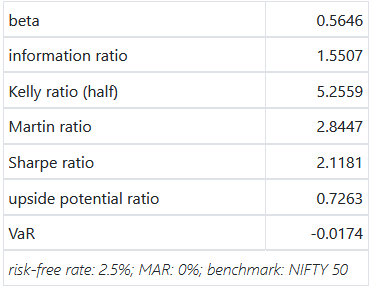
Let’s say you are looking to invest in one of our “Rapid-fire” Momo strategies. Our oldest ones are Relative, Velocity and Acceleration. Their (gross) performance metrics are displayed in a table.
Relative
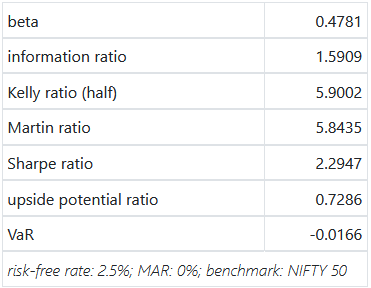
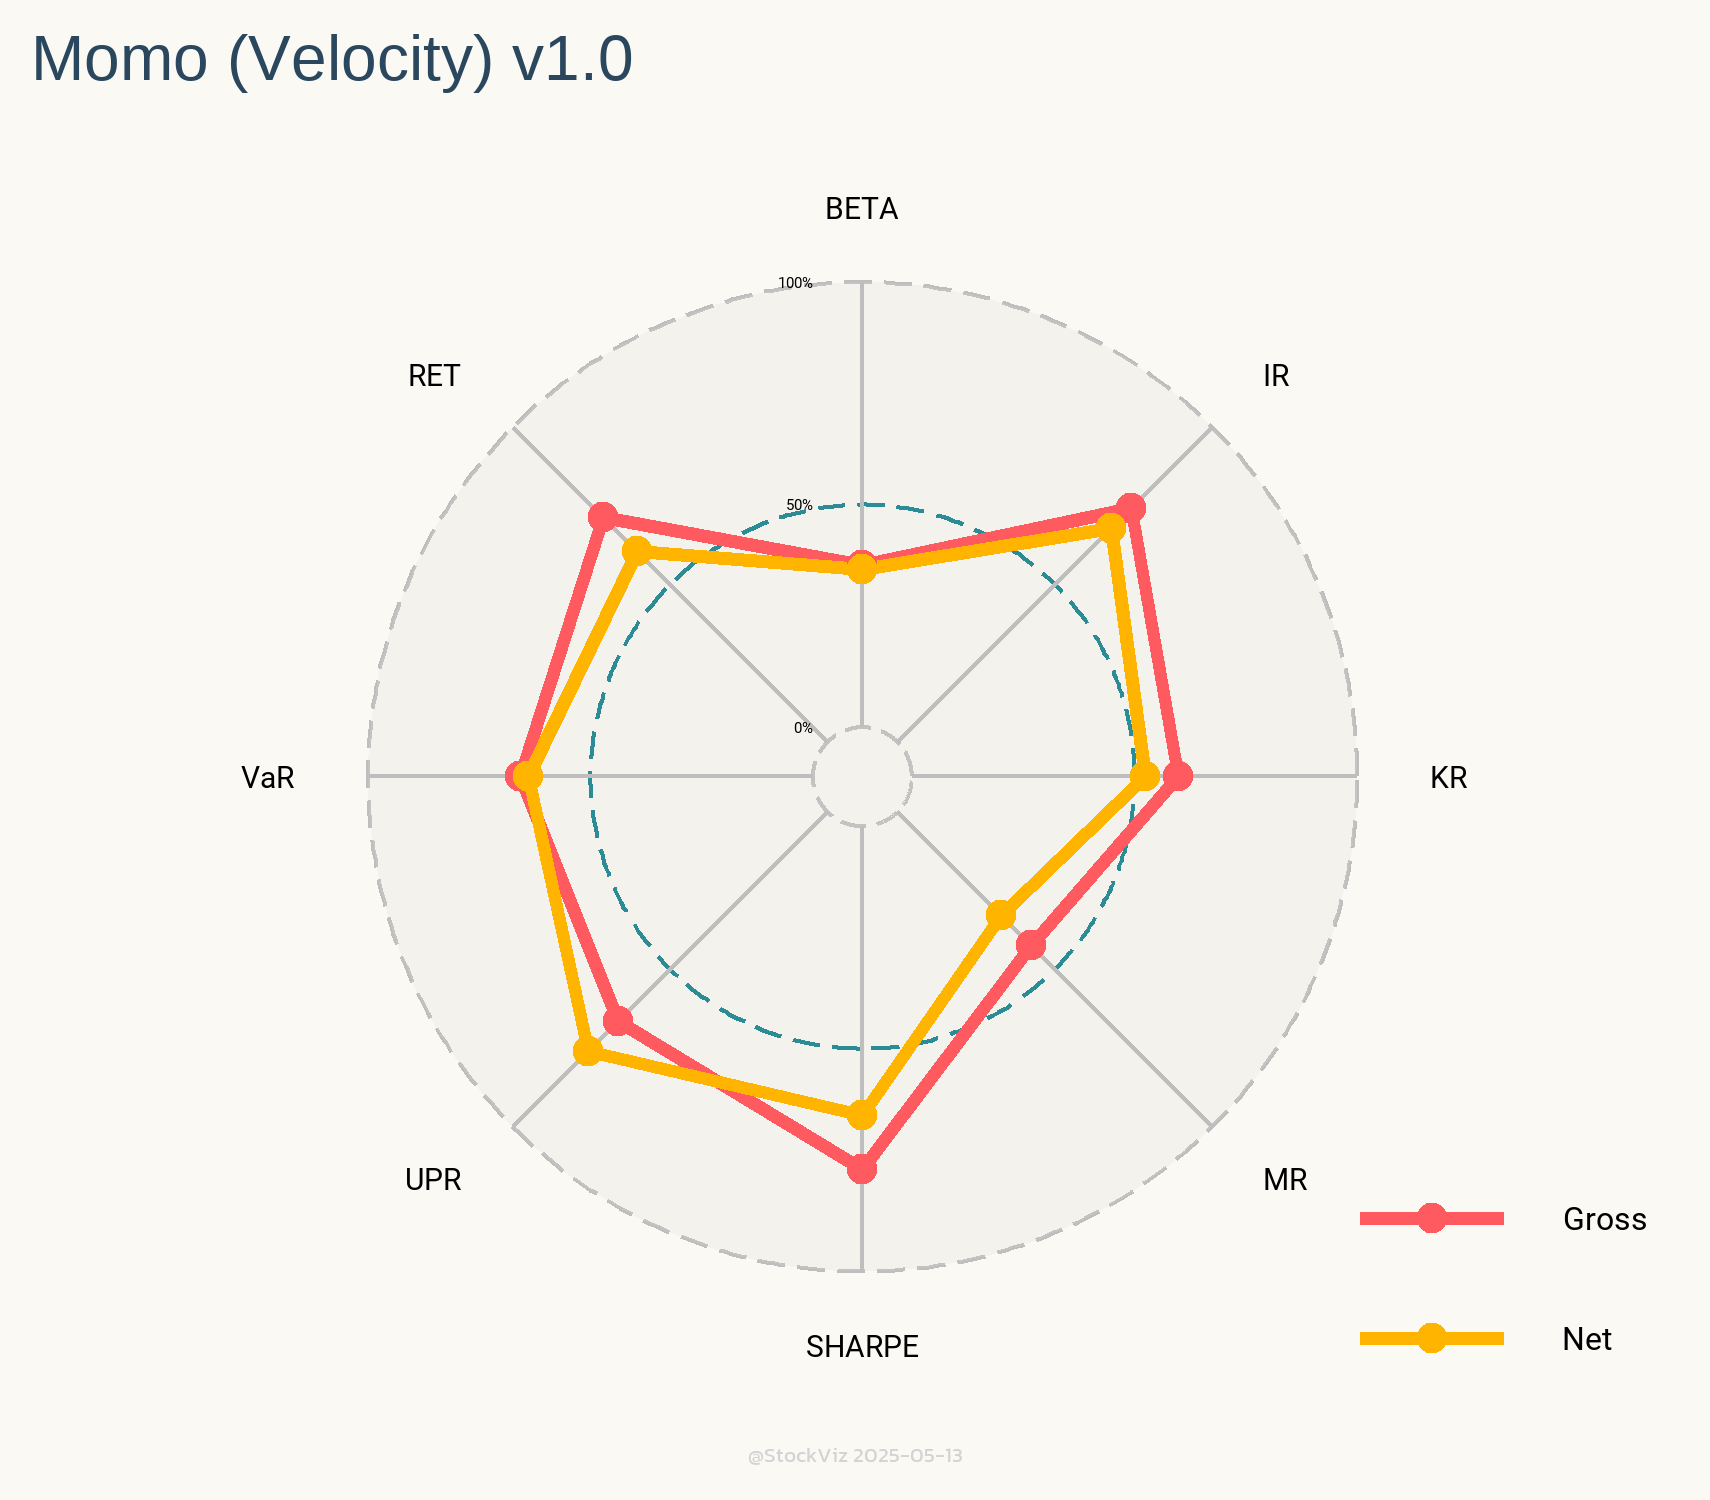
Velocity
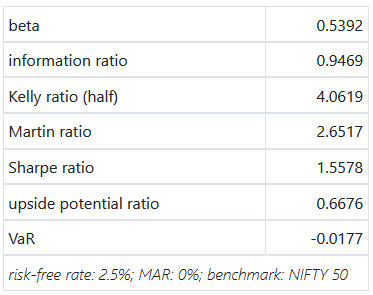
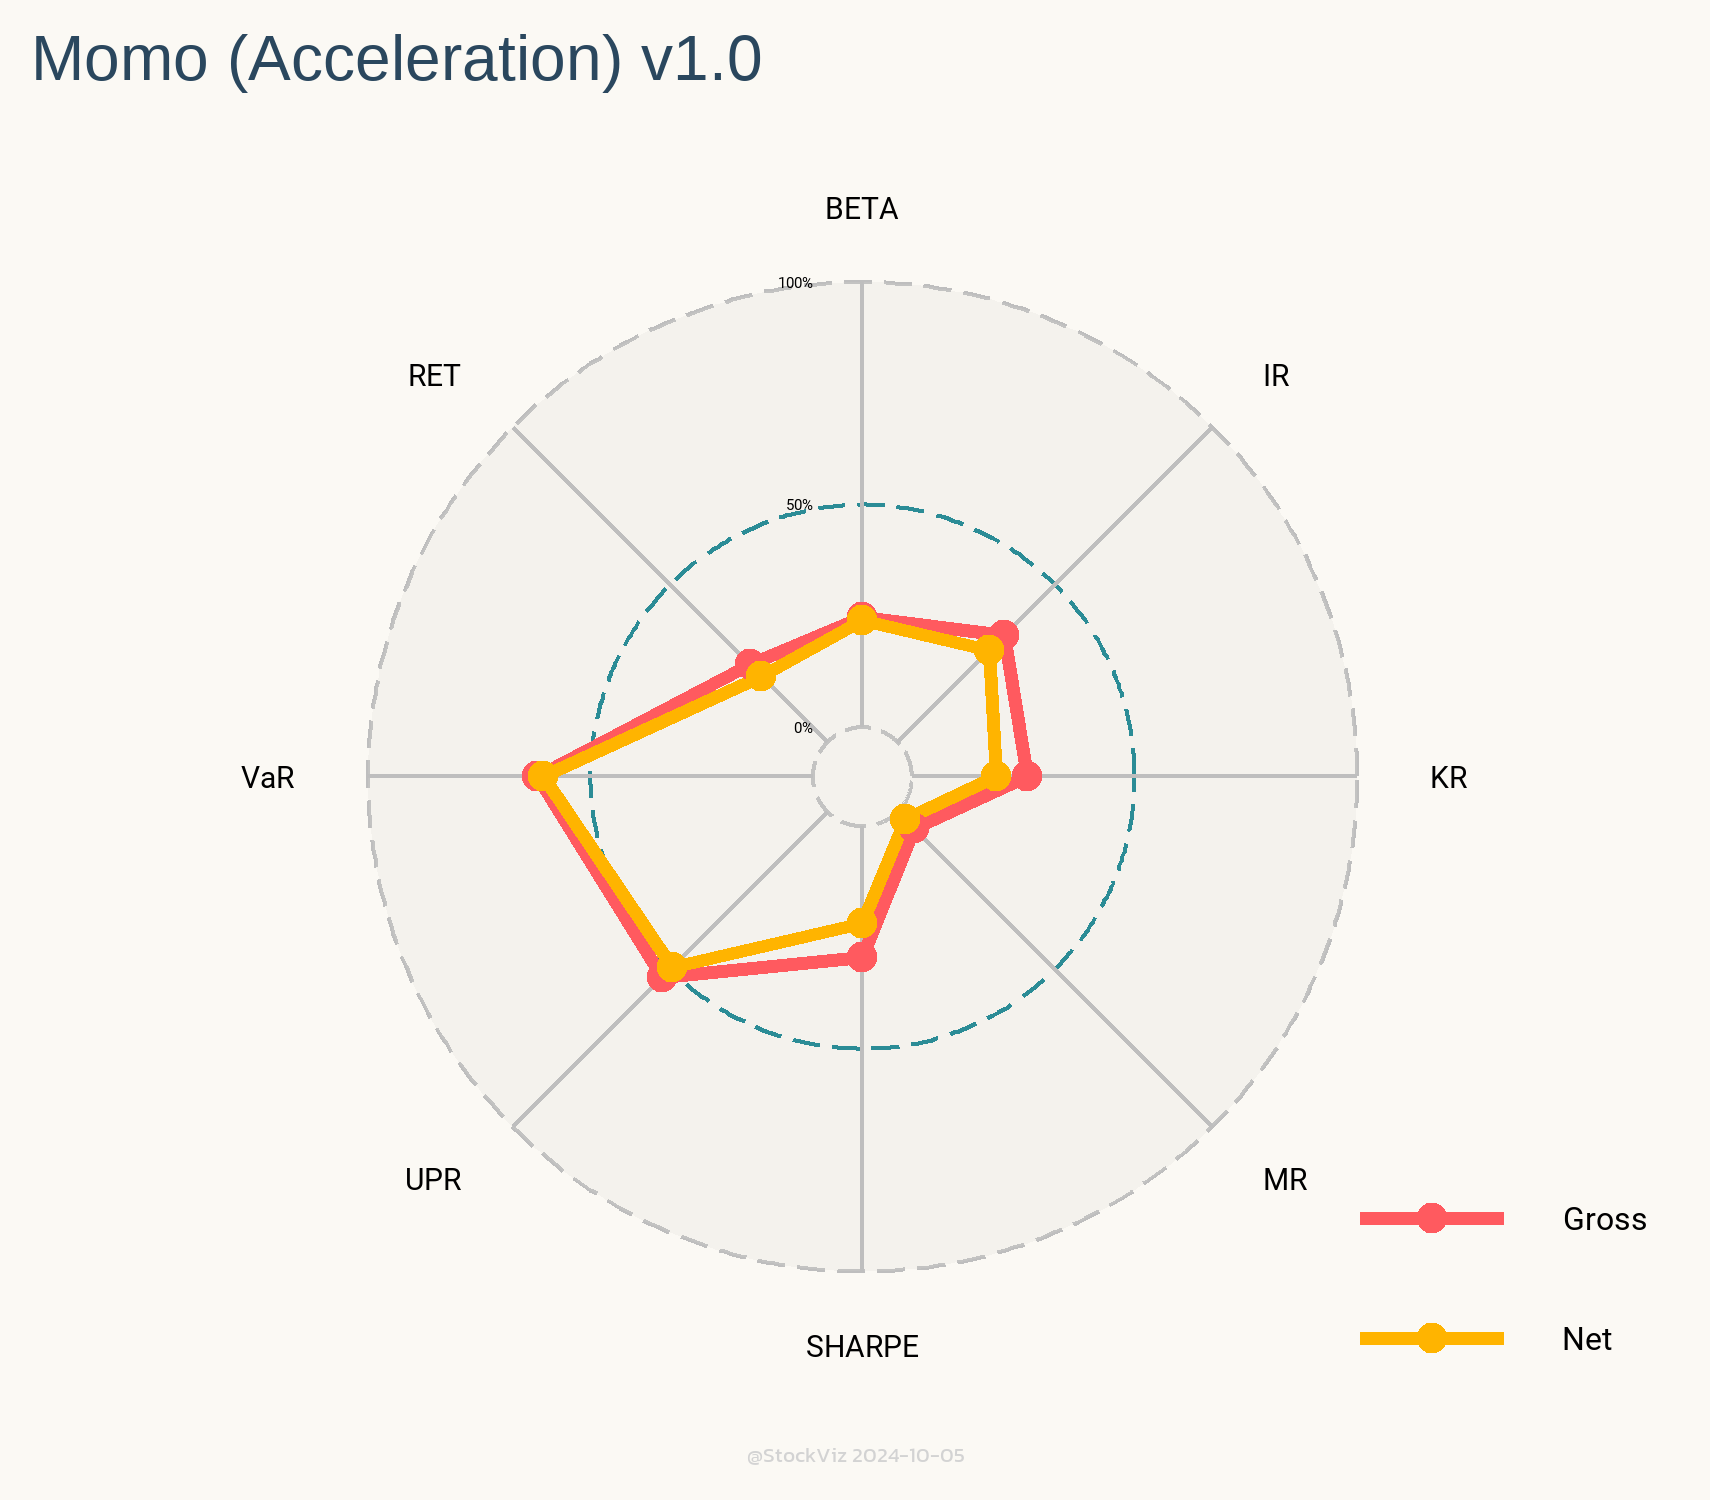
Acceleration
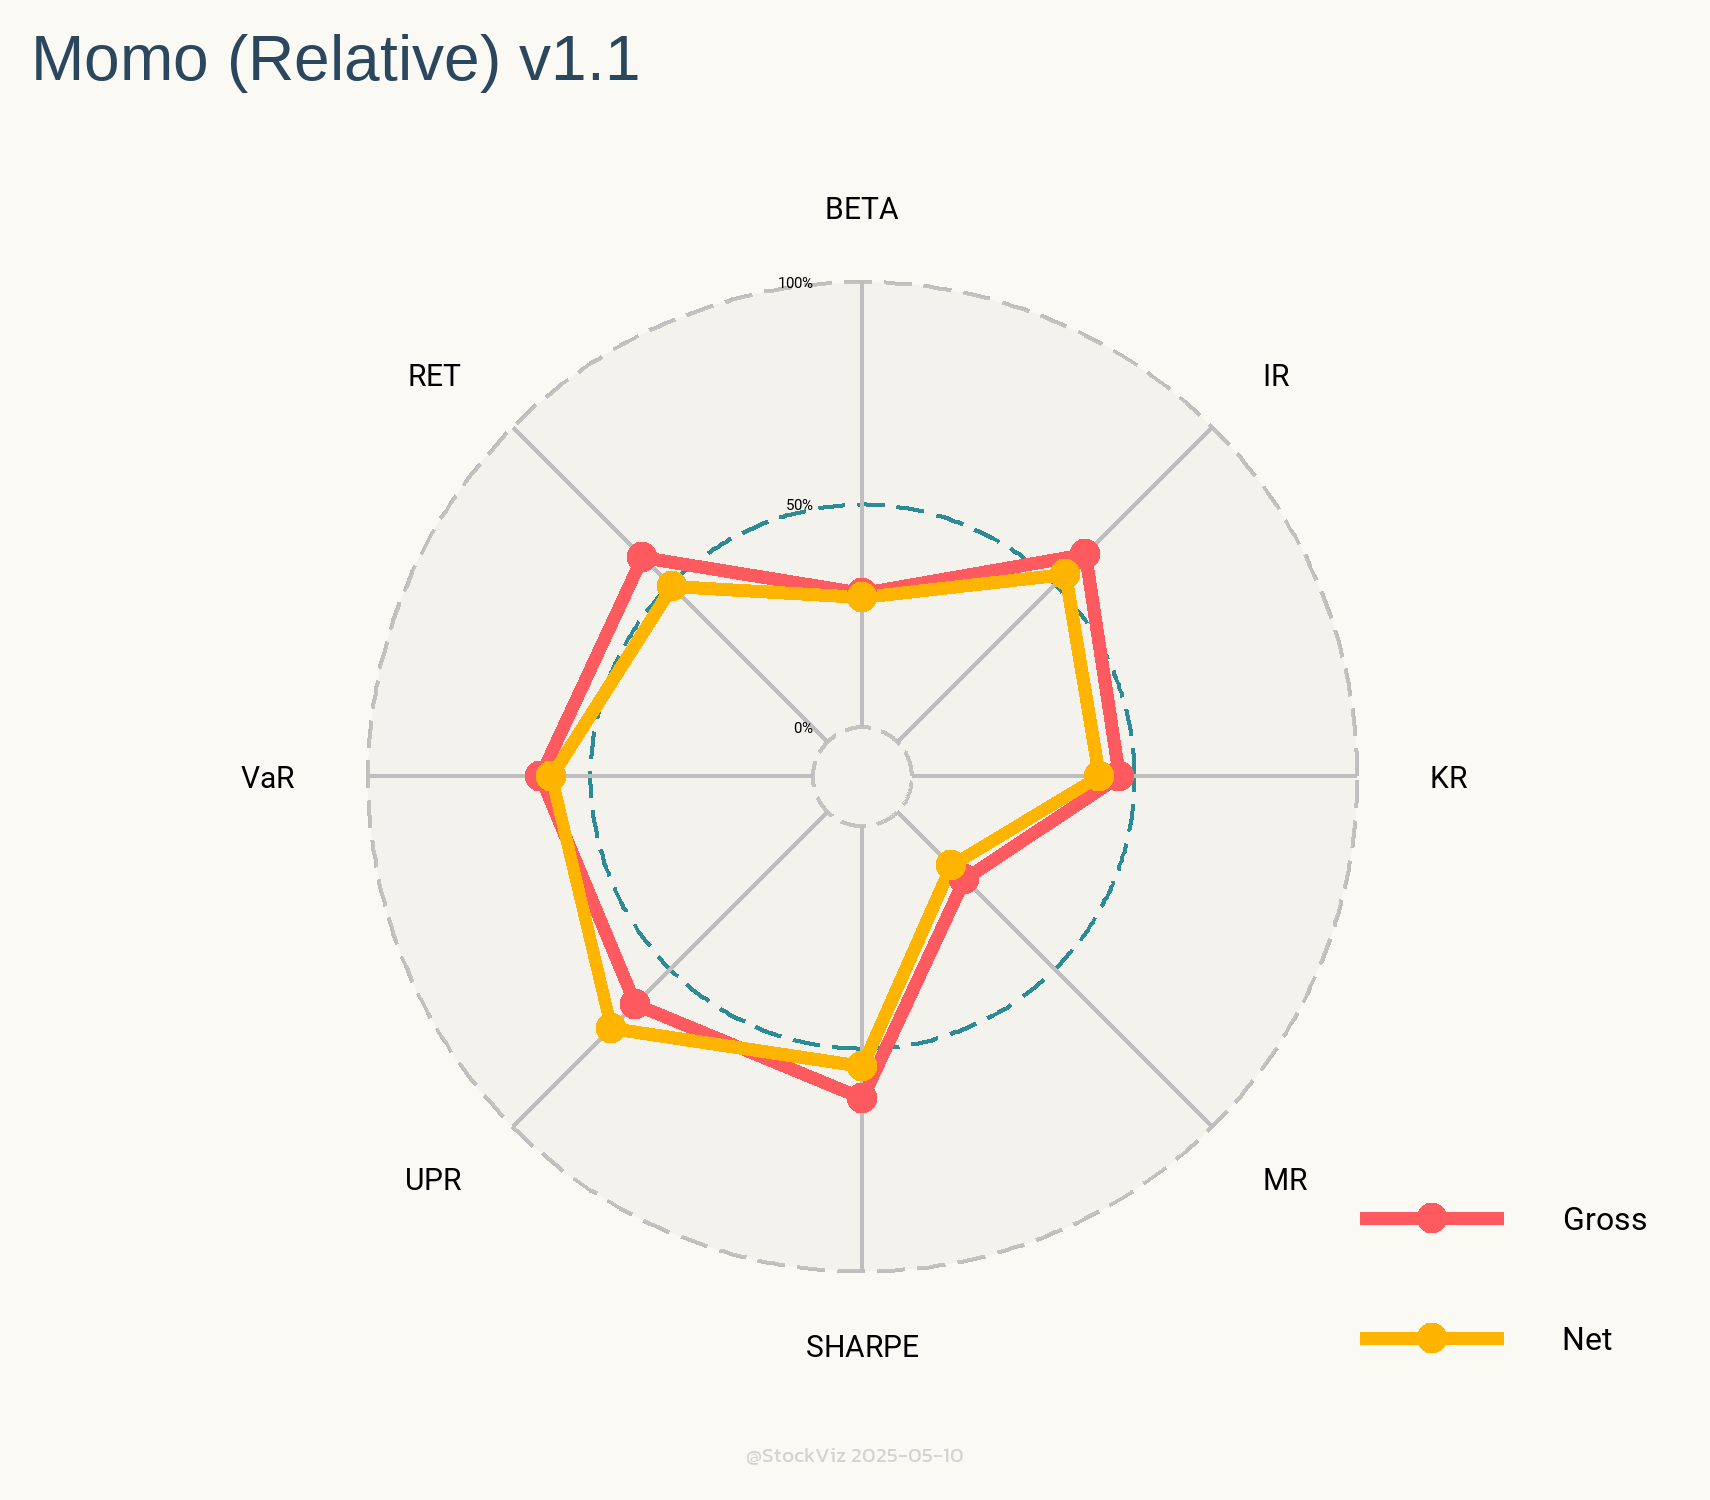
If you add net performance metrics into the mix, you’ll end up with a combinatorial explosion. How do you pick the “best” one of them to invest in?
Enter Radar Charts.
These charts show you the relative rank of each of these models against all the other 50+ models we have going. Intuitively, larger the area under the yellow (net) lines, better the model.
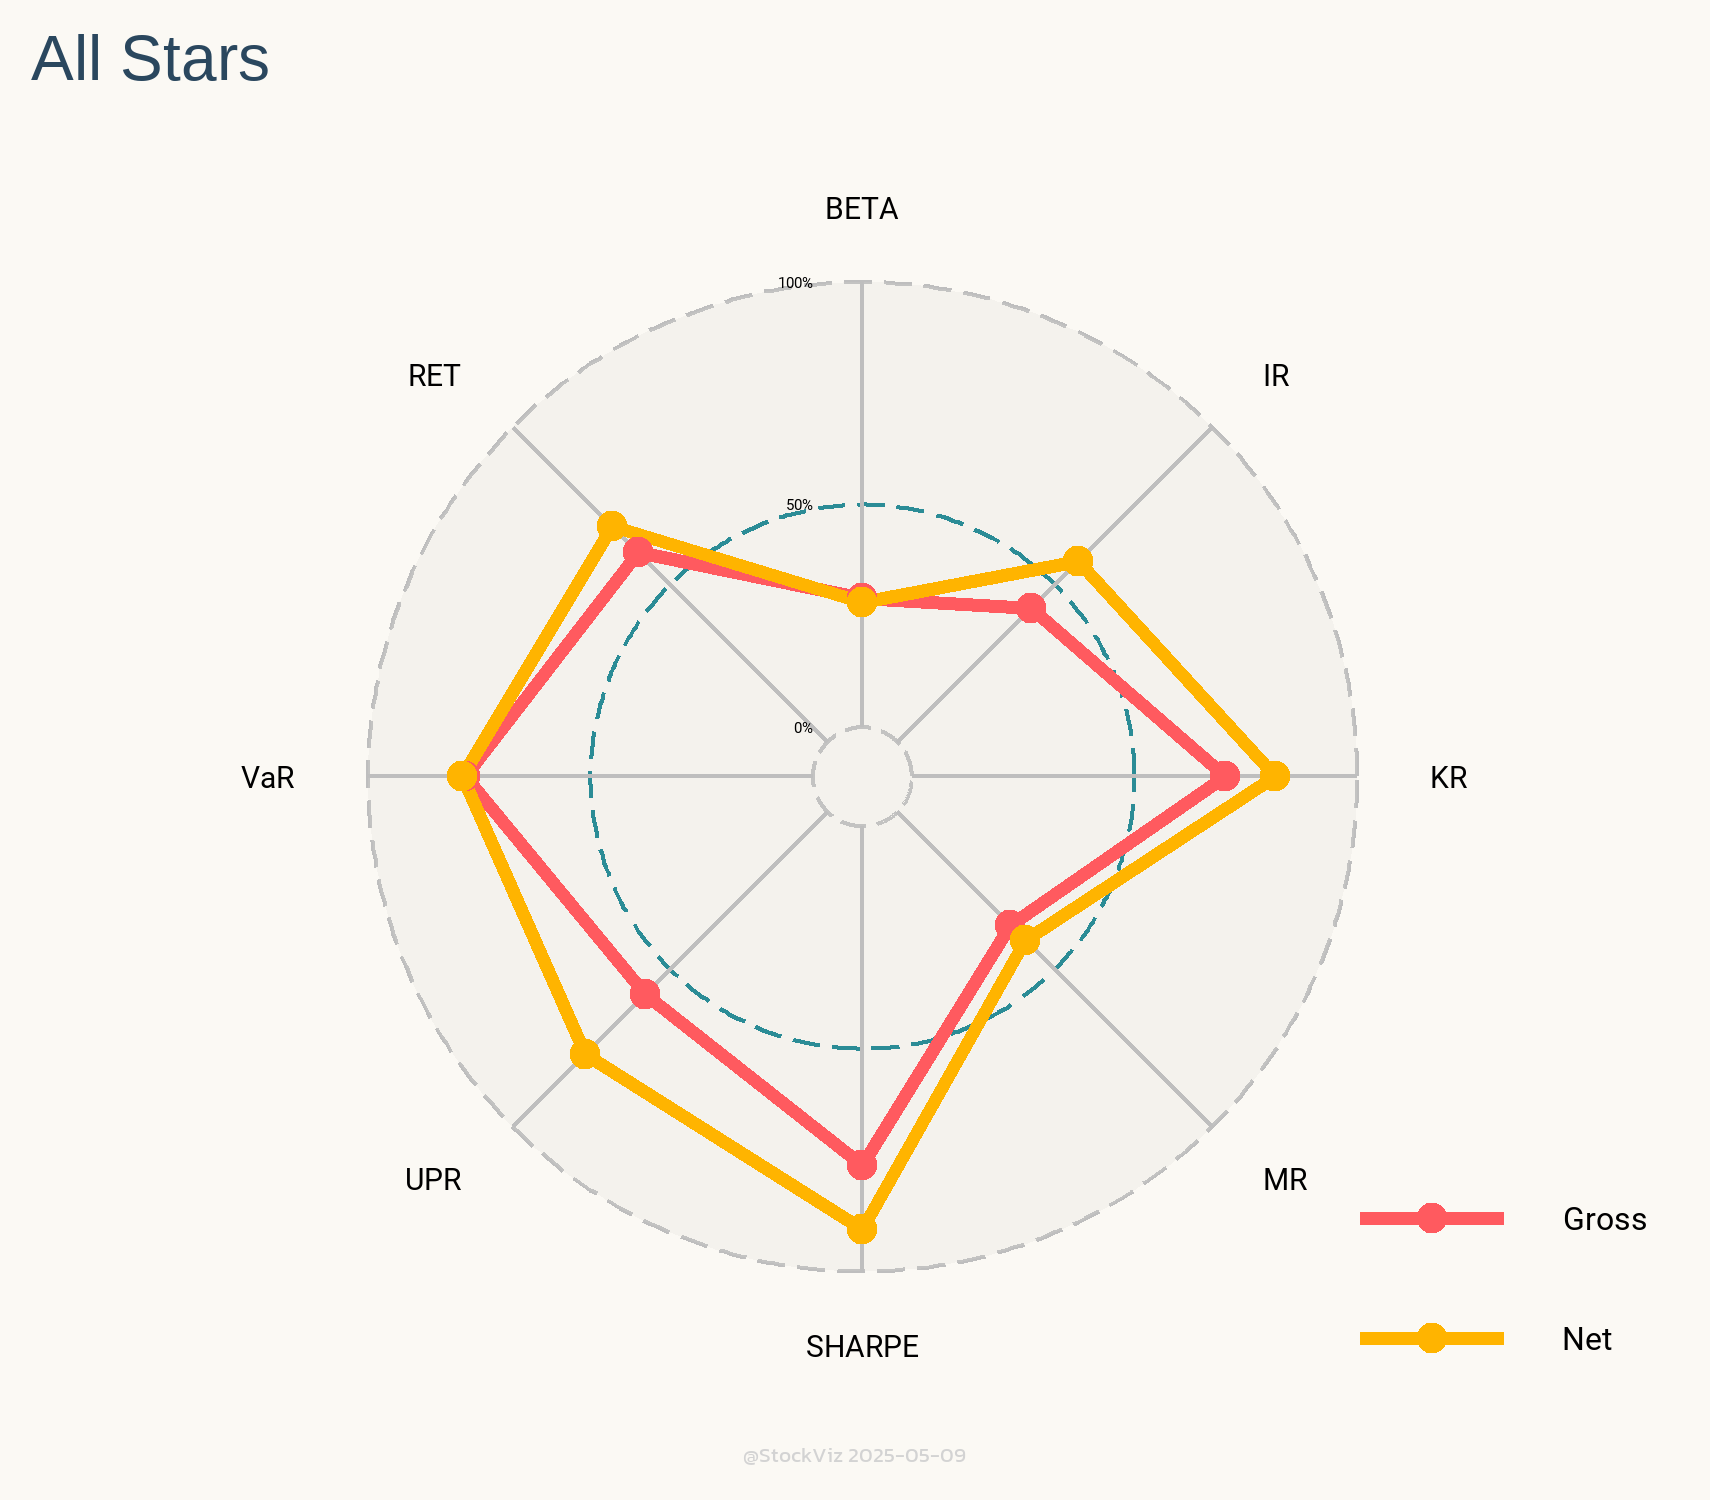
The only caveat with these Radars is that you should compare them against models of similar vintage. For example, we went live with our All Star momentum model in May 2020. Since then, the market regime has been extremely favorable to momentum strategies. It should come as no surprise that its Radar looks like the Queen’s Crown.
With that caveat out of the way, Radars are a great way to visualize how models square up against each other.
First time investors often get bedazzled by tall claims of “20%” returns in direct equities. All they need to do is subscribe to an “exclusive” telegram channel or advisory service and mint their way to millions. Even if these claims were true, gross returns – the number often marketed – has little to do with the net returns that the investor finally realizes at the end of the year.
Very few know that a high-churn portfolio that delivers 20% gross returns is equivalent to a mutual fund that delivers 14% net. So, who ate your cheese?
Layers of Transaction Taxes
Securities Transaction Tax (STT)
The STT is an automatic tax collected by the government on all transactions irrespective of whether you made money on it or not. On equities, it is currently set at 0.1% – if you bought & sold 1 stock worth Rs. 100, then the government collects 20p on it. This is one of the biggest drags on high-churn strategies.
Last year, the government collected ₹16,927 crore in STT.1
Exchange Transaction Charges
The trading venue, typically the NSE (National Stock Exchange) or the BSE (Bombay Stock Exchange,) levies a transaction charge for allowing you to trade through them. This varies by exchange and they are know to give rebates to high volume brokers to keep them loyal. The last time I checked, it was around 0.00345% on the NSE.2
Stamp Duty
When the Central Government is skimming off through STT, why should State Governments be far behind? The states too have their hands in the till through “stamp duty.”
Stamp duty is a state levy paid to register a document, typically an agreement or transaction paper between two or more parties, with the registrar. In an era where all transactions are electronic and registering transactions is just flipping some bits in a database, this is basically free money to the states.
Before 2020, every state had its own rate but thankfully, the Modi Government rationalized it to a common rate of 0.015% on the buy-side of equities.3
SEBI Turnover fees
If you though that SEBI was an arm of the government and should be entirely funded by the general budget, the joke is on you. If you have a look at your contract note that the brokers sends you on the days that you trade, you’ll find a “SEBI Turnover Fee.” This is 0.00015% on both buys & sells. While its one of the smaller taxes/fees on transactions, it is still a percentage of total volume, so it adds up over time.4
During 2019-20, the total amount of fees and other charges collected by SEBI was Rs. 608.26 crore.5
Short-term and Long-term Capital Gains Tax
The rationale behind STT, introduced in 2014, was to replace the long-term capital gains tax. It was said that there was a lot of “leakage” in collecting LTCG and that a tax on transactions collected directly by the exchanges would plug it. However, the 2018 budget saw the re-imposition of LTCG.6
However, if your strategy demands churn, then you need to be worried more about STCG (15% on profits) than on LTCG (10% on profits.)
A High Bar of Direct-Equity
After all these taxes, levies and charges, when the numbers are tallied up at the end of the year, most direct-equity investors would be better off with a mutual fund.
The napkin math (sheet) above doesn’t consider brokerage – since those are mostly zero – and DMAT charges – those charged by CDSL – since those are flat fees charged only on sales.
Direct-equity investing strategies need to walk a fine line between optimizing for lower transaction costs, risk management and taxes. This is where we find advisory disclosures lacking. Most advisors do not disclose portfolio churn rates and nor do they indicate what the net, after-tax, returns would look like.
Also, a mutual fund’s NAV includes all of these charges and your portfolio compounds tax-free until you redeem. So, if you have a 5+ year time horizon, then compounding the 15% STCG adds significant tailwinds to your portfolio.
Conclusion
While comparing different strategies, investors should also consider portfolio churn and try and back into what the net, after-tax, returns would look like at the end of the year. Know that mutual fund NAVs are net of transaction costs and can compound tax-free.
Direct-equity strategies should clear a high-bar.
Looking for a sensible way to invest? Here’s how to get started.
There are quite a few reasons why Indians would want to invest overseas. Education, retirement and emigration are frequently cited as top priorities. In the past, the only way to do this was through the Liberalised Remittance Scheme (LRS) route. However, with Indian mutual funds finally waking up to increasing demand from investors, does investing in international public market securities through this process still make sense?
Liberalised Remittance Scheme
The Indian Government, through its various regulatory and enforcement arms, have traditionally tried to keep Indians from sending money abroad. The problem has always been that populist policies used to win elections end up choking growth and stoking inflation. This leads to investors pulling funds away from India – aka, capital flight. One way to stem the tide is to try and trap Indian capital within India.
We use the word “try” because we are all aware about the hawala network that thrives to this day because of these policies. Thankfully, the process of liberalization has slowly, in baby steps, opened the doors for Indians to legally remit funds abroad.
The Reserve Bank of India (RBI) sets the rules governing these fund transfers that banks need to follow. And banks are supposed to report and track these transactions both at the individual and aggregate levels. Given the paperwork involved, most banks require you to make a trip to a “designated” branch office and execute the instruction in-person. The whole process is cumbersome, requires paperwork and takes an hour or two to complete.
Not only is LRS is painful, it is also expensive.
Most people fixate on bank fees and GST but that’s only part of the story. The biggest scam is the exchange rate given by the bank – it is the worst possible rate that they can give you while still being compliant with rules & regulations. If you compare the “google” rate with the final transfer rate, you’ll find that the drag is about 3%
So, why do it?
More Choice, Less Cost
The US ETF market went through a decade-long price war that drove vanilla cap-weighted fees to almost zero.
For example, if you want to invest in the S&P 500 index, then Vanguard’s VOO ETF charges you 3bps for the privilege whereas Motilal’s index fund charges 50bps. If you consider the tax differential and the transfer knee-cap, you break-even by year 7. So, if you are a passive, buy & hold investor with a long enough time horizon, LRS makes more sense.
While costs are important, so are choices. You can access strategies beyond what Indian mutual funds deign to offer in the local market. For example, there are a ton of factor strategies available through ETFs that are probably never going to be launched in India.
Indian policy makers love to ape Western European policies without giving a second thought to its appropriateness given our stage of growth. One such self-goal has been the STT – Securities Transaction Tax – that taxes transactions rather than profits. And yes, we tax both short-term and long-term capital gains. Sort of like a dare: We’ll see how you’ll make money trading.
Fortunately, the US has avoided shooting itself in the foot so far.
Lets say, you fall in the 30% income tax slab. You have a trading strategy that makes 20% returns in both markets. The strategy turnsover the portfolio “x” times. Given 0.01% STT in India and zero brokerage in the US, what is “x” for you to be indifferent in Year 1?
If you turn over your portfolio more than 60 times, you would be better off deploying that strategy in the US rather than India.
If you set the gross returns to zero, the required turnover drops to 30.
However, if you only trade infrequently, then LRS may not the best way to go. For example, a 40x turnover strategy will need 3 years to be indifferent.
Basically, if you are going to trade frequently, doing it in the US makes a lot more sense.
Caveats
LRS ensures that you will need a Chartered Accountant to do you taxes. You need to account for the dividends you have received, report your net personal assets, etc. So this route doesn’t make sense for small accounts.
If you don’t share your trading and banking passwords with your next-of-kin, then you need to be worried about US Estate laws. The U.S. has jurisdiction over U.S.-situated assets and requires executors for nonresidents to file an estate tax return if the fair market value at death of the decedent’s U.S.-situated assets exceeds $60,000. Directly investing in U.S.-situs assets as a non-U.S. investor creates potential U.S. estate tax liabilities.1
Conclusion
We feel that the LRS route is attractive both for a buy & hold investor as well as an active investor with an edge. However, one should get into it knowing the trade-offs involved.
If you are looking for simple, pre-canned investment strategies to invest in the US, check out freefloat.us
For the longest time in the US, actively managed mutual funds ruled the roost. Then came Jack Bogle with his index fund and the ceaseless mantra of “costs and taxes matter” and the dynamic shifted, slowly at first and then suddenly, in favor of indexing. It was only a matter of time before people figured out the tax loophole of ETFs and now, there are over 2500 ETFs listed in the US.
Unlike in India, where mutual funds are “pass through,” US mutual fund investors pay capital gains tax on assets sold by their funds. When there are large-scale redemptions, say, during a market melt-down, funds are forced to sell their holdings. This generates capital gains taxes, meaning that investors have to pay tax on assets that had fallen sharply in value1.
ETFs, on the other hand, don’t have to subject their investors to such harsh tax treatment. ETF providers offer shares “in kind,” with authorized participants serving as a buffer between investors and the providers’ trading-triggered tax events.
A Plethora
Of the ETFs that survive today, the number of launches every year has trended higher.
While Equity ETFs dominate launches, the share of fixed income, alternatives, etc. has increased as well.
Most of the AUM resides in “vanilla” strategies – typically market-cap based.
The winner HAS taken all
Plot the assets of each ETF, in billions, in log-scale and you can tell that this is a game of scale.
Of the total 2577 ETFs, 2022 (78.5%) have less than a billion dollars in assets. You need to filter for $10 billion and up to just see the x-axis.
The top 3 issuers: Blackrock, Vanguard and SSGA manage ~80% of all ETF assets.
Where there is an ETF, there’s an Index
Until last year, ETFs were supposed to be a “passive” entity. There were no “actively managed” ETFs. In order to be passive, an ETF needed to follow an index. And indices had to be rules based – however convoluted the rules. And issuers needed a third-party to provide the index.
The rise of ETFs (and passive investing, in general) put index providers in the middle of all the a action. They became a crucial cog in world finance that can make or break entire economies. So powerful, in fact, that China blackmailed MSCI to include its domestic stocks in its Emerging Markets Index, which is tracked by close to $2 trillion in assets2. And India has been working on inclusion of Indian sovereign bonds in global bond indices3.
We can see industry consolidation here as well. The top 5 index providers control ~75% of ETF AUM (more if you include index funds.) S&P Global and MSCI are as close to “pure-play” index providers as you can get and their stock market performance is off-the-charts.
Fee Squeeze and Innovation
The problem with index ETFs/funds is that buyers only care about two things: expense ratio and tracking error. This resulted in a massive fee war that saw the vanilla-passive industry consolidate around Blackrock and Vanguard. For example, Vanguard’s S&P 500 ETF’s expense ratio is 3bps.
So, what next?
International ETFs
The first wave was ETFs providing international diversification. However, the “home-bias” is pretty strong with AUM under international ETFs barely making a quarter of the total.
On a weighted average basis, these ETFs charge about 30bps. However, since these are mostly cap-weighted, the fee-war is just as intense here.
Leveraged/Inverse ETFs
Many investors have mandates that prevent them from trading derivates outright. This is especially true for Indian investors taking the LRS route to invest in the US. However, Wall Street has your back.
Leveraged ETFs give you 2x or 3x the daily returns of a benchmark index like the S&P 500 or the Nasdaq 100. Feeling bearish? Inverse ETFs do the opposite.
Caveat: These are NOT buy-and-hold investments and are more suitable for day-traders. The discussion requires a separate post.
On a weighted average basis, these ETFs charge about 100bps. While lucrative, they are mostly niche.
Active ETFs
An ETF’s tax-free wrapper make it an order of magnitude more attractive than an identical mutual fund. New issuers/managers have taken advantage of this and launched actively managed ETFs.
On a weighted average basis, active ETFs charge about 50bps. These are still early days for this category – they barely make 5% of total ETF assets. Liquidity and tracking errors during market crisis are yet to be tested.
Conclusion
There is a plethora of choices when it comes to ETFs in the US. If you plan to wander away from the plain-vanilla stuff, please take the time to read the prospectus and understand how it works.
If you are looking for simple, pre-canned investment strategies to invest in the US, check out freefloat.us
Gary Antonacci created the Global Equities Momentum (GEM) model that applied dual momentum to stock and bond indices. It toggles between stocks and bonds using 12-month trailing returns. And when it toggles to “stocks,” it chooses between US equities and International (ex-US) equities based on whichever posted higher returns in the previous 12-months. The model uses the S&P 500 index as a stand-in for US equities and the WORLD ex USA index for international stocks.
Investors can use the ETFs SPY/VOO for the S&P 500, SCHF for World ex-US DMs and AGG for bonds while replicating this strategy.
The best part about this strategy is its simplicity. It takes just 3 inputs and anybody can set it up on Google Sheets. Execution is as simple as it gets because at any given point in time, it is long just one ETF. Also, given that it uses a 12-month look-back, it is less prone to whiplashes, resulting in a lower trading frequency.
Specifications & Expressions
When you automate systematic strategies, you need to nail down its exact specifications. In this case, they are mainly: inputs, look-back periods and traded instruments.
The original version of the Strategy uses the S&P 500 and World ex-US both for inputs and as proxies for the traded instruments. However, there is no reason why they both should be the same. Also, what is so magical about a 12-month look-back period anyway? Why can’t it be 6 -months, a month or an average of the last 6-months?
The Strategy only describes a broad idea with one set of Specifications and Expressions out of a multitude. It can (and should) be adapted to fit one’s risk profile and investment horizon.
The Momentum Expression
The easiest tweak to the original strategy is to swap out the traded equity instruments with their momentum counterparts.
At the final step, when it comes to executing the trade, you can use MTUM, the US Momentum ETF instead of SPY/VOO and IMTM, the DM ex-US Momentum ETF instead of SCHF.
Long-only momentum ETFs are highly correlated to their market-cap counterparts but have the potential to juice returns in bull-markets. Since we are trend-following anyway, why not go a step further up the risk-curve and embrace momentum as well?
Picking a look-back for trend-following strategies is fraught with data-mining bias. One could potentially test 100s of periods and pick one that gave the best results historically. The data-mined look-back could even work in forward tests but inexplicably, and suddenly, fail in real portfolios.
The safest thing to do would be to not change the look-back periods outlined in the original research. However, the world would’ve changed since its first publication. How do you strike a balance between the two?
Long look-backs are slow at reacting to rapidly changing markets. Some might say that this is a bug while some might argue that this is a feature. Shorter look-backs, on the the other hand, can react faster but are prone to head-fakes and whiplashes.
The second version of our GEM strategy tries walk the fine line by taking the average of 6- through 12-month returns. It tries to hew close to the original research while acknowledging that the world has gotten faster since it was first published.
No Free Lunch
While the strategy adapts to the broad, slow-moving macro theme of US equity under-performance vis-à-vis rest-of-the-world (were it to occur,) it is not immune to getting whiplashed due to short and steep market dislocations like the COVID crash of March 2020. The strategy got into bonds just when the equity markets were recovering and stayed there until well-after. It is simply not possible to avoid all landmines when it comes to investing.
While we ran our back-tests, we tried a fair amount of permutations and combinations. Some where discarded in spite of having better risk-adjusted returns because they lacked internal consistency. While some slipped into data-mining territory in spite of our best efforts to avoid it. Readers interested in the process and the code can read through our GEM Collection.