“The service sector continues to face head winds, with weakening new business dragging down activity. On a positive note, inflation pressures are easing and optimism about the coming year is rising.”
Author: shyam
I recently bumped into an obituary of long-term thinking by Morgan Housel at Fool.com:
Long-Term Thinking lived an illustrious life since the start of the Industrial Revolution, when for the first time, people could think about more than their next meal. But poor incentives and the rise of 24/7 media chipped away at his health. The final blow came Monday, when a trader on CNBC warned that a 10% market pullback — which has occurred on average every 11 months over the last century — could be “devastating” for investors. “That’s it,” Long-Term Thinking whispered from his hospital bed. “There’s no more room for me here.” He died soon after Bloomberg published its daily tally of how much the net worths of the world’s billionaires changed in the previous 24 hours.
But what is long-term-thinking/investing anyway? Should you just buy a bunch of stocks, toss them into the attic and forget about them? I think there is a fair amount of confusion between what “long-term investing” entails and “buy-and-hold-forever” type of investing and investors get into all sorts of trouble because of that.
The Indian Nifty index is fairly new, data goes back only till 1995. So I am going to try and draw parallels from the American experience. When Charles Dow first published his famous index back in May 1896, it had the following industrial stocks:
American Cotton Oil
Laclede Gas
American Tobacco
North American
Chicago Gas
Tennessee Coal & Iron
Distilling and Cattle Feeding
U.S. Leather
General Electric
U.S. Rubber
The only company that’s still around is General Electric.
Do you know what happened to the rest? The US economy shifted from being “commodities/agriculture heavy” to “services heavy.” So if you had stuck to your investments in any of the other large-caps from that time, you would have had zero to show for it today.
Long-term thinking means coming up with an investment strategy that takes a holistic view of innovation, industry/sector trends and economic maturity that has the same tenure as your investment horizon.
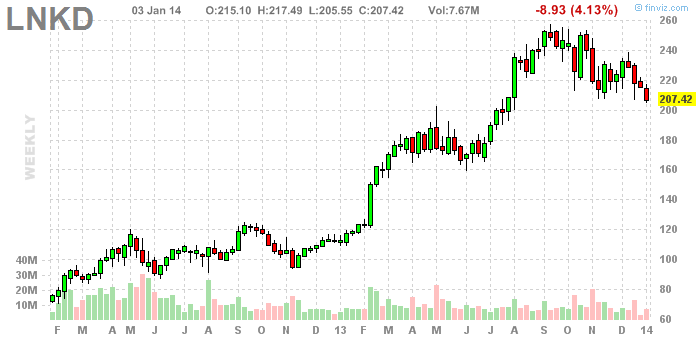
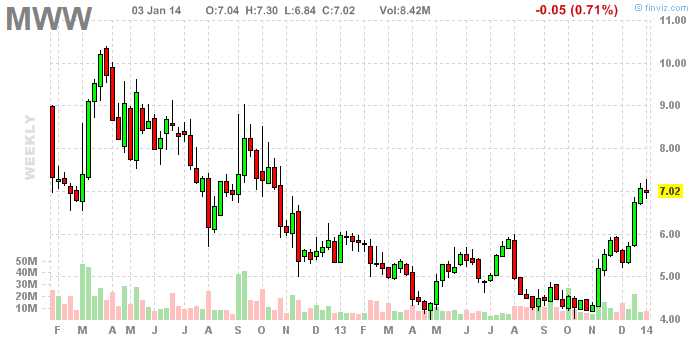
For example, if you want to hold corporate recruitment related stocks as part of your portfolio, then your process should have automatically picked up Linked-In and reduced holdings of Monster:
LinkedIn +84.46% in one year:

Monster World Wide +17.39% in one year:

LinkedIn disrupting Monster’s online recruitment business is not an isolated, random event. Monster similarly disrupted newspapers’ “help wanted” ads. Apple disrupted Nokia’s handset business, and so on. So going back to our example, your investment process not only should have automatically picked LinkedIn, but it should have also indicated how much of it you should own. Will your allocation be based on market-cap (LinkedIn: $23.63B, Monster: $739.87M)? Will they be equally weighted? Would it be based on balance-sheet strength? Quality-to-price?
Now extend this example to your entire portfolio. What sectors should you own? How much? What are the competitive dynamics within those sectors? These are some of the questions that a long-term investing strategy should address.
So how often should you churn?

If you think of your investment horizon as an arch, then your portfolio review “points” allow for piecewise linearity in your thought process.
Shortening the duration between the points allows you to be precise whereas lengthening them allows you to be accurate. How you make the trade-off between precision and accuracy will determine your portfolio re-balance frequency and hence your fees, depth of research, allocation strategy, etc.

I agree with Housel insofar as avoiding the second-by-second tracking that is in vogue. But investors should not equate long-term investing with “buy-and-hold-forever.” So, what is your plan?
George Soros outlines his world-view at project-syndicate.org:
On Japanese quantitative easing: taking the risk of faster growth and higher bond yields vs. slow death.
European Union: heading towards long-lasting stagnation where everybody hates Germany.
United States: Shale energy has given the US an important competitive advantage in manufacturing in general and in petrochemicals in particular. Quantitative easing has boosted asset values. And the housing market has improved, with construction lowering unemployment. The fiscal drag exerted by sequestration is also about to expire.
China: The growth model responsible for its rapid rise has run out of steam. There is an unresolved self-contradiction in China’s current policies: restarting the furnaces also reignites exponential debt growth, which cannot be sustained for much longer than a couple of years.
Read more: The World Economy’s Shifting Challenges
Related articles

The Nifty ended the week down -1.63% (-2.17% in USD terms).
Index Performance
Other than IT, almost all other indices got shellacked…
Top winners and losers
ETFs
| PSUBNKBEES | +1.83% |
| GOLDBEES | +0.80% |
| JUNIORBEES | -0.58% |
| NIFTYBEES | -1.70% |
| BANKBEES | -2.34% |
| INFRABEES | -5.69% |
Advancers and Decliners

Yield Curve
Look at the 50bps move on the short-end of the curve…
Investment Theme Performance
| Financial Strength Value | +1.21% |
| Balance-sheet Strength | +1.15% |
| Quality to Price | +0.56% |
| Consistent10* | +0.40% |
| Velocity* | +0.39% |
| Magic Formula Investing | +0.00% |
| Momentum 200 | -0.24% |
| Efficient Growth | -0.43% |
| Enterprise Yield | -0.81% |
| Growth with Moat | -1.01% |
| Long Term Equity* | -1.31% |
| Market Fliers | -1.38% |
| ADAG Mania | -1.40% |
| Market Elephants | -1.51% |
*Contributed Themes
Sector Performance
Thought for the weekend
Charlie Munger on the Efficient Market Hypothesis:
Efficient market theory is a wonderful economic doctrine that had a long vogue in spite of the experience of Berkshire Hathaway. In fact one of the economists who won — he shared a Nobel Prize — and as he looked at Berkshire Hathaway year after year, which people would throw in his face as saying maybe the market isn’t quite as efficient as you think, he said, “Well, it’s a two-sigma event.” And then he said we were a three-sigma event. And then he said we were a four-sigma event. And he finally got up to six sigmas — better to add a sigma than change a theory, just because the evidence comes in differently. [Laughter] And, of course, when this share of a Nobel Prize went into money management himself, he sank like a stone.
Source: That time Buffett smashed the Efficient Market Hypothesis
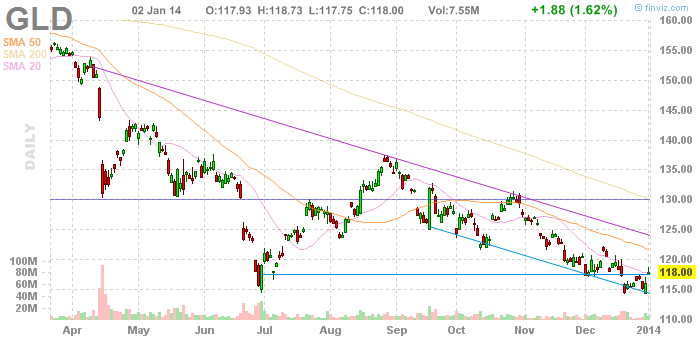
This time, last year, almost all believed the metal would rise through the year. Analysts issued an average price forecast of $1,753 per troy ounce. Instead, gold averaged $1,411, suffering its first down year in 13 and worst year since 1981. By New Year’s eve the price was $1,202.
Gold ETF (USD):

Gold ETF (INR):
Investment demand for physical gold fell 25% last year. ETFs that keep gold in vaults on behalf of investors have dumped nearly 30m ounces from a high of 84.6m ounces at the end of 2012.
Currie, Goldman Sachs’s head of commodities research, had a target of $1,050 an ounce back in early October. The biggest gold bulls have abandoned ship. Paulson told clients at his firm’s annual meeting Nov. 20 that he personally wouldn’t invest more money in his gold fund. Billionaires George Soros and Daniel Loeb sold their entire positions in the SPDR Gold Trust exchange-traded fund in the second quarter.
Given so much hatred about gold, should the contrarian investor jump in? No. The odds of runaway inflation is low, equity market returns are likely to be more attractive compared to gold’s in the near term and investors are still in the process of pulling money out of gold funds. There will come a time to challenge the bearish thesis on gold, but investors going long right now could end up being too early.
[stockquote]GOLDBEES[/stockquote]
Source:
Gold bulls lose faith in bullion’s allure
Goldman’s Currie Says Gold Is ‘Slam Dunk’ Sell
Paulson Said to Inform Clients He Won’t Add More to Gold
Related articles


