Author: shyam

ETFs vs. Indices

ETFs (Exchange Traded Funds) offer investors a convenient way to gain exposure to a particular index. Since these funds are not actively managed, they are measured by their how cheap they are (in terms of asset management fees) and their tracking error. Before we begin, some key terms:

Kurtosis

Kurtosis is a measure of “peakedness” of a distribution. For a normal distribution, Kurtosis is 3. Positive excess Kurtosis indicates fat tails while negative indicates peakedness.

Skew

Skewness is a measure of asymmetry of a distribution. Positive skew indicates a long right tail while a negative skew indicates a long left tail.

How effective have Indian ETFs been? Lets pull up some histograms and see for ourselves.

NIFTYBEES vs. CNX Nifty

NIFTYBEES-returns-histogram

CNX NIFTY-returns-histogram

The Nifty ETF actually shows a -ve skew and a lower kurtosis compared to the index. This is how tracking error and fees manifests itself in daily returns. However, their impact on cumulative returns is minimal. The story for less liquid and higher-fee ETFs are different.

PSUBNKBEES vs. CNX PSU BANK

PSUBNKBEES-returns-histogram

CNX PSU BANK-returns-histogram

Notice the big difference in kurtosis and skewness? This is tracking error personified. The story for the Juniors’ are not that different.

JUNIORBEES vs. CNX NIFTY JUNIOR

JUNIORBEES-returns-histogram

CNX NIFTY JUNIOR-returns-histogram

Given that there really isn’t much of a push either from investors or from asset management firms on ETFs, the dynamics are unlikely to change in the short term.

Alibaba: The Riddle Wrapped in an Enigma

We are setup for an epic fight between Amazon and Alibaba in the US. Something that will be keenly watched by the Bansals, now that they want to be Alibaba instead of Amazon (LiveMint). But what exactly is Alibaba? How did they become a multi-billion dollar company with a finger in every pie?

Alibaba is a lot of different things for different people

alibaba-comparison

If you think it looks like a land-grab, you are right. They basically asked: What would a newly online Chinese consumer want? And connected the dots.

Alibaba is huge

The Wall Street Journal says that Alibaba’s Taobao and Tmall sites reached $240 billion in combined transaction volume last year. By way of contrast, EBay posted $76.5 billion last year in so-called “gross merchandise volume” excluding vehicles.

Alibaba now handles roughly 80% of all online shopping in China. Alipay is not only a payments processor (the world’s largest, at that) but also runs a money-market fund with more than $65 billion in assets.

What are investors buying?

Its hard to say. Alibaba stock will buy investors a stake in a Cayman Islands-registered entity which is under contract to receive the profit from Alibaba’s lucrative Chinese assets but will not actually own them.

The reason is that China permits privately controlled firms in some industries to tap foreign markets by establishing offshore companies permitted to wholly own Chinese companies. Yet it prohibits foreign investments in certain restricted industries, including the Internet. These controlled industries must be owned by Chinese nationals; no foreign investment are allowed.

So, the work-around has been to establish ownership by Chinese nationals, while setting up an offshore company that can be publicly listed. Mimic an owner relationship by setting up contracts between the two parties so that the offshore public firm reaps the successes of the Chinese firm — without actually owning shares in it.

Basically, investors are buying into a story.

Can Flipkart + Myntra = Alibaba?

Hard to say. Social networking in India is basically owned by Facebook (+ WhatsApp). Uber is here, and so are half a dozen home-grown taxi “startups.” Online payments are heavily regulated by the RBI and payments startups are in round 2 of the hunger games. Amazon.in is a looming threat and selling other people’s brands is a lousy business model. Its probably too late to be the “Alibaba of India”… and its probably going to be tougher just hanging on to being the “Amazon of India.”

Besides, isn’t “______ of [something]” a red flag for most venture capital firms? But it seems like its a story that investors are willing to hang their hat on for now.

Sources:

Weekly Recap: Towers of Abstraction and Sedition

Equities

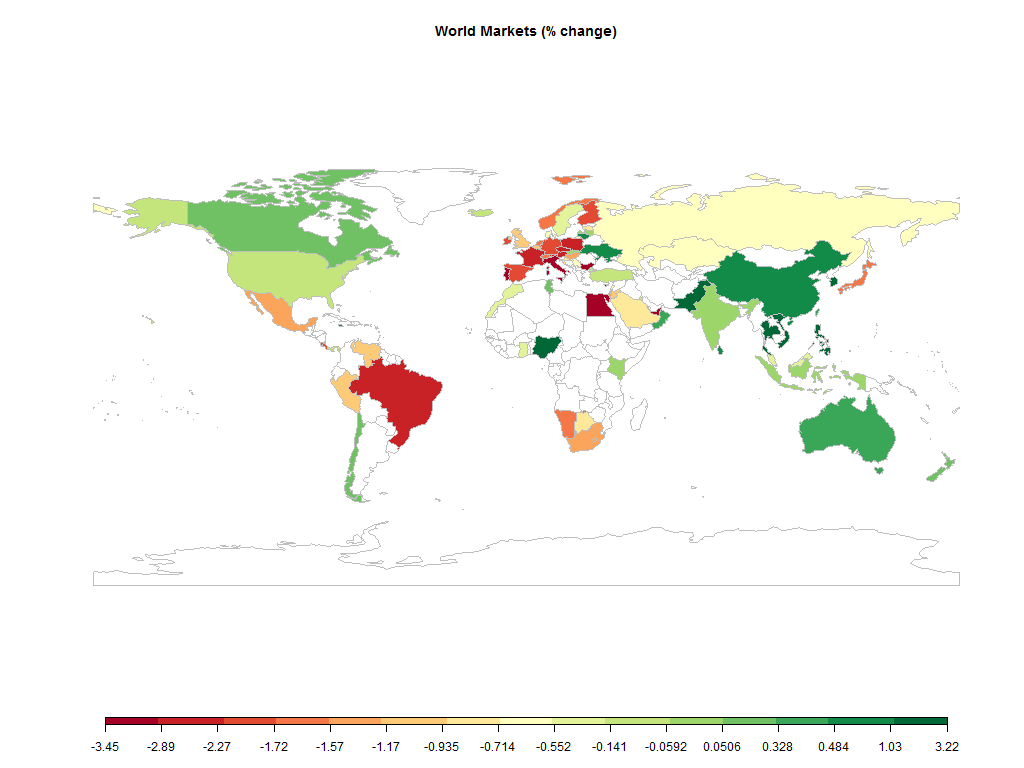
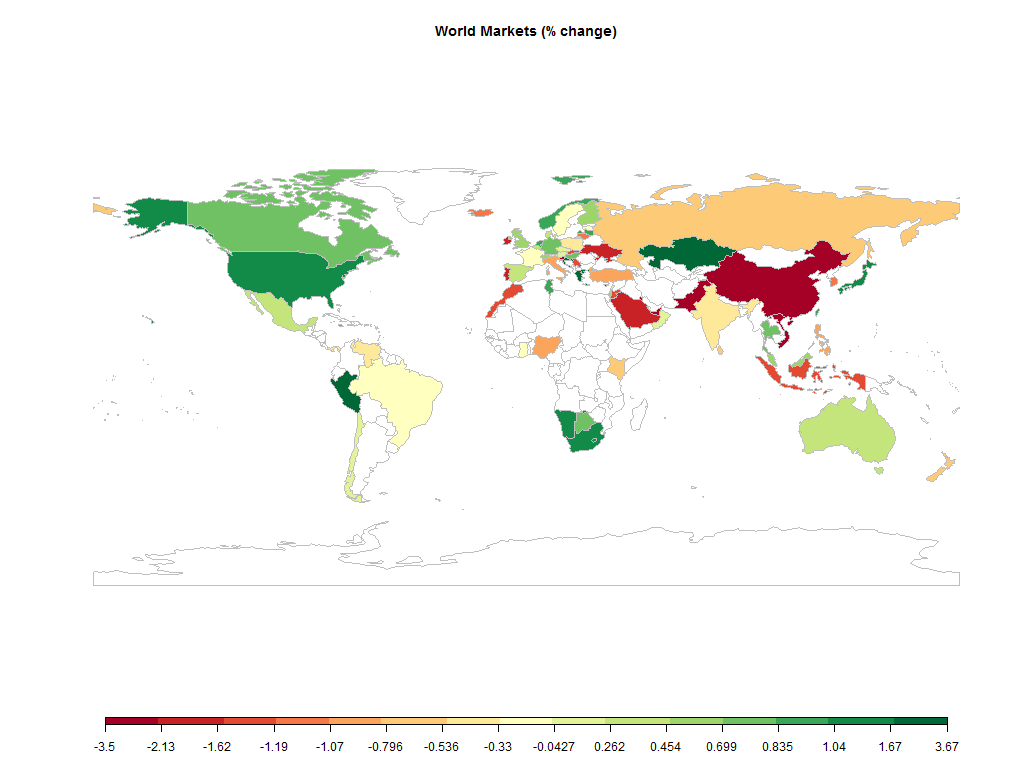
world equities 2014-05-16.2014-05-23

The Nifty continued its crazy ride on Modi’s rocket ship, +2.28% (+2.84% in USD terms.)

Major
DAX(DEU) +1.44%
CAC(FRA) +0.83%
UKX(GBR) -0.58%
NKY(JPN) +2.59%
SPX(USA) +1.71%
MINTs
JCI(IDN) -1.16%
INMEX(MEX) +0.72%
NGSEINDX(NGA) +2.08%
XU030(TUR) +4.39%
BRICS
IBOV(BRA) -2.26%
SHCOMP(CHN) +0.40%
NIFTY(IND) +2.28%
INDEXCF(RUS) +3.35%
TOP40(ZAF) +1.85%

Commodities

Energy
Brent Crude Oil +0.70%
Ethanol +3.79%
Heating Oil -0.01%
Natural Gas -0.72%
RBOB Gasoline +1.41%
WTI Crude Oil +2.35%
Metals
Copper +0.32%
Gold 100oz -0.01%
Palladium +1.78%
Platinum +0.64%
Silver 5000oz +0.52%

Currencies

USDEUR:+0.52% USDJPY:+0.49%

MINTs
USDIDR(IDN) +1.77%
USDMXN(MEX) -0.35%
USDNGN(NGA) -0.07%
USDTRY(TUR) -0.78%
BRICS
USDBRL(BRA) +0.53%
USDCNY(CHN) +0.04%
USDINR(IND) -0.47%
USDRUB(RUS) -1.72%
USDZAR(ZAF) -0.57%
Agricultural
Cattle -1.07%
Cocoa +4.27%
Coffee (Arabica) -1.01%
Coffee (Robusta) -3.57%
Corn -1.65%
Cotton -3.72%
Feeder Cattle +2.97%
Lean Hogs -1.91%
Lumber -2.91%
Orange Juice +2.06%
Soybean Meal +4.79%
Soybeans +3.26%
Sugar #11 -2.35%
Wheat -3.22%
White Sugar -3.66%

Nifty Heatmap

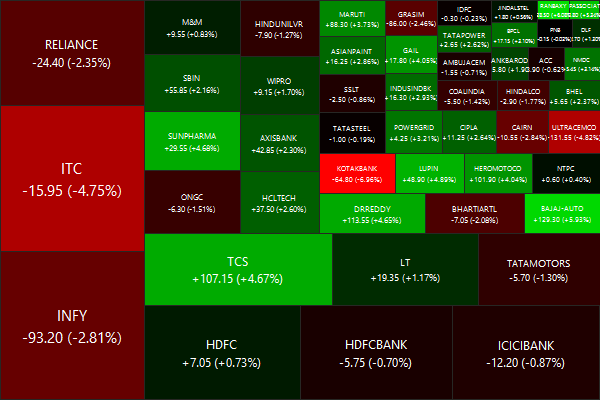
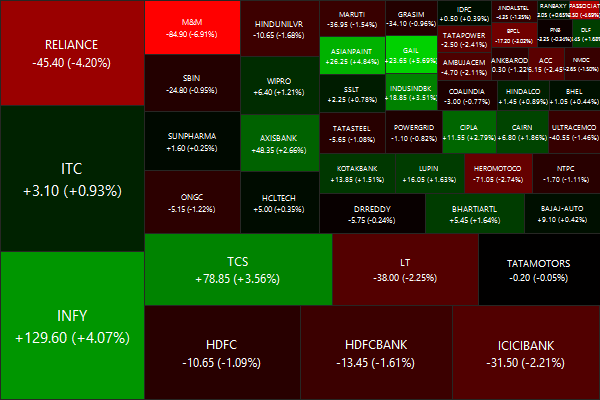
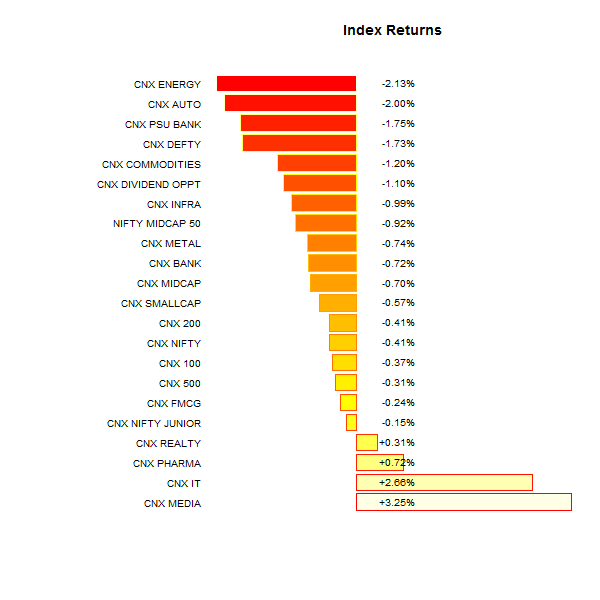
CNX NIFTY.2014-05-16.2014-05-23

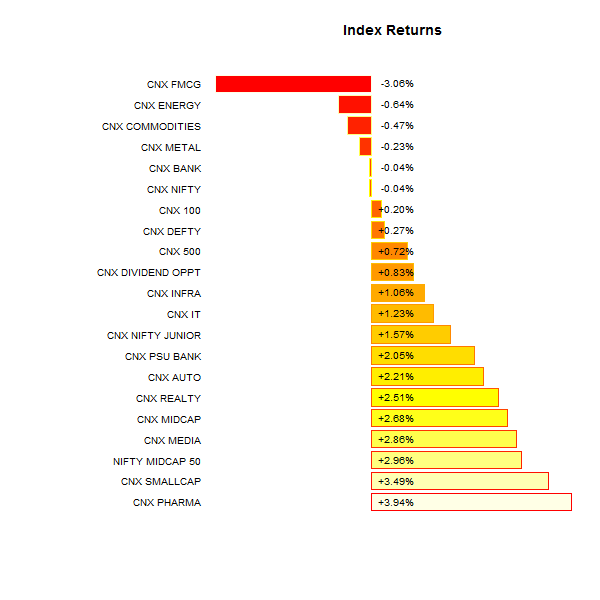
Index Returns

index performance 2014-05-16.2014-05-23

Top winners and losers

UNIONBANK +25.01%
DLF +27.96%
CANBK +29.61%
AMBUJACEM -4.97%
SUNPHARMA -4.76%
GODREJCP -4.45%
DLF: dinged before elections for fear of Modi victory, panic buying after elections on Modi victory. Did somebody say class-action lawsuit?

ETFs

PSUBNKBEES +14.93%
JUNIORBEES +9.12%
INFRABEES +8.34%
BANKBEES +3.30%
NIFTYBEES +2.35%
GOLDBEES -5.57%
Gold? What gold? Get me some PSU banks!

Investment Theme Performance

The Modi wave continued to lift all boats…

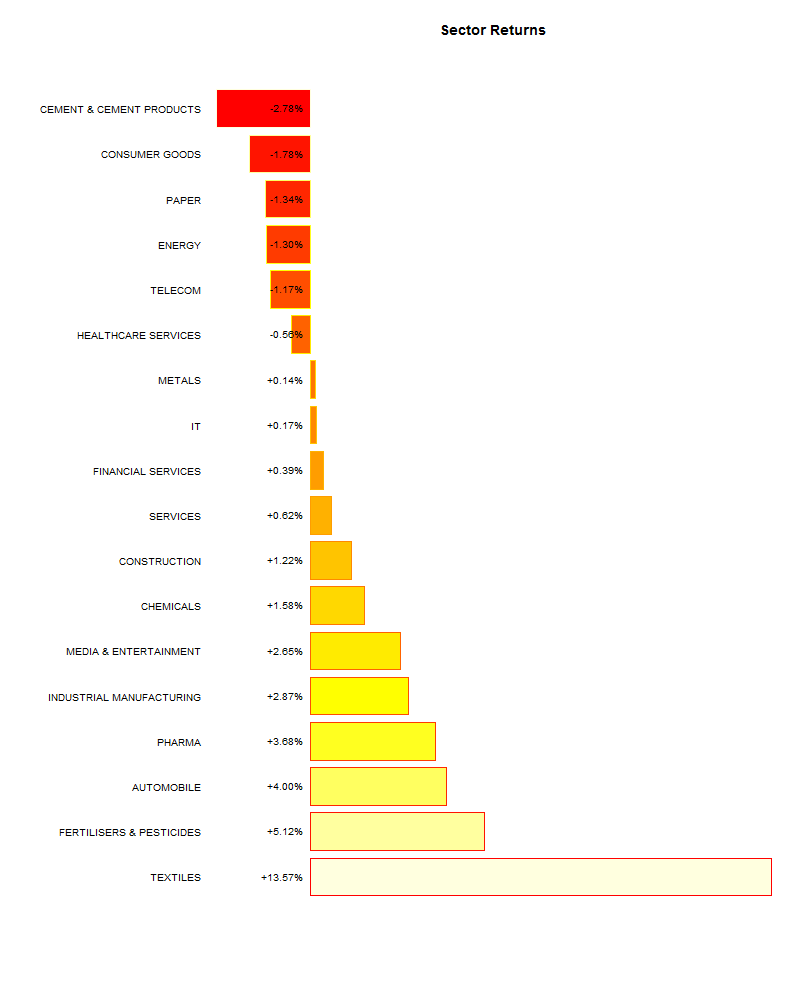
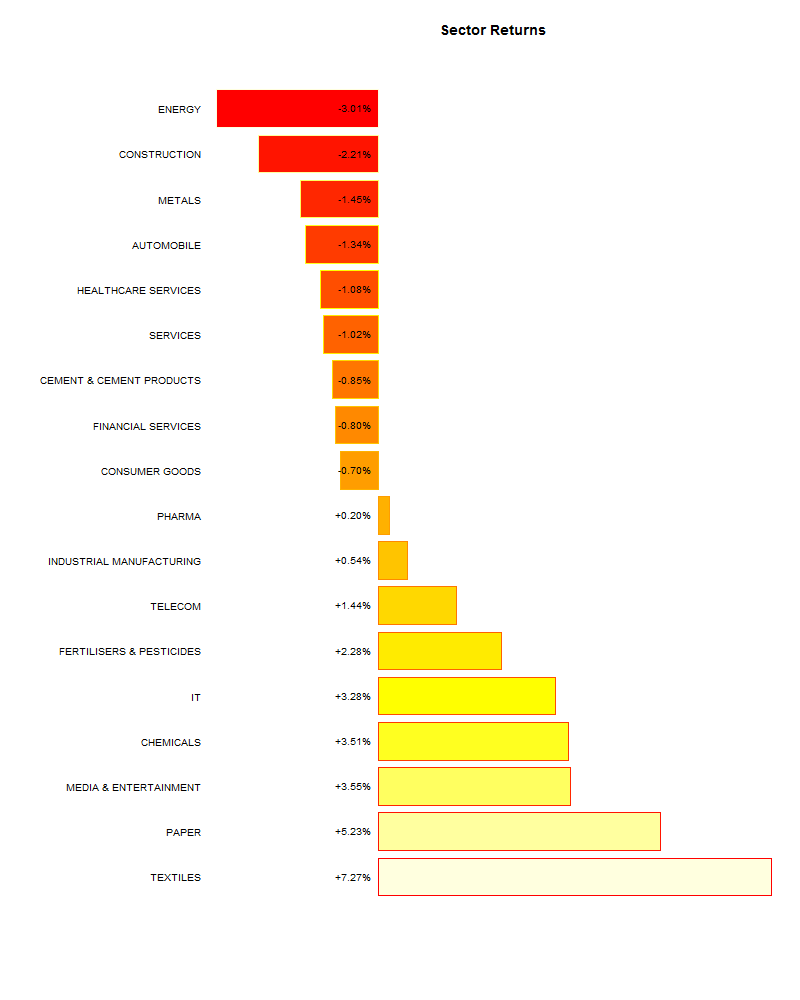
Sector Performance

sector performance 2014-05-16.2014-05-23

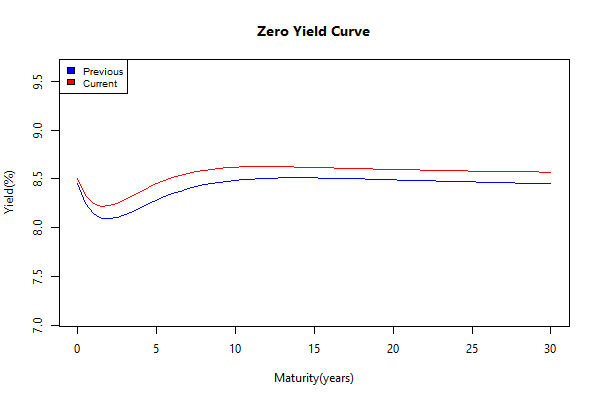
Yield Curve

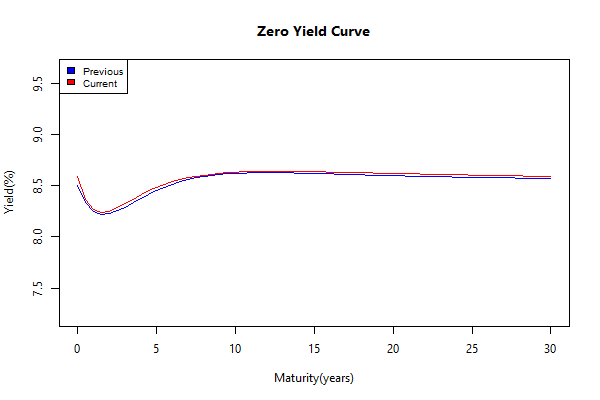
All quiet on the western front.

yield Curve 2014-05-16.2014-05-23

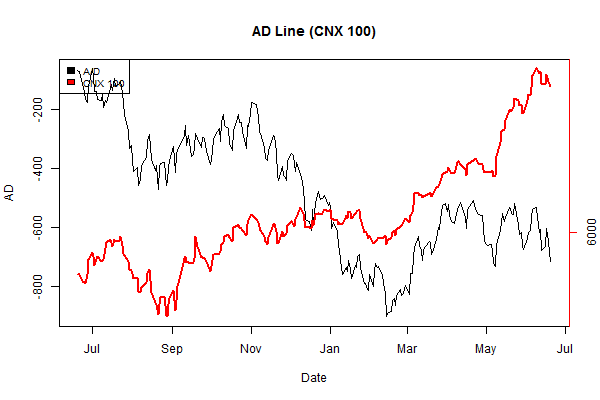
Advance Decline

advance.decline.line2.2014-05-16.2014-05-23

Thought for the weekend

Geeks have deep isolationist tendencies. They build an early affinity with machines and programs. They sense that programming is the ultimate in world-building, and what’s more, it’s executable! They build elaborate towers of abstraction. They are drunk on the clean rationality of the world that the machine and they have built and understand.
 
The world of humans is messy, unpredictable, and — this is the part that infuriates you the most, the part you simply don’t get, the part that will forever make you an outsider — unreasonable. Humans are unreasonable.

Source: Why technologists want to secede

Smart Beta Strategy Return Analysis

The best part about StockViz Investment Themes is that you can setup a portfolio of stocks that follows a particular strategy. It is a convenient way for you to:

  1. stick to a strategy
  2. follow a preset rebalancing schedule
  3. think in terms of your portfolio strategy rather than individual stocks
  4. avoid common behavioral pitfalls
  5. systematically track your P&L and strategy performance

In StockViz, there are two smart-beta themes: Market Fliers tracks a high-volatility and high-beta portfolio while Market Elephants tracks a low-beta portfolio. Between the two strategies and the Nifty, what should an investor prefer?

Daily Returns

In a bull-market, such as the one we are in, it makes sense to be in a high-beta portfolio. Notice how narrow the low-beta histogram is compared to high-beta, indicating little variation in day-to-day returns. However, you cannot escape the gigantic 10%+ outlier in the Market Fliers.

Nifty

nifty-returns-histogram

High Beta (Market Fliers)

high-beta-returns-histogram

Low Beta (Market Elephants)

low-beta-returns-histogram

Drawdowns

Any investment will have drawdowns: it is the peak-to-trough decline during a specific period. Market fliers had a horrible couple of months in December-Jan where it saw a jaw-dropping 20% draw-down that took 29 days to recover from.

Nifty

From Trough To Depth Length To Trough Recovery
2013-Dec-10 2014-Feb-04 2014-Mar-06 -0.057 61 40 21
2013-Nov-05 2013-Nov-13 2013-Dec-09 -0.0519 24 7 17
2014-Apr-25 2014-May-07 2014-May-09 -0.0275 10 8 2
2014-Apr-11 2014-Apr-16 2014-Apr-21 -0.0178 5 3 2
2014-Apr-03 2014-Apr-04 2014-Apr-09 -0.0086 4 2 2

High Beta (Market Fliers)

From Trough To Depth Length To Trough Recovery
2013-Dec-09 2014-Feb-12 2014-Mar-27 -0.1955 75 46 29
2013-Nov-05 2013-Nov-12 2013-Dec-08 -0.1083 22 5 17
2014-Apr-10 2014-Apr-15 2014-May-11 -0.0751 18 3 15
2014-Apr-02 2014-Apr-02 2014-Apr-08 -0.0215 4 1 3
2014-Mar-31 2014-Mar-31 2014-Apr-01 -0.0092 2 1 1

Low Beta (Market Elephants)

From Trough To Depth Length To Trough Recovery
2014-Jan-15 2014-Feb-12 2014-Feb-27 -0.0427 31 21 10
2013-Nov-04 2013-Nov-25 2013-Dec-02 -0.0338 19 14 5
2014-Apr-24 2014-May-06 2014-May-21 -0.0309 19 8 11
2013-Dec-03 2013-Dec-12 2013-Dec-15 -0.024 8 7 1
2013-Dec-29 2014-Jan-06 2014-Jan-13 -0.0219 12 7 5

Performance

The wealth chart for market filers is basically a parabola at this point. During the period, the Nifty clocked in +19.26%, Market Fliers +72.42% and Market Elephants +21.16%

Nifty

nifty-returns

High Beta (Market Fliers)

high-beta-returns

Low Beta (Market Elephants)

low-beta-returns

Performance vs. Drawdown

How do you tell if these Themes are better than the Nifty? One way to measure relative performance is through the Calmar ratio and the Sterling ratio.

The Calmar ratio is a comparison of the average annual compounded rate of return and the maximum drawdown risk. The lower the Calmar Ratio, the worse the investment performed on a risk-adjusted basis over the specified time period; the higher the Calmar Ratio, the better it performed.

The Sterling ratio = Compounded Annual Return ÷ (Avg. Max Drawdown – 10%)

Just like the Calmar ratio, a higher Sterling ratio is generally better because it means that the investment is receiving a higher return relative to risk.

Calmar Ratio Sterling Ratio
Nifty 6.487609 2.35644
Market Fliers 8.720311 5.768798
Market Elephants 9.828884 2.942523

As you can see, smart beta strategies beat the Nifty both in absolute returns and in risk.


Note: The analysis starts from 2013-Oct-28.


Weekly Recap: Language & Decision Making

Equities

world equity markets 2014-05-09.2014-05-16

The Nifty put in a MODIfied return of +5.02% (+7.15% in USD terms) this week…

Major
DAX(DEU) +0.50%
CAC(FRA) -0.47%
UKX(GBR) +0.61%
NKY(JPN) -0.73%
SPX(USA) +0.22%
MINTs
JCI(IDN) +2.72%
INMEX(MEX) +0.84%
NGSEINDX(NGA) +1.21%
XU030(TUR) -0.76%
BRICS
IBOV(BRA) +1.31%
SHCOMP(CHN) +0.76%
NIFTY(IND) +5.02%
INDEXCF(RUS) +1.52%
TOP40(ZAF) +0.77%

Commodities

Energy
Brent Crude Oil +1.86%
Ethanol +3.47%
Heating Oil +1.60%
Natural Gas -2.41%
RBOB Gasoline +2.85%
WTI Crude Oil +2.45%
Metals
Copper +1.94%
Gold 100oz +0.47%
Palladium +1.89%
Platinum +2.51%
Silver 5000oz +1.05%

Currencies

USDEUR:+0.45% USDJPY:-0.25%

MINTs
USDIDR(IDN) -1.03%
USDMXN(MEX) -0.50%
USDNGN(NGA) +0.71%
USDTRY(TUR) +1.06%
BRICS
USDBRL(BRA) -0.23%
USDCNY(CHN) +0.09%
USDINR(IND) -2.07%
USDRUB(RUS) -1.34%
USDZAR(ZAF) -0.16%
Agricultural
Cattle -0.35%
Cocoa +2.99%
Coffee (Arabica) -0.19%
Coffee (Robusta) -0.81%
Corn -4.16%
Cotton -2.24%
Feeder Cattle +1.52%
Lean Hogs +4.06%
Lumber -3.78%
Orange Juice -2.81%
Soybean Meal -3.32%
Soybeans -2.50%
Sugar #11 +4.08%
Wheat -5.79%
White Sugar +4.18%

Nifty Heatmap

CNX NIFTY.2014-05-09.2014-05-16

Index returns

index performance.2014-05-09.2014-05-16

Top winners and losers

UNIONBANK +25.82%
CANBK +26.36%
PFC +27.98%
DRREDDY -11.45%
GLENMARK -7.09%
MCDOWELL-N -4.72%
Banks in, Pharma out…

ETFs

PSUBNKBEES +9.50%
BANKBEES +7.53%
JUNIORBEES +6.61%
INFRABEES +4.97%
NIFTYBEES +4.48%
GOLDBEES -2.25%
We were definitely risk ON this week…

Investment Theme Performance

High beta trumped every other strategy…

Sector Performance

sector performance.2014-05-09.2014-05-16

Yield Curve

yield Curve.2014-05-09.2014-05-16

Thought for the weekend

You are on a footbridge watching a trolley speeding down a track that will kill five unsuspecting people. You can push a fat man over the bridge onto the tracks to save the five. (You cannot stop the trolley by jumping yourself, only the fat man is heavy enough.) Would you do it?

If you thought the language in which a dilemma is posed should make no difference to how it is answered, think again!

Source: Gained in translation