Introduction
Segmenting the market to track performance, risk etc. has been around for a long time. The Dow Jones Industrial Average was launched in 1896, the Sensex since 1986 and the Nifty since 1995. They provide a short-hand to gauge market performance and track returns over a period of time.
Index construction
An index can be constructed based on any combination of factors that are common to its constituents. They can be sectoral like FMCG, IT, etc. or they can be based on fundamental factors like book value, sales, etc. However, the most common way to construct an index remains free float market capitalization. This is the approach that most indices, like the Nifty, take.
The Nifty lists the following criteria for its constituents (NSE):
- Liquidity (Impact Cost)
- Float-Adjusted Market Capitalization
- Float
- Domicile
- Eligible Securities
- Other Variables
Deciles vs. Indices
Using existing indices come with some disadvantages:
- Rebalancing usually occurs once every 6 months – a lot can happen in that time.
- They usually have “other” considerations – not entirely quantitative.
- Do not cover the entire market – the biggest index in the NSE is CNX 500 that track 500 stocks.
An alternative is to build your own set of indices based on purely quantitative considerations. For example, you could divide the market into deciles based on their free float market cap and set a minimum daily turnover. This will then allow you to track micro-cap through mega-cap performance over arbitrary time frames, track how different stocks transition through deciles, set up “early warning” signals, etc.
Example
If you divide the market into deciles and set the minimum daily turnover to be 0.01% of float, then you end up with about 140 stocks in each. The 1st decile would be the micro-caps while the 10th would be the mega-caps. Here’s how the different deciles performed this week:
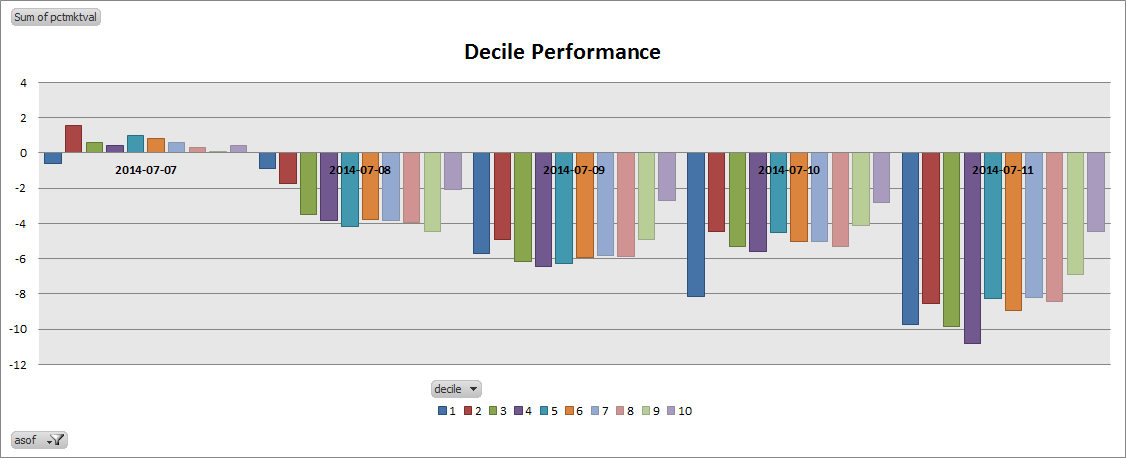
Watch out for decile performance charts in our weekly and monthly performance roundups!
