Author: shyam

Weekly Recap: 7 market myths

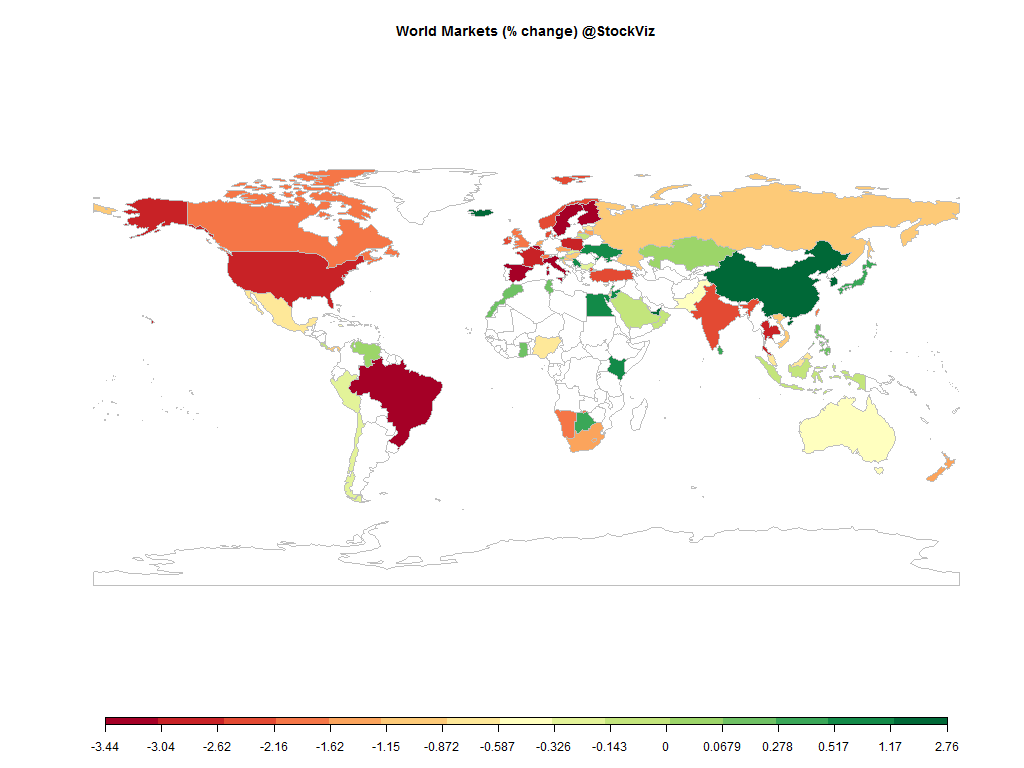
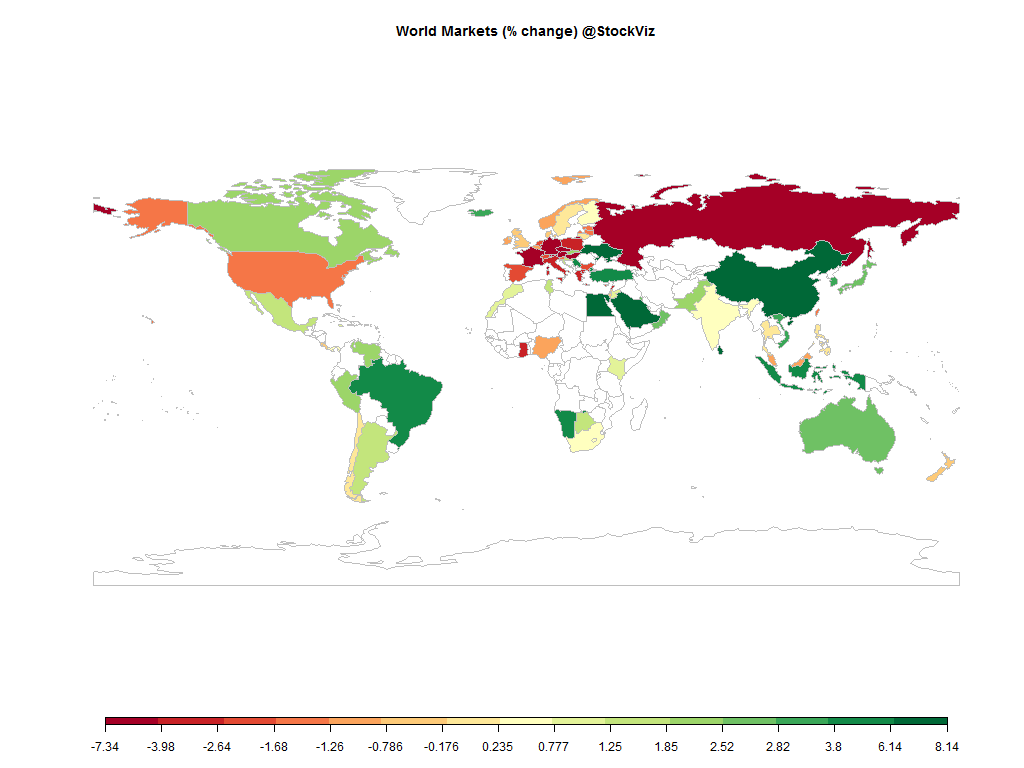
world equity markets 2014-07-04.2014-07-11

Nifty got royally shellacked, ending the week -3.77% (-4.39% in USD terms.)

Equities

Major
DAX(DEU) -3.42%
CAC(FRA) -3.41%
UKX(GBR) -2.56%
NKY(JPN) -1.77%
SPX(USA) -0.90%
MINTs
JCI(IDN) +2.58%
INMEX(MEX) -0.95%
NGSEINDX(NGA) -0.46%
XU030(TUR) +2.45%
BRICS
IBOV(BRA) +1.35%
SHCOMP(CHN) -0.60%
NIFTY(IND) -3.77%
INDEXCF(RUS) +0.76%
TOP40(ZAF) -2.14%

Commodities

Energy
Brent Crude Oil -3.54%
Ethanol -6.49%
Heating Oil -1.67%
Natural Gas -5.18%
RBOB Gasoline -3.31%
WTI Crude Oil -3.16%
Metals
Copper +0.00%
Gold 100oz +1.39%
Palladium +1.08%
Platinum +0.86%
Silver 5000oz +0.94%

Currencies

USDEUR:-0.11% USDJPY:-0.74%

MINTs
USDIDR(IDN) -2.40%
USDMXN(MEX) +0.15%
USDNGN(NGA) -0.23%
USDTRY(TUR) -0.74%
BRICS
USDBRL(BRA) +0.36%
USDCNY(CHN) -0.02%
USDINR(IND) +0.34%
USDRUB(RUS) -0.71%
USDZAR(ZAF) -0.53%
Agricultural
Cattle -3.85%
Cocoa +0.31%
Coffee (Arabica) -8.26%
Coffee (Robusta) -2.80%
Corn -4.61%
Cotton -10.09%
Feeder Cattle -3.31%
Lean Hogs +1.03%
Lumber +0.71%
Orange Juice +3.26%
Soybean Meal -5.90%
Soybeans -6.63%
Sugar #11 -4.38%
Wheat -8.72%
White Sugar -3.86%

Nifty Heatmap

CNX NIFTY.2014-07-04.2014-07-11

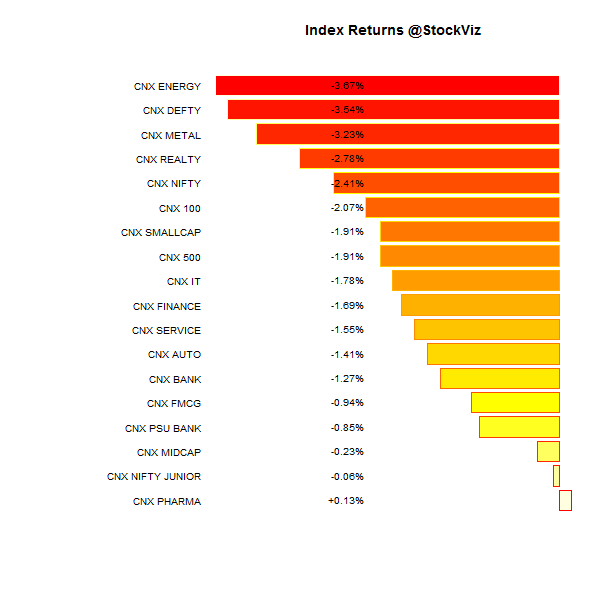
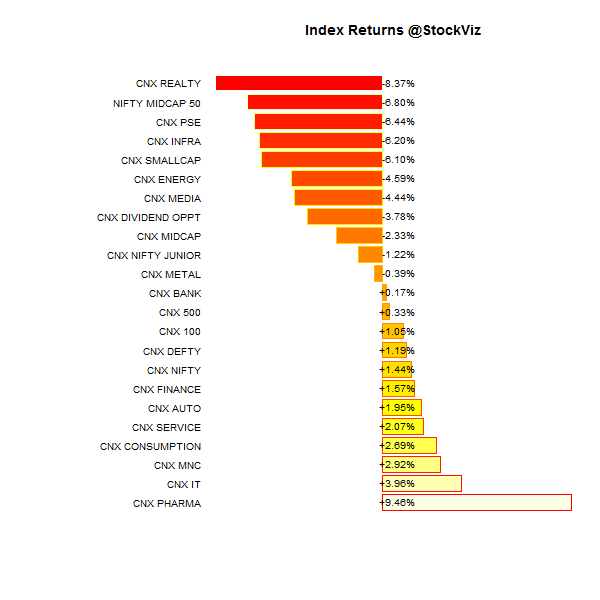
Index Returns

index performance.2014-07-04.2014-07-11

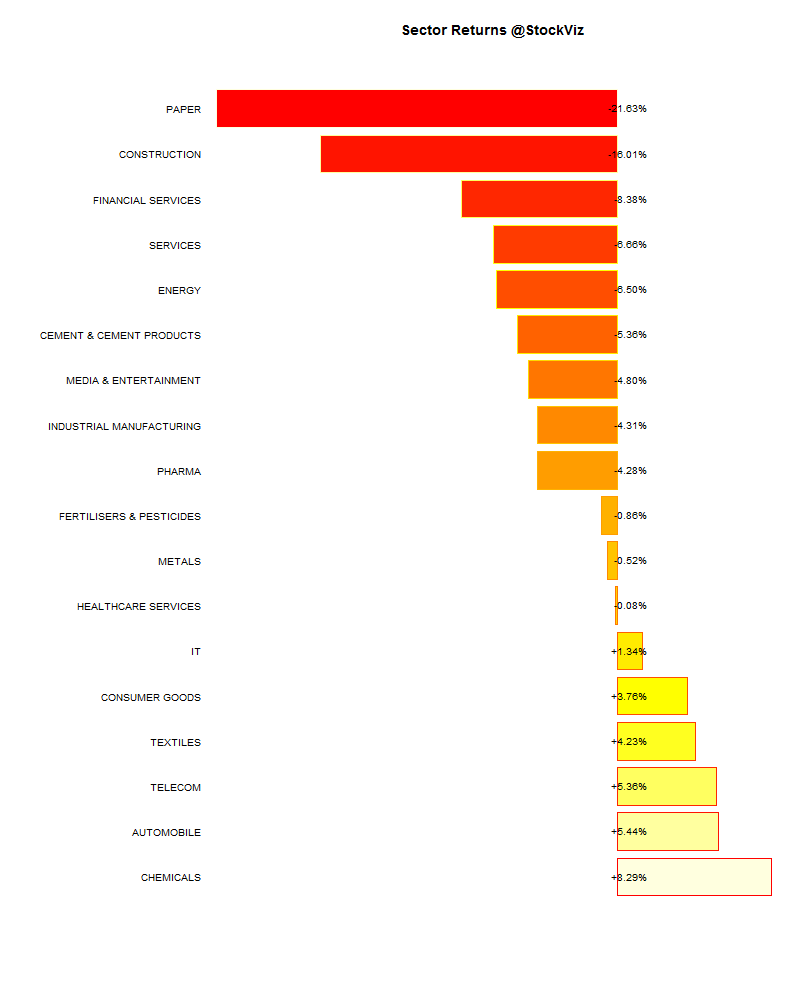
Sector Performance

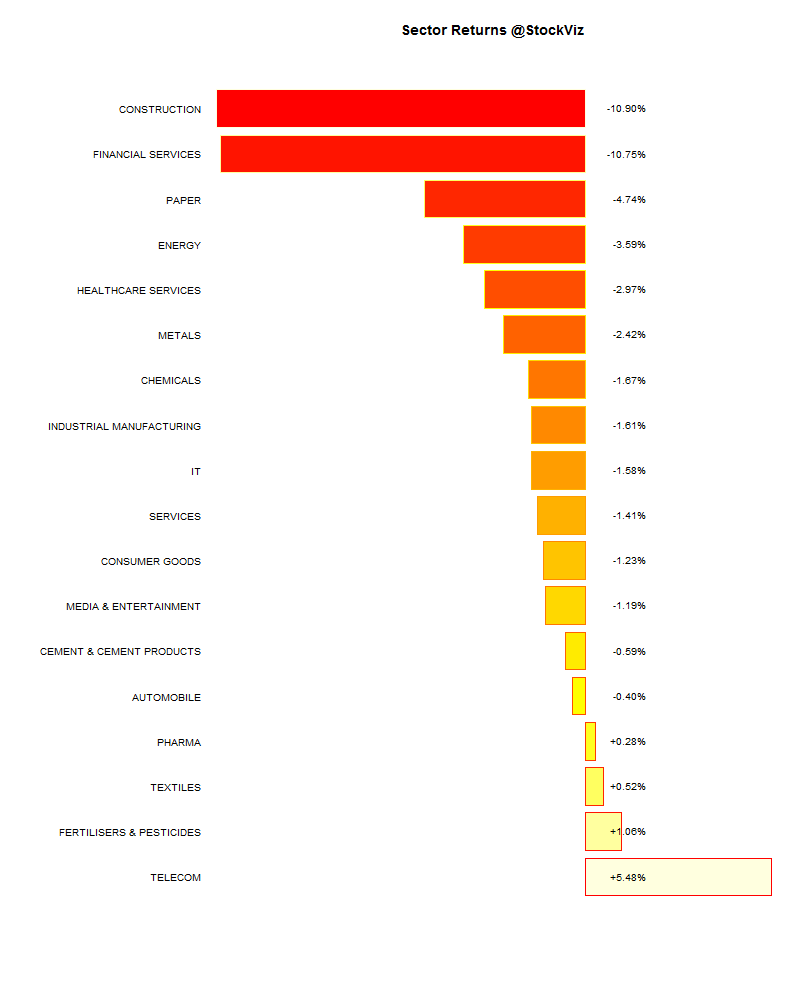
sector performance.2014-07-04.2014-07-11

Market Cap Decile Performance

Decile Mkt. Cap. Advance/Decline
1 (micro-cap) -9.49% 63/76
2 -8.52% 55/84
3 -9.83% 46/93
4 -10.80% 50/87
5 -8.25% 51/89
6 -8.42% 45/94
7 -8.22% 50/88
8 -8.41% 54/85
9 -6.88% 65/74
10 (mega-cap) -4.45% 62/77
Mid-caps, that saw an incredible Modi-hopium rally experienced deep corrections.

Top winners and losers

RANBAXY +4.27%
SUNPHARMA +4.83%
IDFC +10.90%
UNIONBANK -18.14%
CROMPGREAV -17.31%
ADANIENT -15.47%
Banks, industrials and Adanis felt the brunt of the Modi-hopium hangover.

Etfs

GOLDBEES +1.74%
NIFTYBEES -3.87%
BANKBEES -6.45%
INFRABEES -7.62%
JUNIORBEES -8.11%
PSUBNKBEES -9.87%
Looks like the market expected a lot more for PSU banks in the budget.

Investment Theme Performance

No winners, only different shades of red…

Yield Curve

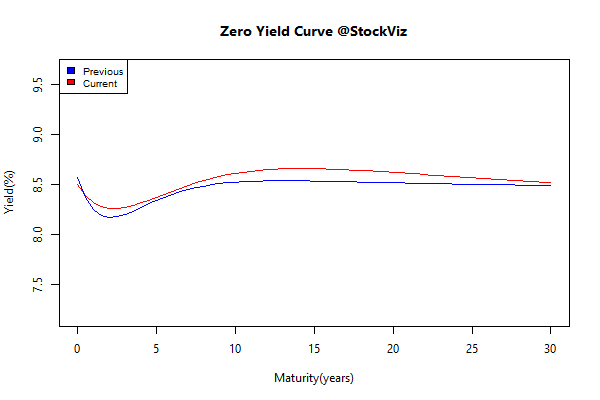
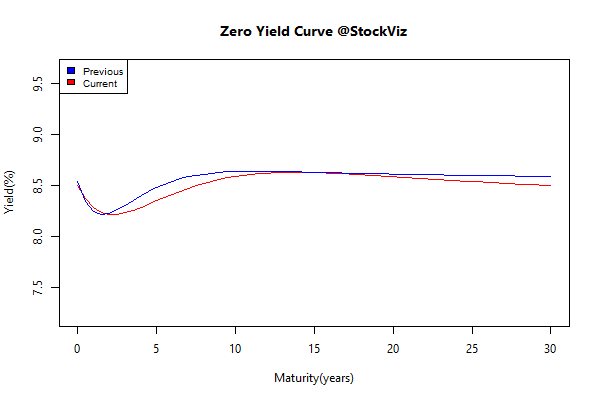
Typically, you would expect bonds to rally whenever equities fall, but not this time. Yields rose this week.

yield Curve.2014-07-04.2014-07-11

Advance Decline

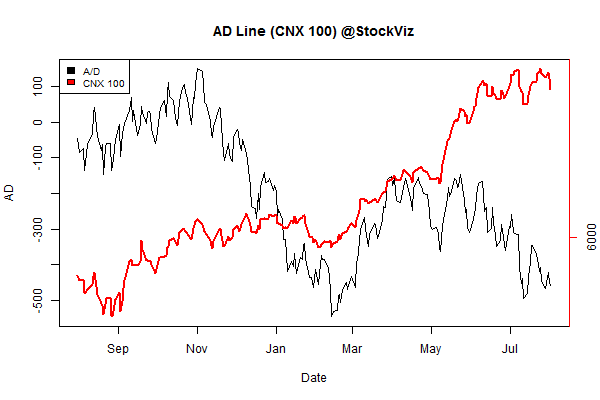
advance.decline.line2.2014-07-04.2014-07-11

Nifty OI

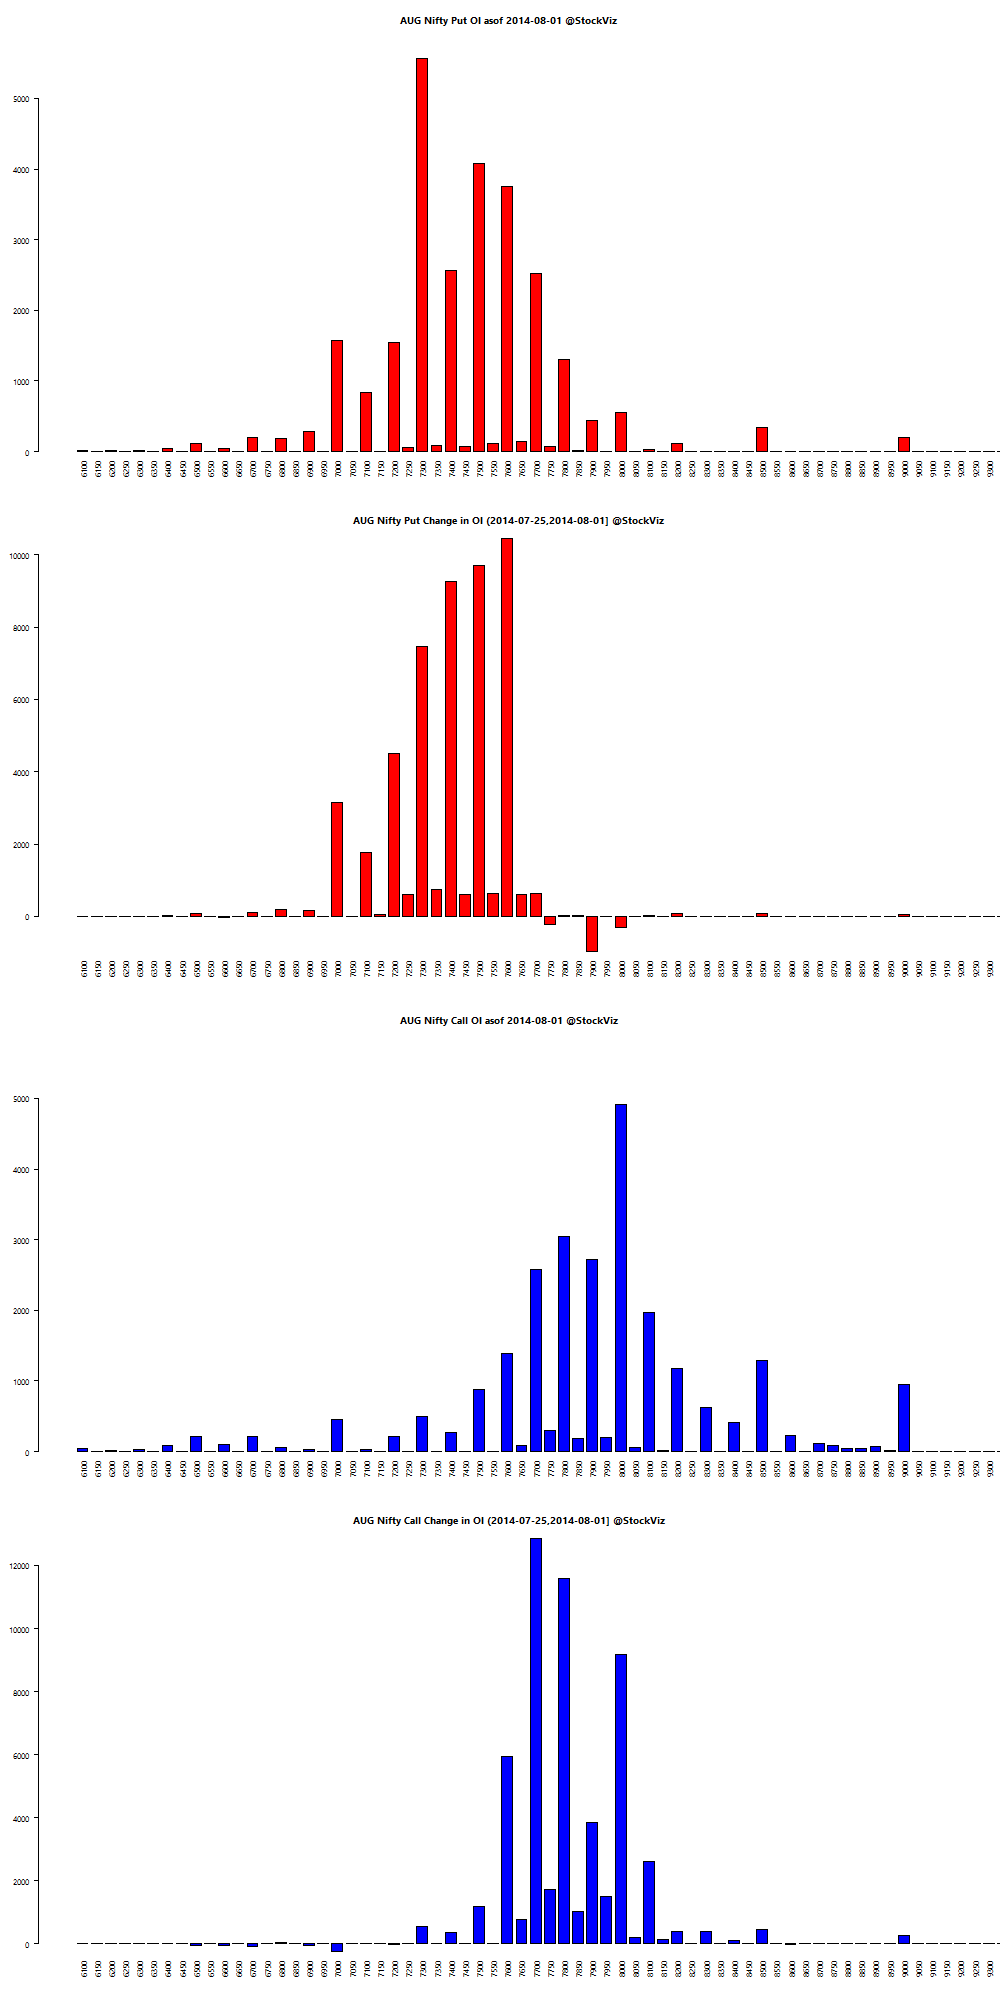
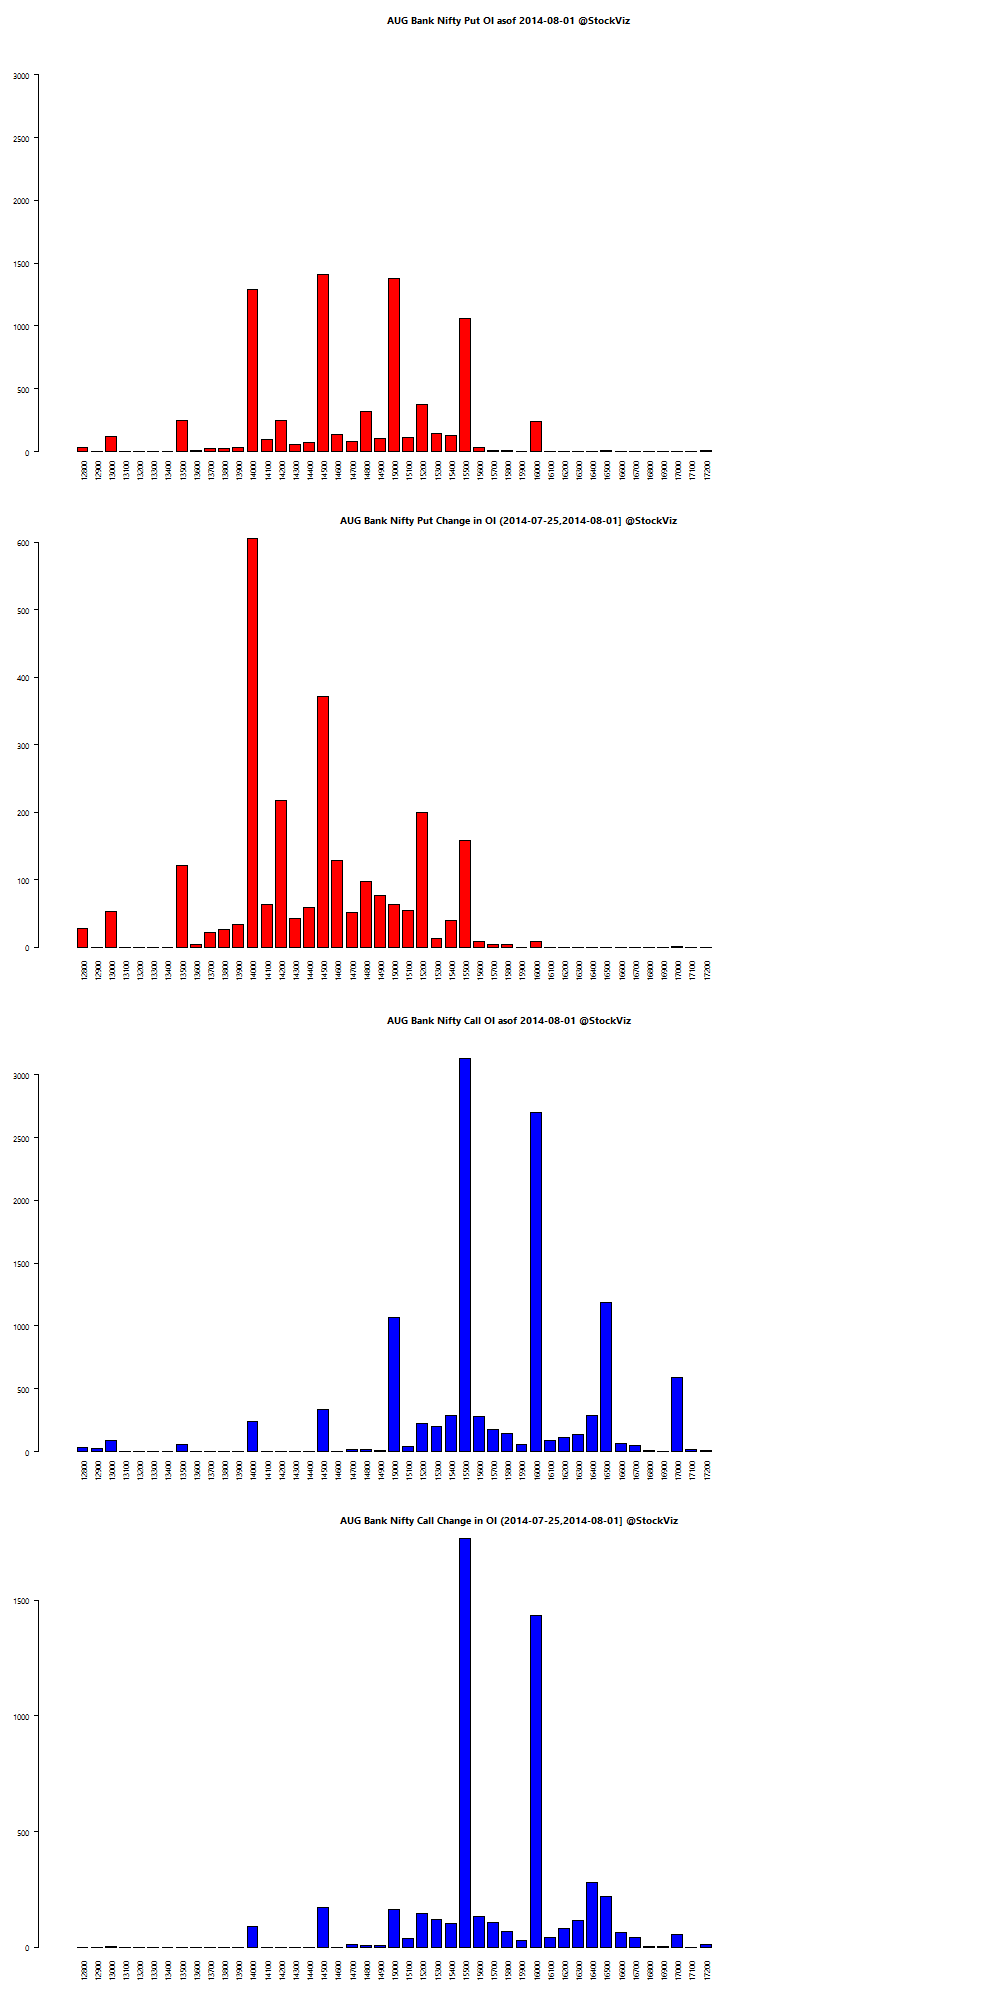
nifty.puts.calls.JUL.2014-07-04.2014-07-11

Thought for the weekend

What you think you know about money can hurt you:

  1. You too can be Warren Buffett
  2. You get what you pay for
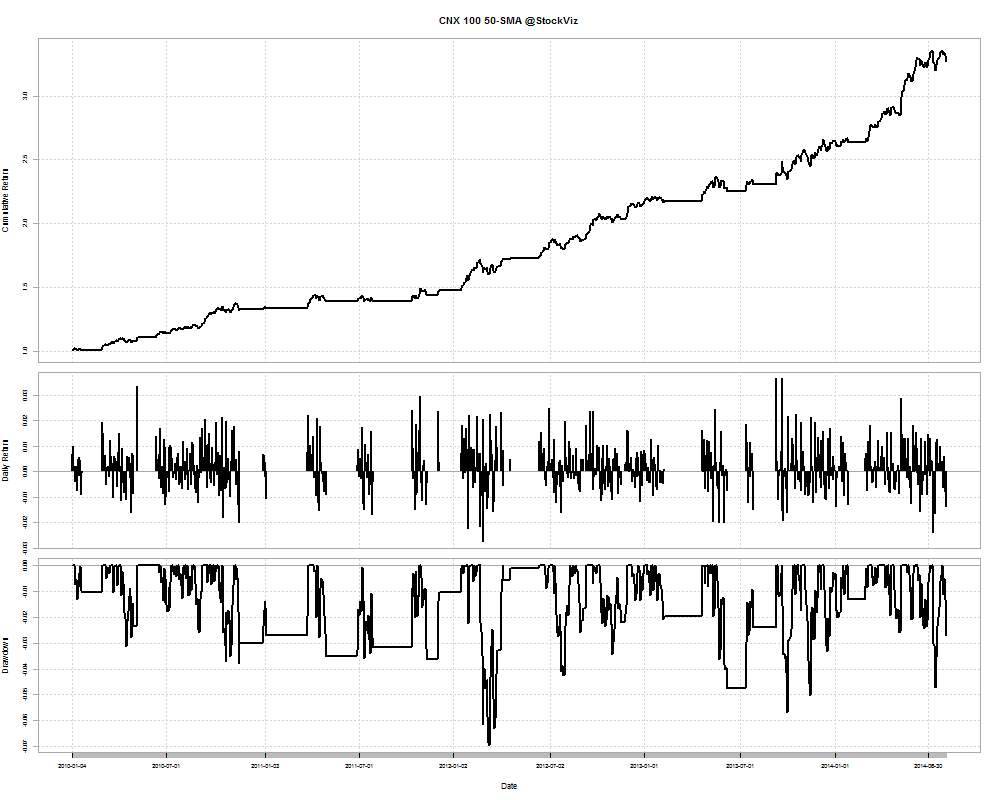
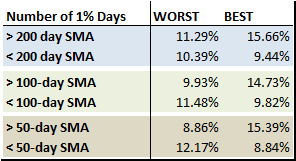
  3. You should focus either on fundamentals or technical analysis
  4. The myth of ‘passive’ investing
  5. The stock market will make you rich
  6. You have to beat the market
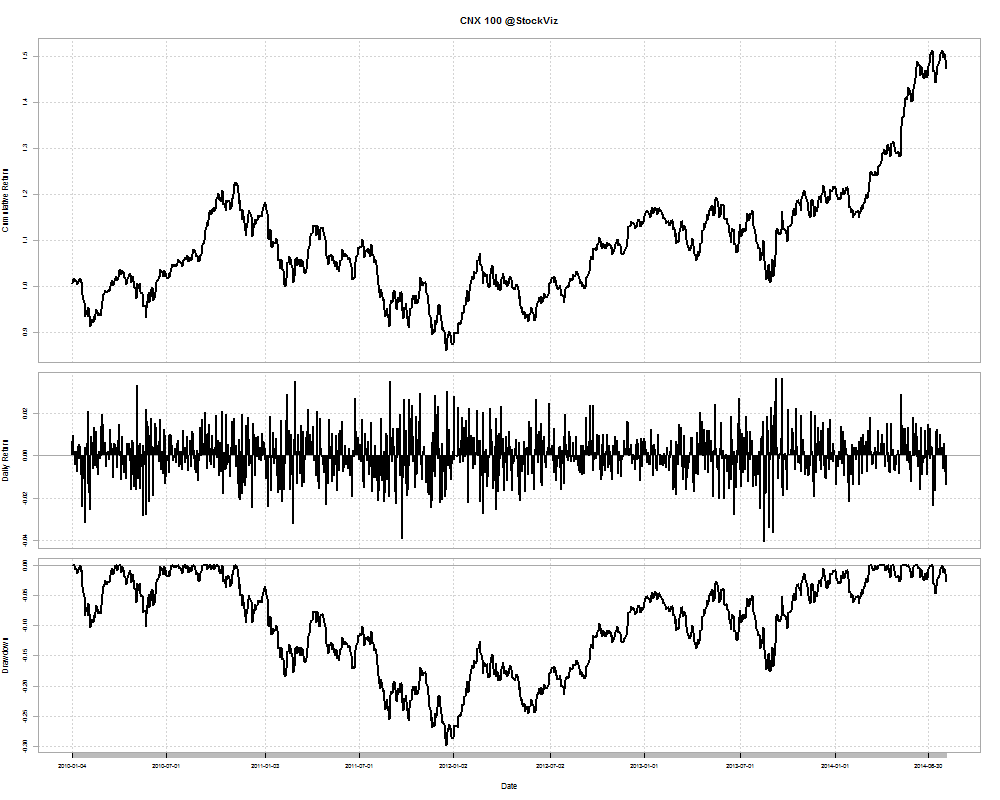
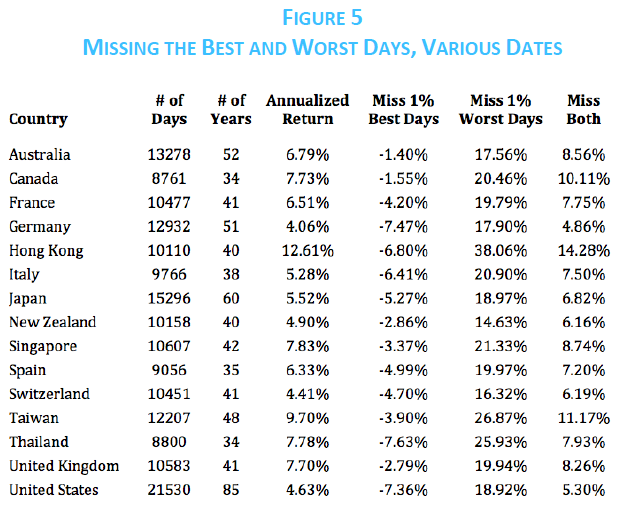
  7. ‘Stocks for the long run’ is the best strategy

Source: 7 market myths that make investors poorer

Market Cap Deciles

Introduction

Segmenting the market to track performance, risk etc. has been around for a long time. The Dow Jones Industrial Average was launched in 1896, the Sensex since 1986 and the Nifty since 1995. They provide a short-hand to gauge market performance and track returns over a period of time.

Index construction

An index can be constructed based on any combination of factors that are common to its constituents. They can be sectoral like FMCG, IT, etc. or they can be based on fundamental factors like book value, sales, etc. However, the most common way to construct an index remains free float market capitalization. This is the approach that most indices, like the Nifty, take.

The Nifty lists the following criteria for its constituents (NSE):

  1. Liquidity (Impact Cost)
  2. Float-Adjusted Market Capitalization
  3. Float
  4. Domicile
  5. Eligible Securities
  6. Other Variables

Deciles vs. Indices

Using existing indices come with some disadvantages:

  1. Rebalancing usually occurs once every 6 months – a lot can happen in that time.
  2. They usually have “other” considerations – not entirely quantitative.
  3. Do not cover the entire market – the biggest index in the NSE is CNX 500 that track 500 stocks.

An alternative is to build your own set of indices based on purely quantitative considerations. For example, you could divide the market into deciles based on their free float market cap and set a minimum daily turnover. This will then allow you to track micro-cap through mega-cap performance over arbitrary time frames, track how different stocks transition through deciles, set up “early warning” signals, etc.

Example

If you divide the market into deciles and set the minimum daily turnover to be 0.01% of float, then you end up with about 140 stocks in each. The 1st decile would be the micro-caps while the 10th would be the mega-caps. Here’s how the different deciles performed this week:

decile

Watch out for decile performance charts in our weekly and monthly performance roundups!

Weekly Recap: The World Is A Hyperlink

world equity markets 2014-06-27.2014-07-04

Equities

The Nifty turned out to be the best performing market this week, turning in +3.23% (+3.75% in USD.)

Major
DAX(DEU) +1.98%
CAC(FRA) +0.72%
UKX(GBR) +1.60%
NKY(JPN) +2.27%
SPX(USA) +1.52%
MINTs
JCI(IDN) +1.25%
INMEX(MEX) +2.05%
NGSEINDX(NGA) +2.00%
XU030(TUR) -1.44%
BRICS
IBOV(BRA) +1.80%
SHCOMP(CHN) +1.12%
NIFTY(IND) +3.23%
INDEXCF(RUS) +0.84%
TOP40(ZAF) +3.13%

Commodities

Energy
Brent Crude Oil -2.34%
Ethanol +5.57%
Heating Oil -2.73%
Natural Gas -0.75%
RBOB Gasoline -2.71%
WTI Crude Oil -1.78%
Metals
Copper +3.49%
Gold 100oz +0.17%
Palladium +2.65%
Platinum +1.53%
Silver 5000oz +0.47%

Currencies

USDEUR:+0.37% USDJPY:+0.67%

MINTs
USDIDR(IDN) -1.02%
USDMXN(MEX) -0.12%
USDNGN(NGA) -0.31%
USDTRY(TUR) +0.40%
BRICS
USDBRL(BRA) +0.55%
USDCNY(CHN) -0.21%
USDINR(IND) -0.58%
USDRUB(RUS) +2.21%
USDZAR(ZAF) +1.42%
Agricultural
Cattle +1.90%
Cocoa -1.81%
Coffee (Arabica) +1.24%
Coffee (Robusta) +2.27%
Corn -5.39%
Cotton -4.97%
Feeder Cattle +1.72%
Lean Hogs +0.50%
Lumber -0.30%
Orange Juice +1.36%
Soybean Meal -4.91%
Soybeans -3.50%
Sugar #11 +4.82%
Wheat -2.78%
White Sugar -2.94%

Nifty Heatmap

CNX NIFTY.2014-06-27.2014-07-04

Index Returns

indexperformance.2014-06-27.2014-07-04

Top winners and losers

EXIDEIND +11.25%
ADANIENT +13.99%
ADANIPORTS +19.08%
JPASSOCIAT -2.54%
TATAGLOBAL -1.90%
FEDERALBNK -1.60%
The Adani’s are crushing it right now. Go Modi!

ETFs

JUNIORBEES +5.68%
NIFTYBEES +3.52%
INFRABEES +2.45%
PSUBNKBEES +2.31%
BANKBEES +0.14%
GOLDBEES -0.79%
Yellow metal turned red…

Investment Theme Performance

IT went out of favor again. Otherwise, pretty much all other investment strategies performed well.

Sector Performance

sector performance.2014-06-27.2014-07-04

Yield curve

Yields continued to compress…

yield Curve.2014-06-27.2014-07-04

Advance Decline

advance.decline.line2.2014-06-27.2014-07-04

Nifty OI

A lot has been said about 8000 calls, but look at the action in 8200 and 8400 calls!

nifty.puts.calls.JUL.2014-06-27.2014-07-04

Thought for the weekend

Take a picture of this. Take a picture of that. Point the phone at this. Let the phone listen to that. The technology exists to capture anything and turn it into more. More information. A transaction. A conversation.
 
Say it. Take a photo of it. Type it. Scan it. Whatever. Now, it’s not just websites that give hyperlinks. Everything in the physical world is now a hyperlink too.

Source: The World Is A Hyperlink

Central Bank Musings

In my recent post Game Theory: Rajan vs. GovernmentGame Theory, we saw how the ideal relationship between the central bank and the government is one where neither party gets what it wants, but there’s a stable outcome. Here are a bunch of articles that expands on the conundrum faced by a central bank.

Interest rate policy is a poor substitute for good regulation

“Monetary policy faces significant limitations as a tool to promote financial stability,” Ms. Yellen said in an event at the International Monetary Fund in Washington. “Its effects on financial vulnerabilities … are not well understood and are less direct than a regulatory or supervisory approach; in addition, efforts to promote financial stability through adjustments in interest rates would increase the volatility of inflation and employment.”

Source: Janet Yellen Signals She Won’t Raise Rates to Fight Bubbles

Andy Haldane: Financial markets are nuts

Andy Haldane, the Bank of England’s chief economist, explains that central banks have “grown a new arm, macro-prudential regulation” to prevent the markets becoming over-egged with risk.

He cites the BoE announcing measures to prevent the housing market overheating, last week.

The financial markets today are nutty, but they’d be nuttier if central bankers hadn’t acted in the way they did since the collapse of Lehman Brothers.

Source: Andy Haldane agrees markets are ‘nuts’

Trilemmas breed instability

  • A country can have a fixed exchange rate, free movement of capital or independent monetary policy, but not all three.
  • Countries cannot simultaneously pursue democracy, national self-determination and economic globalisation.
  • It is impossible to combine financial stability, internationalised finance and national sovereignty.
  • Health systems have to choose among the “three Cs” — cost, coverage and choice.

There are very few “right” answers. All policy decisions involve trade-offs. Different generations of politicians (and voters) will favour different solutions.

Source: Three’s a crowd

Game Theory: Rajan vs. Government

Came across this incredible paper by Alan S. Binder, Issues in the Coordination of Monetary and Fiscal Policy, 1982 that uses game theory to explain the relationship between a country’s central bank and the government. It seemed appropriate, given that Raghuram Rajan, the RBI governor, is the same for both the UPA-2 and NDA governments, to study the options before both Rajan and the NDA in framing their relationship.

The paper was written when Regan was the President and Volcker was the chairman of the Federal Reserve. Inflation in 1980 had soared to 13.5% and Volcker had raised the federal funds rate to 20% by June 1981.

The feeling that Rajan and the government are at cross-purposes are echoed in the paper’s introduction:

Now, as often in the past, there are complaints from all quarters about the lack of coordination between monetary and fiscal policy. Indeed, the feeling that monetary and fiscal policies are acting at cross purposes is quite prevalent. This attitude, I think, reflects dissatisfaction with the current mix of expansionary fiscal policy and contractionary monetary policy, which pushes aggregate demand sideways while keeping interest rates sky high.

But how is this game played?

The game being played

The players in this game is Rajan, who sets interest rates, and the politicians, who determine the mix between government spending and tax revenues. Rajan thinks that the control of inflation is his primary responsibility and he’s anyway appointed for a fixed tenure. The politicians, on the other hand, have elections to win, which leads them to favor economic expansion over economic contraction.

The object of the game is for one player to force the other to make the unpleasant decisions. Rajan would prefer to have tax revenues exceed spending rather than to have the government suffer a budget deficit. The politicians, who worry about being elected, would prefer Rajan to keep interest rates low and the money supply ample. That policy would stimulate business activity and employment.

The preferences matrix

There are 3 decisions in front of each player: contract, do nothing, or expand. The numbers above the diagonal in each square represent the order of preference of Rajan; the numbers below the diagonals represent the order of preference of the politicians.

game theory RBI vs Government

The highest-ranked preferences of Rajan (A, B, and D) appear in the upper left-hand corner of the matrix, where at least one side is contractionary while the other is either supportive or does nothing to rock the boat. The three highest-ranked preferences of the politicians appear in the lower right-hand corner (F, H and I).

End game

Assuming that the relationship between Rajan and the politicians is such that collaboration and coordination are impossible, the game will end in the lower left-hand corner where monetary policy is contractionary and fiscal policy is expansionary. If Rajan cannot persuade the politicians to run a budget surplus and that the politicians cannot persuade Rajan to lower interest rates, neither side has any desire to alter its preferences nor can either dare to be simply neutral. As long as Rajan is contractionary and the politicians are expansionary, both sides are making the best of a bad bargain. And this is where we were under UPA-2.

The challenge, is to shift the play to the upper right hand corner. Here, neither side is “happy”, but this is the best case scenario – things are stable. This outcome is known as a Nash Equilibrium.

The Nash Equilibrium

Under the Nash Equilibrium the outcome, though stable, is less than optimal. Both sides would obviously prefer almost anything to this one. Yet they cannot reach a better bargain unless they drop their adversarial positions and work together on a common policy that would give each a supportive, or at least a neutral, role that would keep them from getting into each other’s way.

Will the budget provide the push to get us to the upper right hand corner? Only time will tell.

Sources:

  • Issues in the Coordination of Monetary and Fiscal Policy (pdf)
  • Early 1980s recession (Wikipedia)
  • Against the Gods: The Remarkable Story of Risk (Amazon)