Brought to you by ViewGenesis

Invest Without Emotions
Brought to you by ViewGenesis
How do you compare two Mutual Funds and what should be the basis for such a comparison? There is the question of returns, obviously. But higher returns can be achieved by taking on more risk. And then there’s the question of draw-downs. What were the periods of bad performance and how long did it take the asset manager to make up for those losses? How do you compare risk-adjusted returns of two funds? What if you want to compare returns to whatever benchmark index you wanted?
You can compare over 800 funds to each other and any benchmark index you choose. For example, are you confused between ICICI Top 100 and DSP BlackRock Top 100? Punch it in and hit compare.
And as you can see from the wealth chart below, BlackRock’s under-performance has been recent.
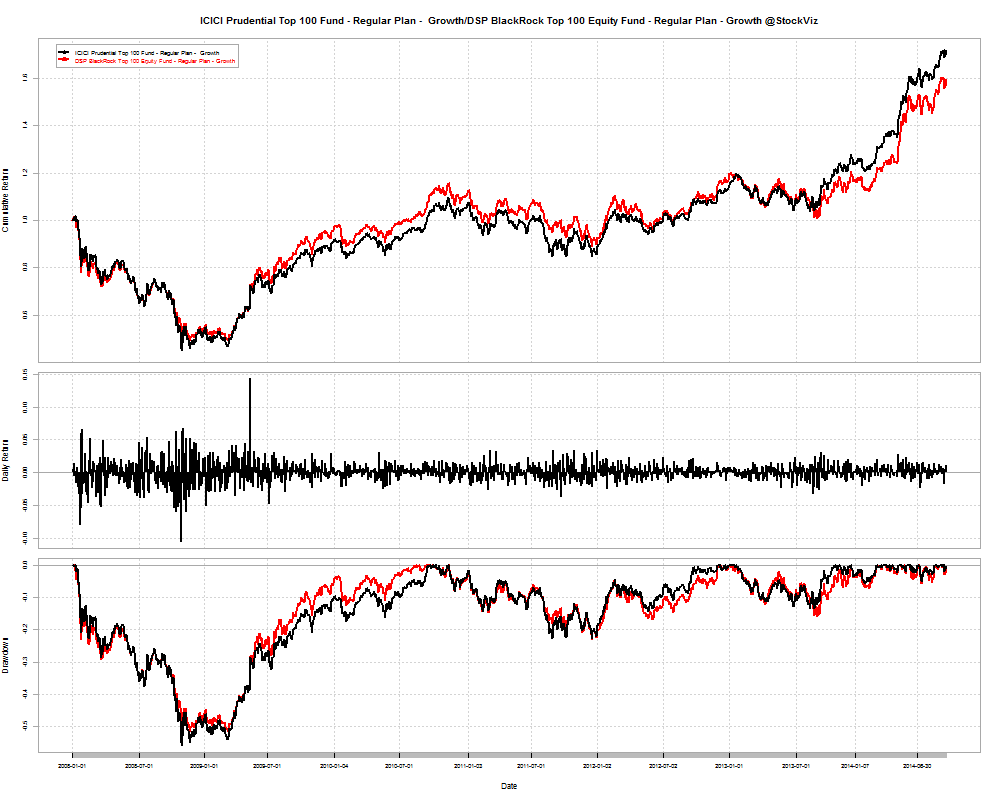
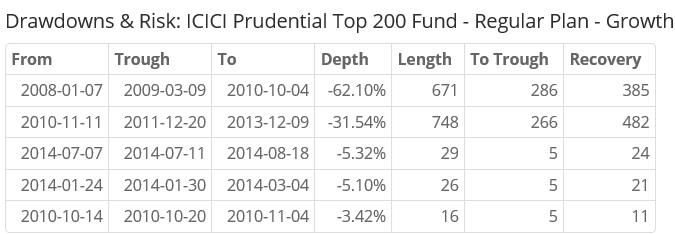
However, during the depths of the 2008 crisis, BlackRock managed to go down 51.73% vs. ICICI’s 55.66% and spent 632 days in the red vs. ICICI’s 656 days.
Now, how about comparing ICICI’s Top 100 vs. their own Top 200?
Confused between value funds and midcap index funds? Do famous managers live up to their reputations?
Go ahead, check out the tool: FundCompare
| MINTs | |
|---|---|
| JCI(IDN) | +1.63% |
| INMEX(MEX) | +0.20% |
| NGSEINDX(NGA) | +0.93% |
| XU030(TUR) | -1.10% |
| BRICS | |
|---|---|
| IBOV(BRA) | +0.90% |
| SHCOMP(CHN) | -0.11% |
| NIFTY(IND) | +0.20% |
| INDEXCF(RUS) | -1.85% |
| TOP40(ZAF) | +0.65% |
| Energy | |
|---|---|
| Brent Crude Oil | +1.06% |
| Ethanol | -9.04% |
| Heating Oil | -1.02% |
| Natural Gas | +0.03% |
| RBOB Gasoline | +3.15% |
| WTI Crude Oil | +0.06% |
| Metals | |
|---|---|
| Copper | -0.32% |
| Gold 100oz | -0.71% |
| Palladium | -2.65% |
| Platinum | -2.27% |
| Silver 5000oz | -4.30% |
| MINTs | |
|---|---|
| USDIDR(IDN) | +1.25% |
| USDMXN(MEX) | -0.29% |
| USDNGN(NGA) | +0.20% |
| USDTRY(TUR) | +1.01% |
| BRICS | |
|---|---|
| USDBRL(BRA) | +1.09% |
| USDCNY(CHN) | +0.09% |
| USDINR(IND) | +0.28% |
| USDRUB(RUS) | +1.79% |
| USDZAR(ZAF) | +0.69% |
| Agricultural | |
|---|---|
| Cattle | -0.59% |
| Cocoa | +2.78% |
| Coffee (Arabica) | +0.17% |
| Coffee (Robusta) | -2.17% |
| Corn | -0.38% |
| Cotton | -7.18% |
| Feeder Cattle | +0.40% |
| Lean Hogs | +0.09% |
| Lumber | -5.73% |
| Orange Juice | -2.53% |
| Soybean Meal | -25.03% |
| Soybeans | -12.21% |
| Sugar #11 | -2.24% |
| Wheat | -4.43% |
| White Sugar | +4.07% |
| Index | Change |
|---|---|
| Markit CDX EM | -0.28% |
| Markit CDX NA HY | -0.08% |
| Markit CDX NA IG | -0.35% |
| Markit CDX NA IG HVOL | +0.88% |
| Markit iTraxx Asia ex-Japan IG | +2.32% |
| Markit iTraxx Australia | +1.30% |
| Markit iTraxx Europe | -0.32% |
| Markit iTraxx Europe Crossover | -0.36% |
| Markit iTraxx Japan | -0.21% |
| Markit iTraxx SovX Western Europe | +0.68% |
| Markit LCDX (Loan CDS) | -0.06% |
| Markit MCDX (Municipal CDS) | +3.00% |

| Decile | Mkt. Cap. | Adv/Decl |
|---|---|---|
| 1 (micro) | -1.51% | 74/71 |
| 2 | -2.23% | 72/72 |
| 3 | -1.08% | 67/77 |
| 4 | -0.32% | 69/75 |
| 5 | -1.86% | 67/77 |
| 6 | -1.24% | 70/75 |
| 7 | +0.60% | 70/74 |
| 8 | -0.34% | 76/68 |
| 9 | -0.32% | 74/70 |
| 10 (mega) | -0.16% | 67/78 |
| NIFTYBEES | +0.30% |
| INFRABEES | +0.27% |
| JUNIORBEES | -0.80% |
| GOLDBEES | -0.82% |
| BANKBEES | -0.88% |
| CPSEETF | -3.84% |
| PSUBNKBEES | -3.92% |
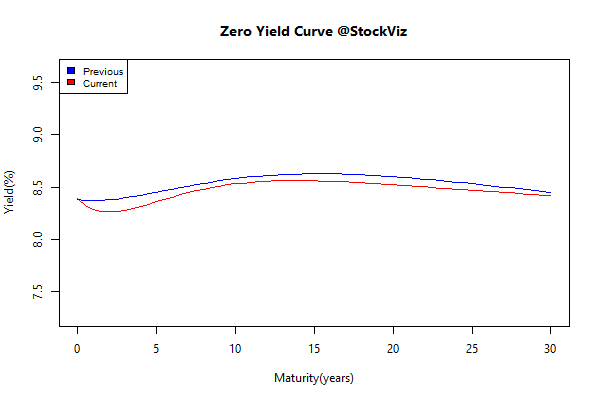
| Sub Index | Change in YTM | Total Return(%) |
|---|---|---|
| GSEC TB | +0.36 | +0.06% |
| GSEC SUB 1-3 | +0.31 | -0.28% |
| GSEC SUB 3-8 | +0.08 | -0.01% |
| GSEC SUB 8 | -0.06 | +0.78% |

| IT 3rd Benchers | +2.54% |
| Quality to Price | +2.51% |
| Market Elephants | +2.51% |
| Enterprise Yield | +1.70% |
| Efficient Growth | +1.13% |
| Magic Formula Investing | +0.31% |
| Financial Strength Value | -0.08% |
| Momentum 200 | -0.15% |
| CNX 100 50-Day Tactical | -0.26% |
| Refract: PPFAS Long Term Value Fund | -0.30% |
| Balance-sheet Strength | -0.57% |
| Piotroski ROC Small Caps | -0.80% |
| Growth with Moat | -1.00% |
| Market Fliers | -1.94% |
| Industrial Value | -3.63% |
| ADAG Mania | -4.60% |
The real challenge to Adam Smith’s invisible hand is rooted in the very logic of the competitive process itself.
Charles Darwin was one of the first to perceive the underlying problem clearly. One of his central insights was that natural selection favors traits and behaviors primarily according to their effect on individual organisms, not larger groups. Sometimes individual and group interests coincide and in such cases we often get invisible hand-like results.
In other cases, however, mutations that help the individual prove quite harmful to the larger group. This is in fact the expected result for mutations that confer advantage in head-to-head competition among members of the same species. This conflict pervades human interactions when individual rewards depend on relative performance.
Source: The Darwin Economy – Why Smith’s Invisible Hand Breaks Down
A quick update to our II Trend report from last month.
FII invested $1742.07 million in debt vs $1221.89 million in equities so far in Septmeber.

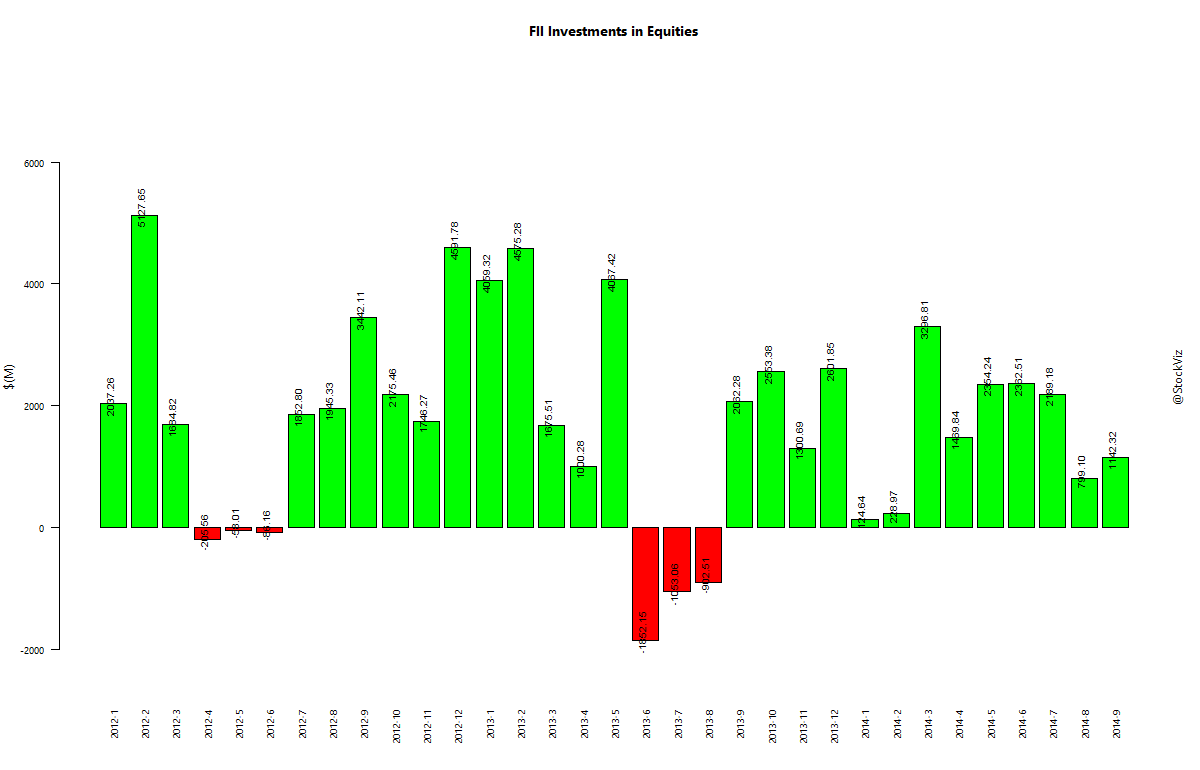
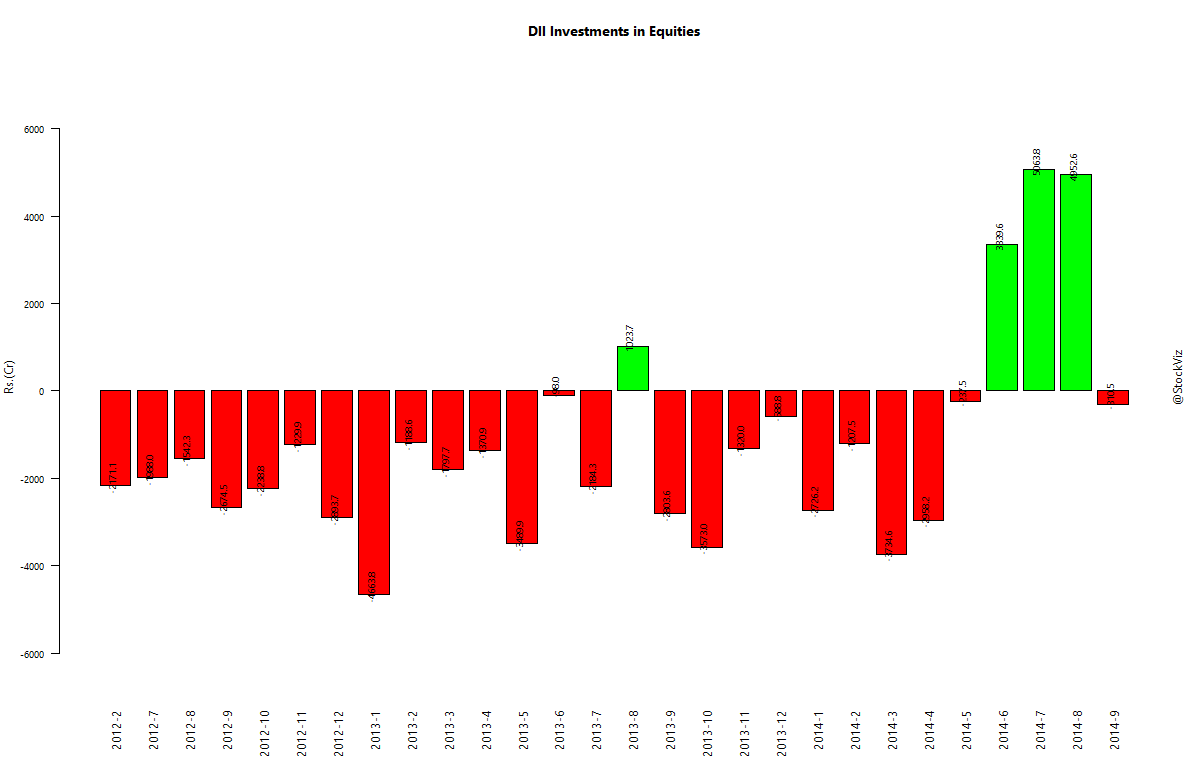
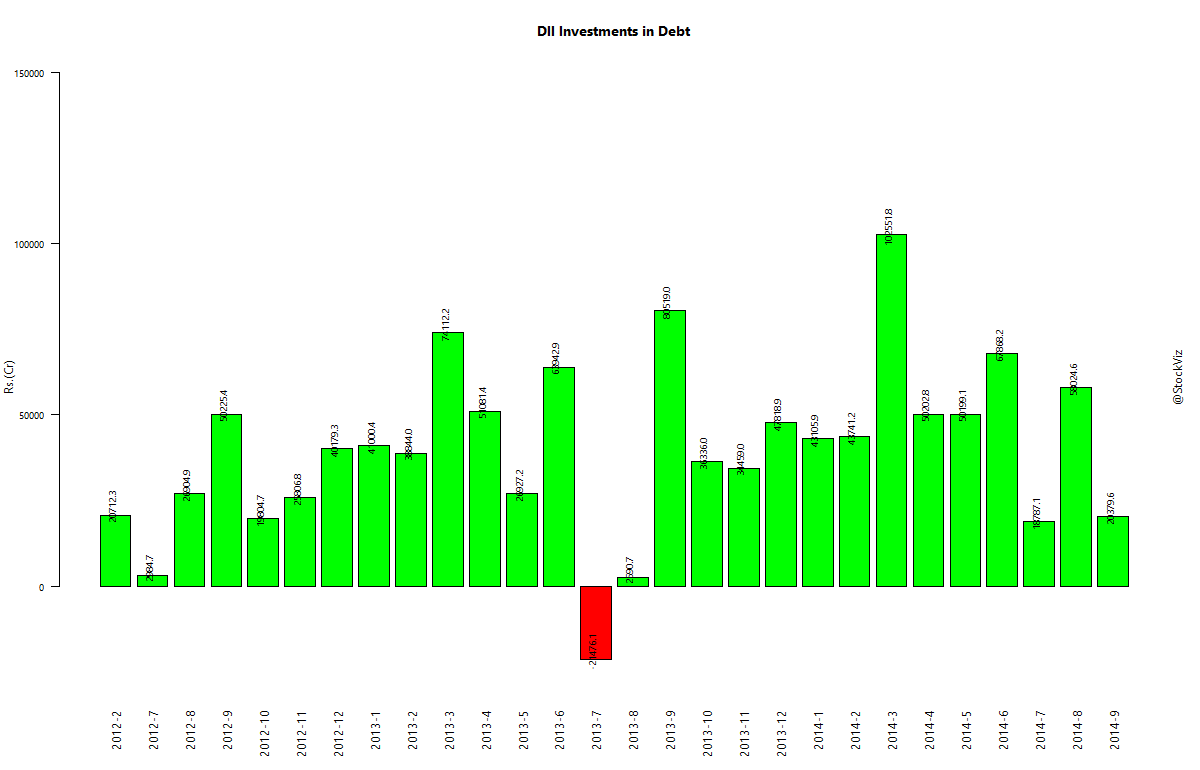
In September, DIIs invested Rs 20,379.6 cr in debt vs. -310.5 cr in equity.
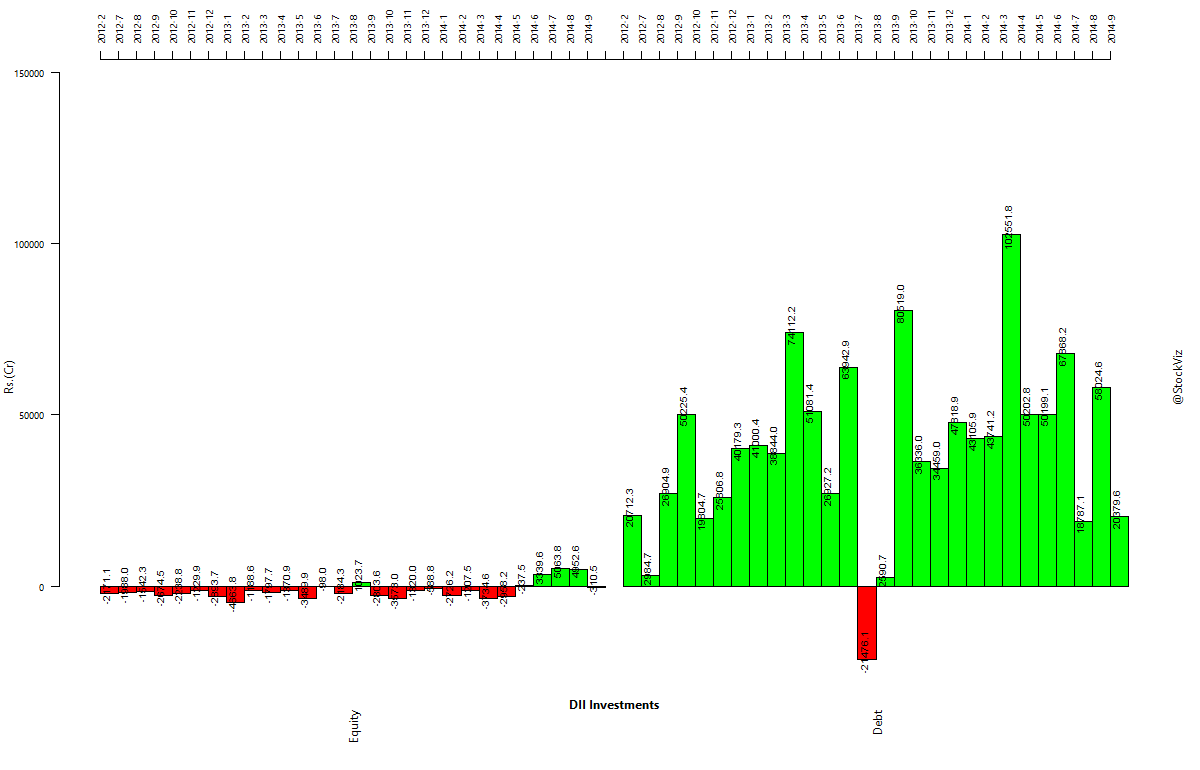
Not sure what I like better – debt or equity. Debt investors will benefit from the falling interest rate environment in AAA paper and shrinking defaults in sub-primes. Equity investors will benefit from improving balance-sheets and an improving demand-side equation. Stay tuned…
Brought to you by ViewGenesis