Author: shyam

Weekly Recap: AI

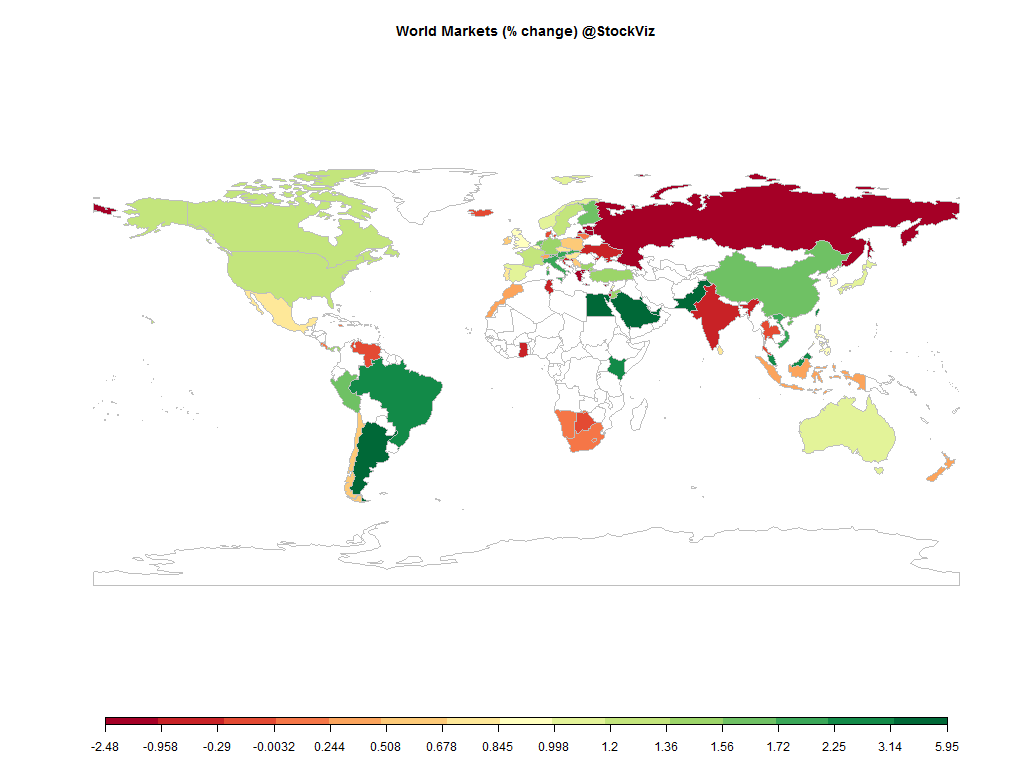
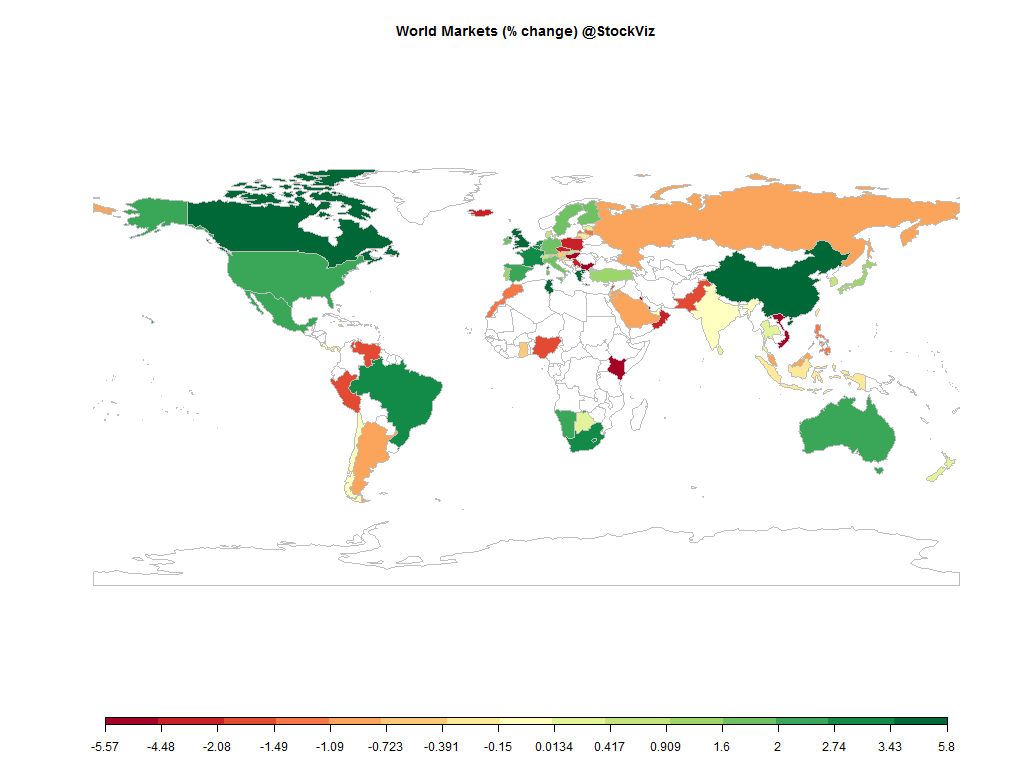
world.2014-10-22.2014-10-31

Equities

Major
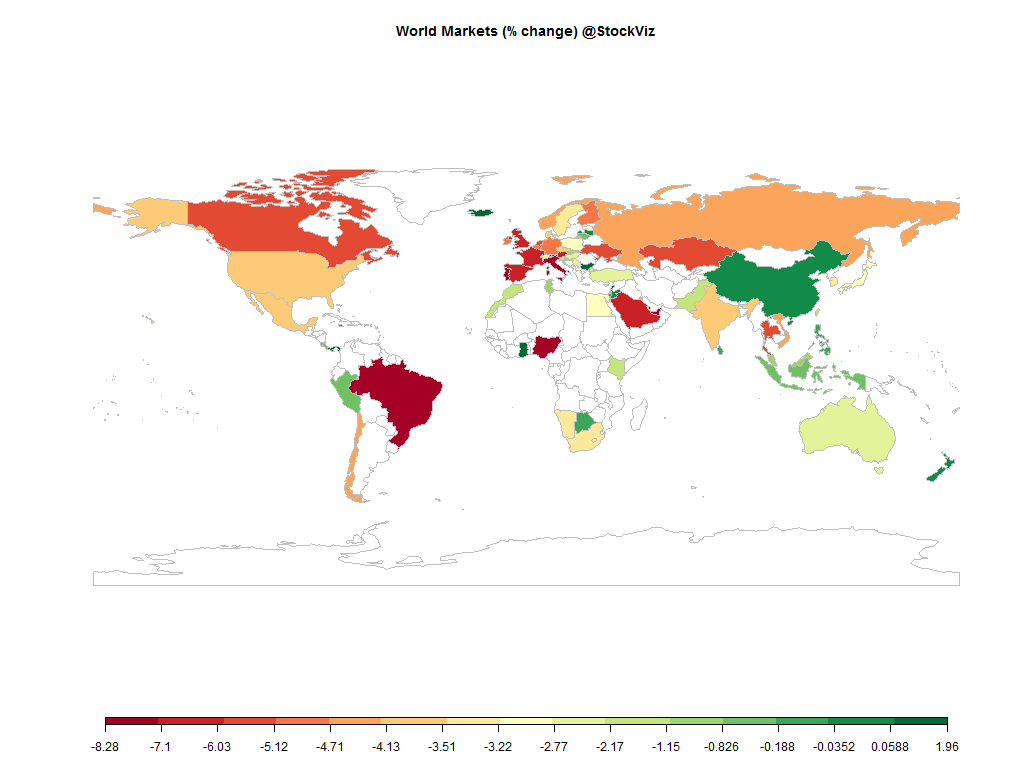
DAX(DEU) +4.33%
CAC(FRA) +3.12%
UKX(GBR) +2.29%
NKY(JPN) +8.02%
SPX(USA) +4.36%
MINTs
JCI(IDN) +0.30%
INMEX(MEX) +3.90%
NGSEINDX(NGA) -3.70%
XU030(TUR) +3.53%
BRICS
IBOV(BRA) +4.73%
SHCOMP(CHN) +4.02%
NIFTY(IND) +4.08%
INDEXCF(RUS) +8.32%
TOP40(ZAF) +3.14%

Commodities

Energy
Brent Crude Oil +0.98%
Ethanol +3.33%
Heating Oil +1.93%
Natural Gas +5.71%
RBOB Gasoline -0.35%
WTI Crude Oil -2.17%
Metals
Copper +0.99%
Gold 100oz -6.21%
Palladium +2.45%
Platinum -2.39%
Silver 5000oz -9.14%

Currencies

USDEUR:+1.01% USDJPY:+4.80%

MINTs
USDIDR(IDN) +0.60%
USDMXN(MEX) -0.57%
USDNGN(NGA) +0.27%
USDTRY(TUR) -1.08%
BRICS
USDBRL(BRA) -0.40%
USDCNY(CHN) -0.08%
USDINR(IND) +0.14%
USDRUB(RUS) +4.02%
USDZAR(ZAF) +0.26%
Agricultural
Cattle +1.19%
Cocoa -5.73%
Coffee (Arabica) -1.57%
Coffee (Robusta) +1.29%
Corn +6.31%
Cotton +2.32%
Feeder Cattle -2.09%
Lean Hogs -1.76%
Lumber -1.03%
Orange Juice -4.90%
Soybean Meal +14.76%
Soybeans +8.13%
Sugar #11 -3.09%
Wheat +1.82%
White Sugar -0.40%

Credit Indices

Index Change
Markit CDX EM +0.71%
Markit CDX NA HY -0.05%
Markit CDX NA IG -0.50%
Markit CDX NA IG HVOL -3.58%
Markit iTraxx Asia ex-Japan IG -6.34%
Markit iTraxx Australia -6.48%
Markit iTraxx Europe -1.58%
Markit iTraxx Europe Crossover -0.61%
Markit iTraxx Japan -6.54%
Markit iTraxx SovX Western Europe -0.61%
Markit LCDX (Loan CDS) +0.08%
Markit MCDX (Municipal CDS) -2.24%
So what if the US Fed stopped QE? Japan rode to the rescue in style. If you thought that the Fed buying up treasuries was skewing the market, wait until Japan’s public pension fund starts buying equities and foreign bonds. The markets understandably went “yipi ka yei” on the news.

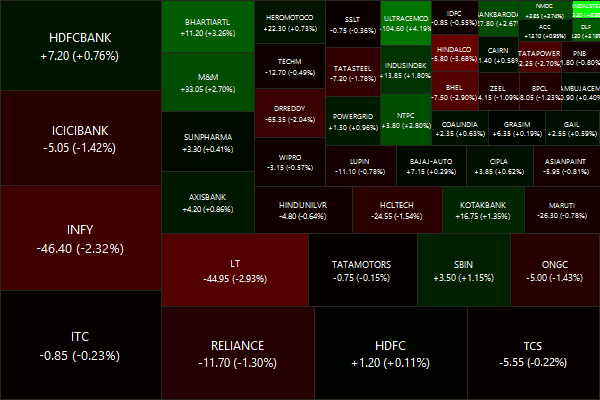
Nifty Heatmap

CNX NIFTY.2014-10-22.2014-10-31

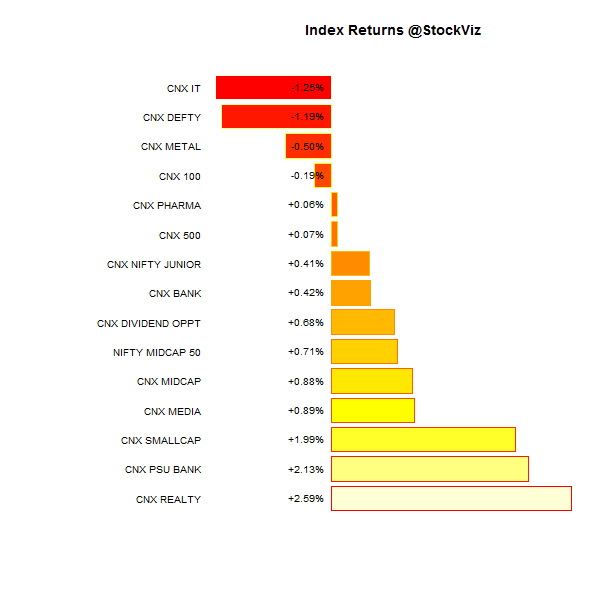
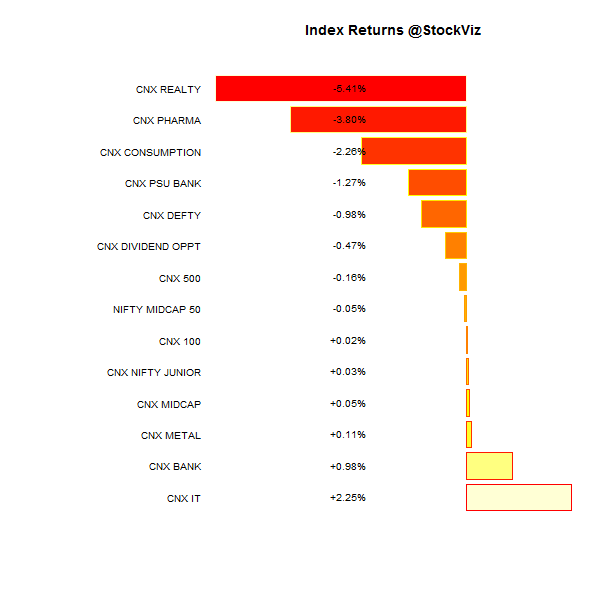
Index Returns

index performance.2014-10-22.2014-10-31

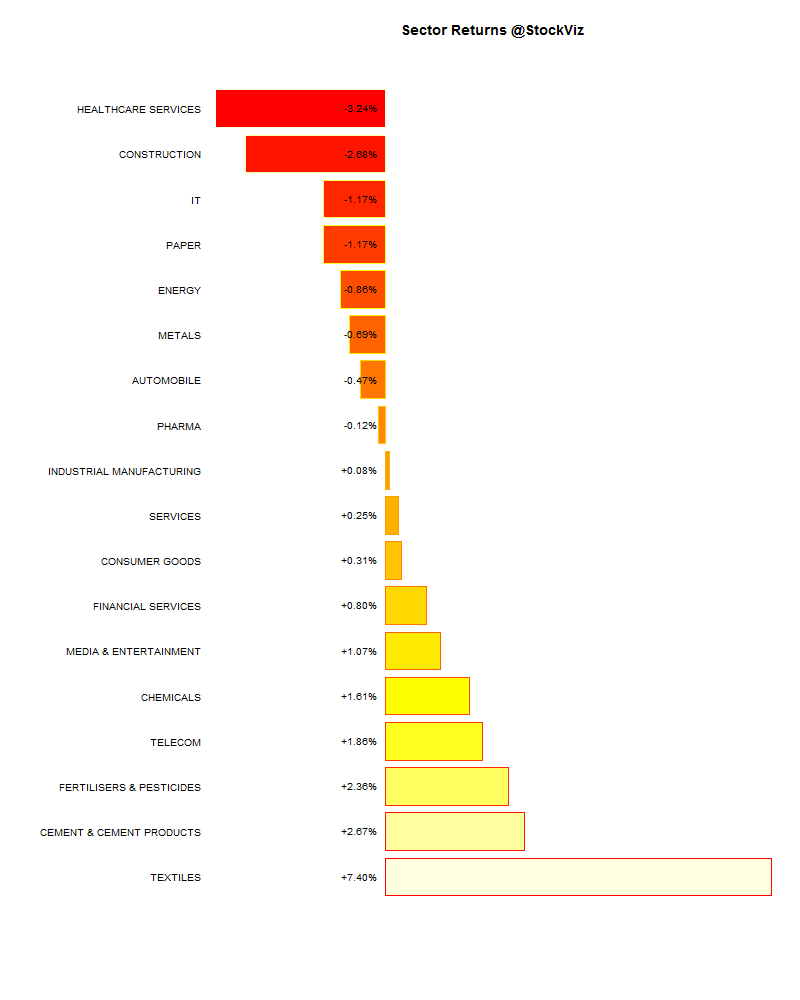
Sector Performance

sector performance.2014-10-22.2014-10-31

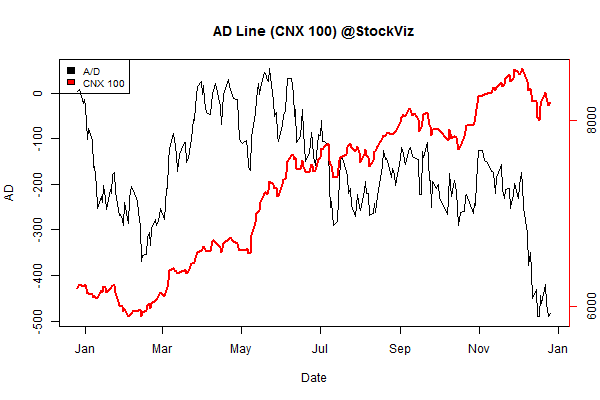
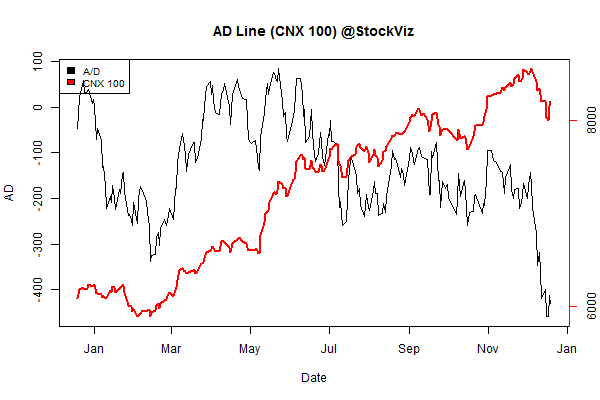
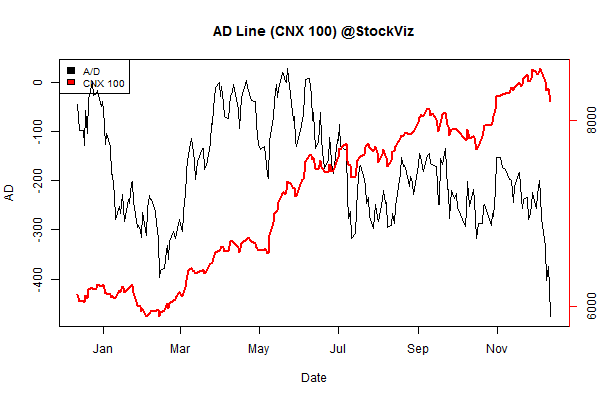
Advance Decline

advance.decline.line2.2014-10-22.2014-10-31

Market Cap Decline Performance

Decile Mkt. Cap. Adv/Decl
1 (micro) +1.38% 68/62
2 +6.38% 78/53
3 +4.52% 74/58
4 +4.30% 71/60
5 +4.00% 70/62
6 +3.98% 74/58
7 +3.13% 75/56
8 +2.85% 71/61
9 +3.03% 74/58
10 (mega) +3.59% 68/64
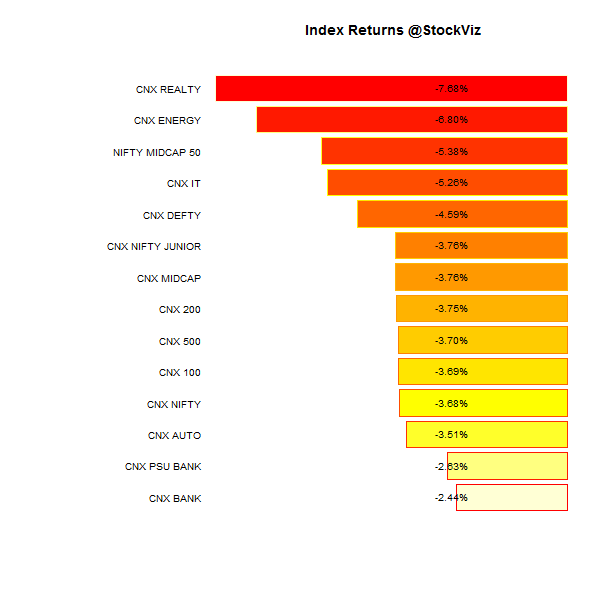
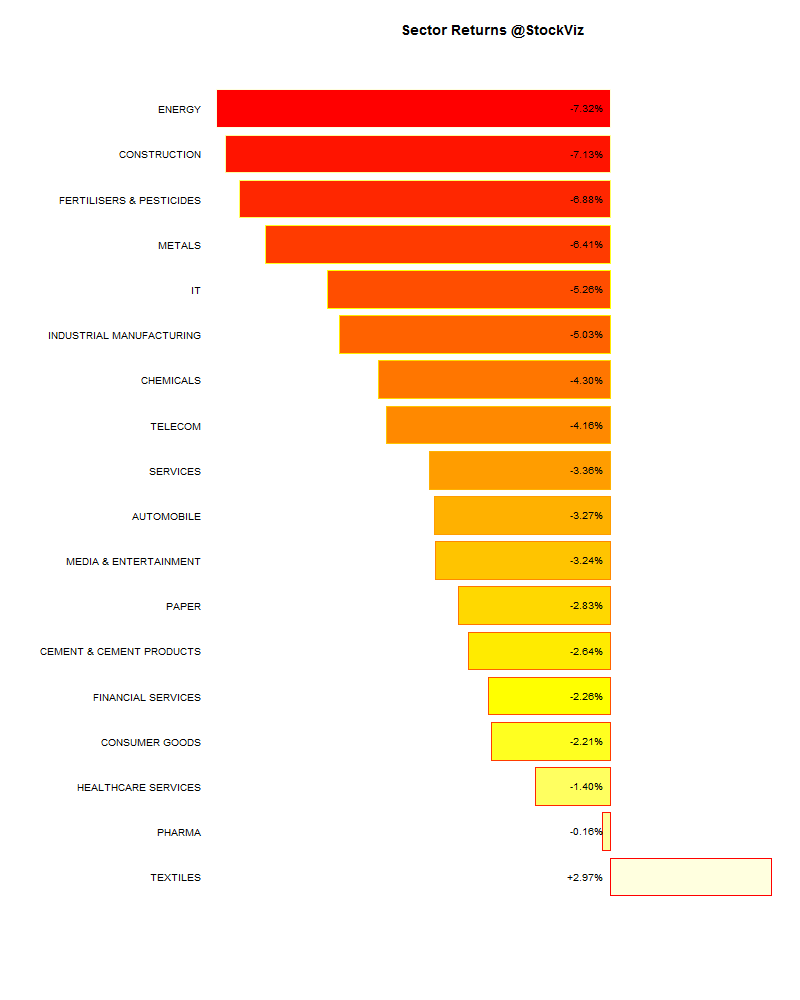
Stocks rallied across the board after last week’s bloodbath.

Top Winners and Losers

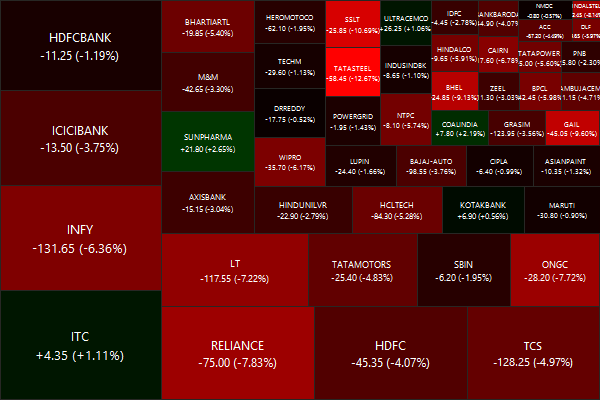
GAIL +9.47%
YESBANK +10.19%
HINDALCO +10.27%
WIPRO -3.42%
BHARTIARTL -2.58%
HINDUNILVR -2.52%
The first week of November is going to see a lot of earnings announcements. Expect a lot of them to miss estimates, given how weak the overall economy was in the last quarter.

ETFs

JUNIORBEES +4.47%
BANKBEES +4.38%
NIFTYBEES +4.25%
CPSEETF +3.79%
INFRABEES +1.22%
PSUBNKBEES -0.67%
GOLDBEES -3.92%
If Fed QE was bullish for gold, shouldn’t Japanese QE also be bullish? Apparently not.

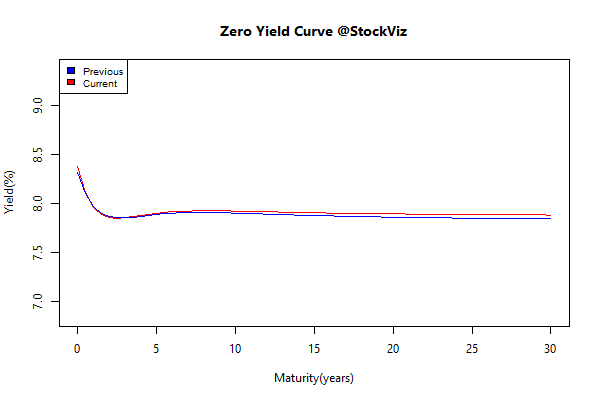
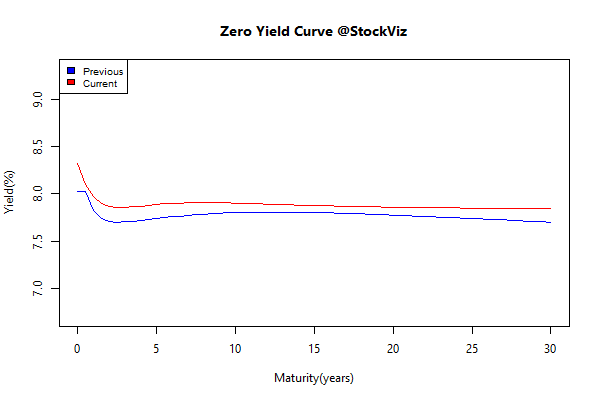
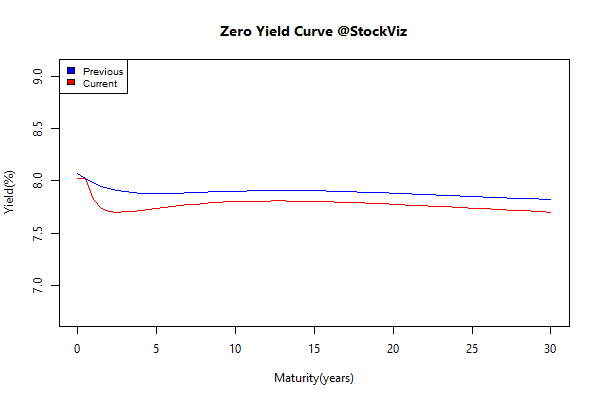
Yield Curve

Quick! The Japanese are coming!

yield Curve.2014-10-22.2014-10-31

Bond Indices

Sub Index Change in YTM Total Return(%)
GSEC TB +0.24 +0.13%
GSEC SUB 1-3 +0.27 -0.09%
GSEC SUB 3-8 +0.08 +0.04%
GSEC SUB 8 -0.06 +0.89%
Long bonds FTW!

Theme Performance

Thought for the weekend

The chief virtue of AIs will be their alien intelligence. An AI will think about food differently than any chef, allowing us to think about food differently. Or to think about manufacturing materials differently. Or clothes. Or financial derivatives. Or any branch of science and art. The alienness of artificial intelligence will become more valuable to us than its speed or power.

Source: The Three Breakthroughs That Have Finally Unleashed AI on the World

Fly or Die: Last Year’s Diwali Picks

It is that time of the year again when brokerage houses try and pick stocks for “muhurat trading.” Let’s see how they fared with their 2013 picks. NIFTY is up +27% since last Diwali.

Kotak Securities

Kotak picked 11 stocks that returned about +50%. Sharpe: 0.16732

kotak's 2013 Diwali picks

Microsec

Microsec picked 9 stocks that returned about +37%. Sharpe: 0.12822; but their portfolio has been pummeled lately.

microsec's 2013 Diwali picks

Globe

Globe’s 10 stocks returned about +37% but with a much lower Sharpe (0.11445) compared to Kotak and Microsec. It hit its peak sometime in July and its been sliding since then.

globe's 2013 Diwali Picks

Prabhudas Lilladher

Prabhudas Lilladher picked 4 stocks. Got to admire their courage here. +45% since Diwali, Sharpe: 0.15509.

Prabhudas Lilladher's 2013 Diwali stock picks

2014 Picks

We have created new themes to track brokers’ 2014 Diwali picks. Kotak, Globe and ET have published their recommendations so far.

You can find all Broker Recommendations here.

Are we setup up for a bond rally?

ICICI came out with an interesting note on why they expects Indian bonds to rally. They outline 5 factors:

  1. Improving current account balance
  2. Falling inflation
  3. Fiscal consolidation
  4. Rising savings rate
  5. Substantial FII inflows

Related: Long-term Gilt Funds, where we layout the same thesis.


You can run our comparison tool here: FundCompare


Please get in touch with Shyam for advice on investing in mutual funds.
You can either WhatsApp him or call him at 080-2665-0232.
He is an AMFI registered IFA who can advice you on IDBI, Mirae, HDFC, ICICI Pru, UTI and Birla Sun Life funds.

Weekly Recap: Why do we want to be rich?

world.2014-10-10.2014-10-17

Equities

Major
DAX(DEU) +0.70%
CAC(FRA) -0.99%
UKX(GBR) -0.47%
NKY(JPN) -5.02%
SPX(USA) -2.08%
MINTs
JCI(IDN) +1.33%
INMEX(MEX) -1.04%
NGSEINDX(NGA) -5.55%
XU030(TUR) +3.10%
BRICS
IBOV(BRA) -0.94%
SHCOMP(CHN) -1.40%
NIFTY(IND) -1.02%
INDEXCF(RUS) +1.50%
TOP40(ZAF) +1.97%

Commodities

Energy
Brent Crude Oil -4.30%
Ethanol +9.65%
Heating Oil -2.29%
Natural Gas -2.44%
RBOB Gasoline -0.99%
WTI Crude Oil -3.31%
Metals
Copper -0.99%
Gold 100oz +1.32%
Palladium -3.78%
Platinum +0.05%
Silver 5000oz +0.58%

Currencies

USDEUR:-1.07% USDJPY:-0.89%

MINTs
USDIDR(IDN) -0.92%
USDMXN(MEX) +0.81%
USDNGN(NGA) +0.39%
USDTRY(TUR) -1.74%
BRICS
USDBRL(BRA) +1.26%
USDCNY(CHN) -0.09%
USDINR(IND) +0.18%
USDRUB(RUS) +0.69%
USDZAR(ZAF) -0.12%
Agricultural
Cattle -0.10%
Cocoa -0.97%
Coffee (Arabica) -5.03%
Coffee (Robusta) -2.13%
Corn +3.96%
Cotton -1.90%
Feeder Cattle -0.85%
Lean Hogs -17.59%
Lumber -2.48%
Orange Juice -2.49%
Soybean Meal -2.28%
Soybeans +2.92%
Sugar #11 +0.24%
Wheat +3.36%
White Sugar +1.00%

Credit Indices

Index Change
Markit CDX EM -1.19%
Markit CDX NA HY -1.17%
Markit CDX NA IG +4.11%
Markit CDX NA IG HVOL +15.62%
Markit iTraxx Asia ex-Japan IG +7.44%
Markit iTraxx Australia +6.28%
Markit iTraxx Europe +8.22%
Markit iTraxx Europe Crossover +47.19%
Markit iTraxx Japan +6.47%
Markit iTraxx SovX Western Europe +1.20%
Markit LCDX (Loan CDS) -0.40%
Markit MCDX (Municipal CDS) +2.31%
Markets were in full-blown panic mode this week. So much so that the president of the St. Louis Fed, James Bullard, a hawk, had to come out and say that central-bank bond buying should continue beyond its scheduled end this month. And the chief economist at the Bank of England, Andrew Haldane, said “interest rates could remain lower for longer.” Previously, UK interest rates had been expected to rise early next year.

Nifty Heatmap

CNX NIFTY.2014-10-10.2014-10-17

Index Returns

index performance.2014-10-10.2014-10-17

Sector Performance

sector performance.2014-10-10.2014-10-17

Advance Decline

advance.decline.line2.2014-10-10.2014-10-17

Market cap decile performance

Decile Mkt. Cap. Adv/Decl
1 (micro) -9.23% 70/65
2 -3.31% 56/79
3 -3.21% 58/78
4 -2.90% 59/75
5 -3.38% 58/77
6 -2.42% 60/75
7 -3.11% 59/77
8 -1.58% 61/73
9 -2.56% 71/64
10 (mega) -0.98% 67/69
A total bloodbath beyond the mega-caps.

Top winners and losers

LICHSGFIN +6.63%
BANKINDIA +7.90%
UNIONBANK +8.26%
DLF -27.55%
HCLTECH -13.35%
TCS -8.86%
Are rate-cut expectations running ahead of themselves? Rally in banking and home-finance stocks feel a bit overdone. TCS and HCLTECH sold off on earnings. But read this. DLF got royally fcuked by the SEBI.

ETFs

BANKBEES +2.96%
PSUBNKBEES +1.98%
GOLDBEES +1.06%
CPSEETF +0.25%
JUNIORBEES -0.04%
NIFTYBEES -1.11%
INFRABEES -1.63%
A surprising rally in banks while infrastructure remains sick…

Yield Curve

yield Curve.2014-10-10.2014-10-17

Bond Indices

Sub Index Change in YTM Total Return(%)
GSEC TB -0.29 +0.24%
GSEC SUB 1-3 -0.65 -0.25%
GSEC SUB 3-8 +0.01 -0.59%
GSEC SUB 8 +0.03 +0.11%
Curve can’t get any flatter…

Nifty OI

nifty.puts.calls.OCT.2014-10-10.2014-10-17

Bank Nifty OI

bank-nifty.puts.calls.OCT.2014-10-10.2014-10-17

Theme Performance

The CNX 100 Tactical Theme spent the whole week in cash. Both value and momentum strategies got pummeled.

Thought for the weekend

Fearing the future is natural, as is the conviction that ultimately we each must depend on ourselves. But in truth, our safest asset is our collective prosperity. Technological progress and productivity gains continue to make us richer on the supply side.

It would be tragic if productivity gains end up making most of us poorer, just because we find it uncomfortable to face the euthanasia of the rentier.

Source: safe assets, secular stagnation, and financial repression

Decisions Under Uncertainty

TCS has been a tremendous wealth creator. Between 2004-8-25 and now, its has turned in a cumulative return of 1164% with an IRR of 28.35% during that period. So you should just “buy right and sit tight”, yeah?

TCS.performance

But before you hang that on your wall, let me take you back to Jan 2007. TCS started sliding on global worries and did stop until losing 65.52% of its value. It took 458 days to make a bottom and another 249 days to climb back up from it. If you think the meltdown in 2007/8 was a once-in-a-lifetime affair, then let me point out that the second worst drawdown for TCS was 27.40% back in 2006. And before that, 24% in 2005.

tcs drawdown

In my experience, 99% of the investors out there would have dumped the stock. That 28.35% IRR is wishful thinking for most investors because not only would they have dumped the stock at maximum pain (peak drawdown) but they would have failed to get back into the stock as well.

But does this mean you should never sell a stock? Have a look at Reliance Infrastructure as a counter example.

RELINFRA.performance

It is yet to recover from the 87% drawdown in 2008! It has been a value destroyer since early 2008.

relinfra drawdown

So does this mean that you should have a “stop loss”? How should you manage whiplash? How do you keep track of all the reasons you bought a stock and if it still fits that criteria? If you sell a stock, what do you replace it with?

The key to making decisions under uncertainty is to have a process. A process that

  1. identifies investment opportunities based on pre-selected parameters (value, momentum, factor, beta, etc…),
  2. has a set holding period, based on the intricacies from (a) and current market conditions, and
  3. forces stocks out of the portfolio based on (a) and (b)

This where StockViz Themes come into the picture. Themes are technology wrappers around different investment strategies that make it convenient for investors to follow a process.

To know what combinations of Themes are right for your risk appetite and investment horizon, get in touch with us now!