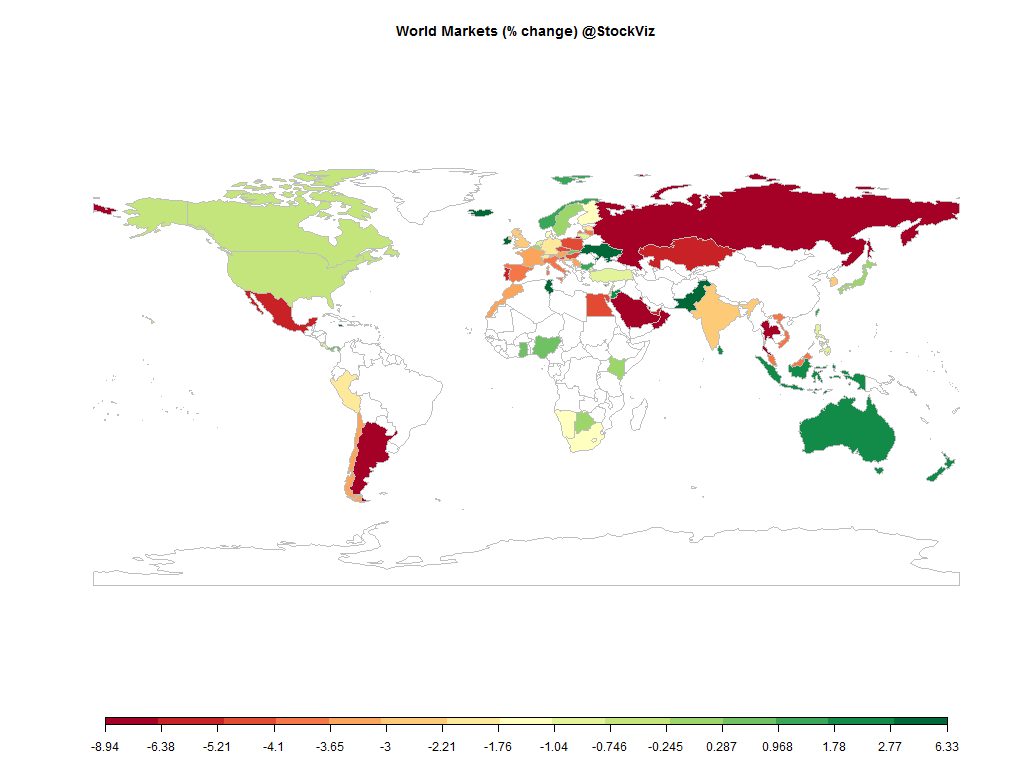
Equities
MINTs | |
---|---|
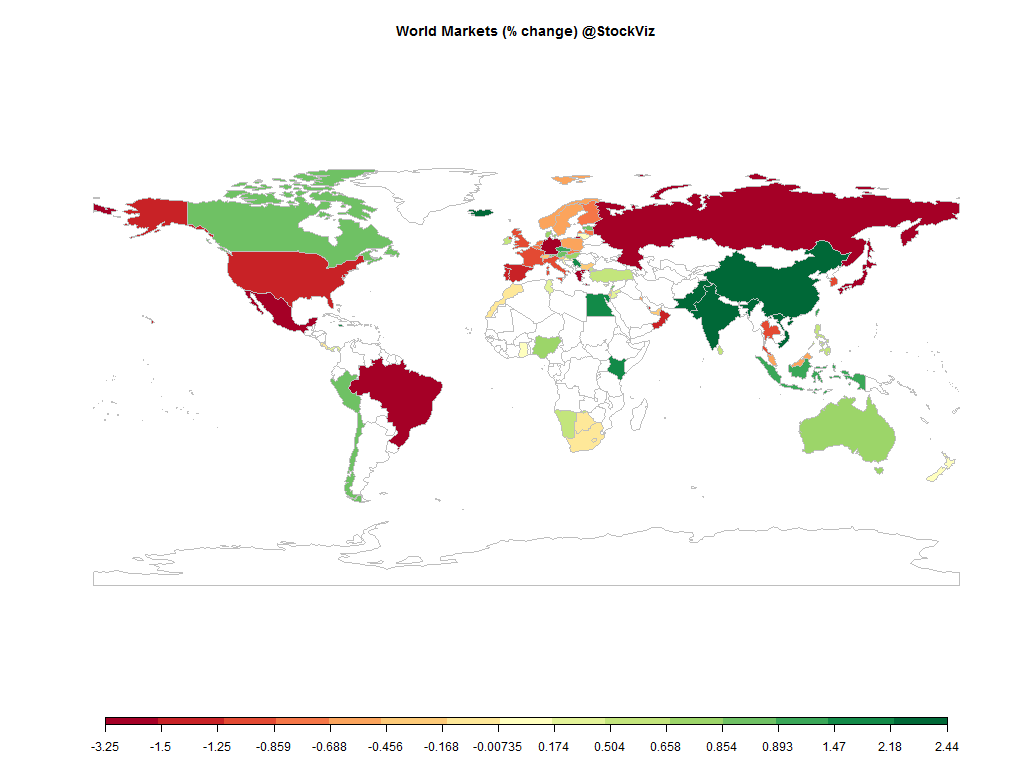
JCI(IDN) | +1.24% |
INMEX(MEX) | -3.10% |
NGSEINDX(NGA) | +6.49% |
XU030(TUR) | +4.75% |
BRICS | |
---|---|
IBOV(BRA) | -3.04% |
SHCOMP(CHN) | +2.51% |
NIFTY(IND) | +0.63% |
INDEXCF(RUS) | +0.24% |
TOP40(ZAF) | +0.71% |
Commodities
Energy | |
---|---|
Brent Crude Oil | -5.20% |
Ethanol | +5.48% |
Heating Oil | -3.27% |
Natural Gas | -8.76% |
RBOB Gasoline | -4.40% |
WTI Crude Oil | -4.07% |
Metals | |
---|---|
Copper | -0.33% |
Gold 100oz | +1.65% |
Palladium | -0.76% |
Platinum | +0.35% |
Silver 5000oz | +8.67% |
Currencies
MINTs | |
---|---|
USDIDR(IDN) | +0.29% |
USDMXN(MEX) | +0.00% |
USDNGN(NGA) | +3.59% |
USDTRY(TUR) | -1.26% |
BRICS | |
---|---|
USDBRL(BRA) | +1.40% |
USDCNY(CHN) | +0.12% |
USDINR(IND) | +0.14% |
USDRUB(RUS) | +1.26% |
USDZAR(ZAF) | -1.62% |
Agricultural | |
---|---|
Cattle | +2.22% |
Cocoa | -2.34% |
Coffee (Arabica) | +4.66% |
Coffee (Robusta) | +2.78% |
Corn | +3.74% |
Cotton | -5.11% |
Feeder Cattle | +0.87% |
Lean Hogs | +4.26% |
Lumber | -2.97% |
Orange Juice | +1.35% |
Soybean Meal | -2.52% |
Soybeans | -0.84% |
Sugar #11 | +1.15% |
Wheat | +9.15% |
White Sugar | +1.63% |
Credit Indices
Index | Change |
---|---|
Markit CDX EM | -0.39% |
Markit CDX NA HY | +0.11% |
Markit CDX NA IG | -1.05% |
Markit CDX NA IG HVOL | +0.05% |
Markit iTraxx Asia ex-Japan IG | -0.64% |
Markit iTraxx Australia | -1.41% |
Markit iTraxx Europe | -1.03% |
Markit iTraxx Europe Crossover | -4.53% |
Markit iTraxx Japan | -3.54% |
Markit iTraxx SovX Western Europe | -1.10% |
Markit LCDX (Loan CDS) | +0.18% |
Markit MCDX (Municipal CDS) | -0.40% |
Nifty Heatmap
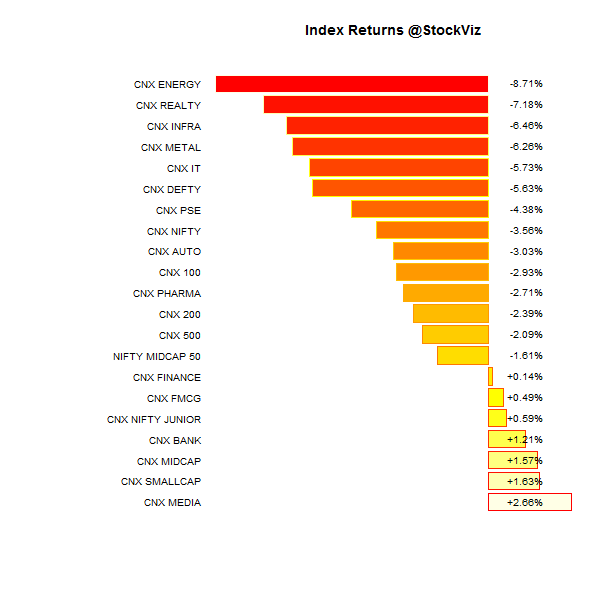
Index Returns
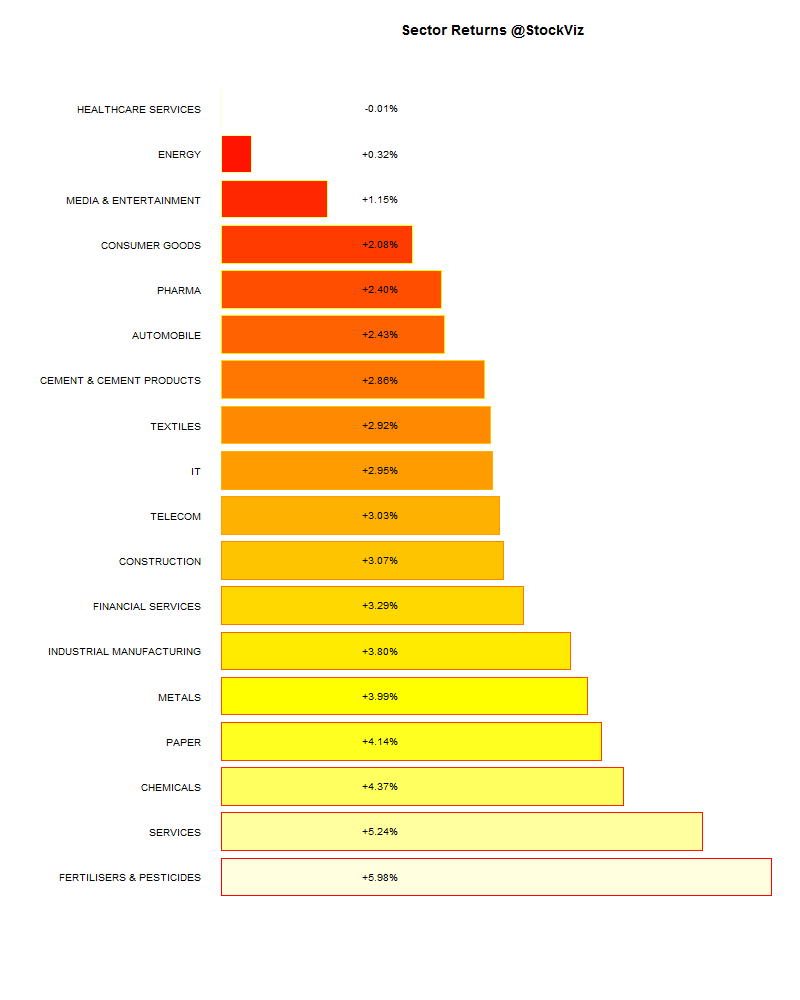
Sector Performance
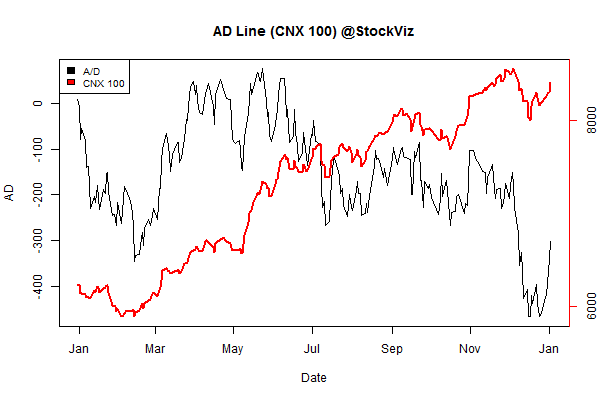
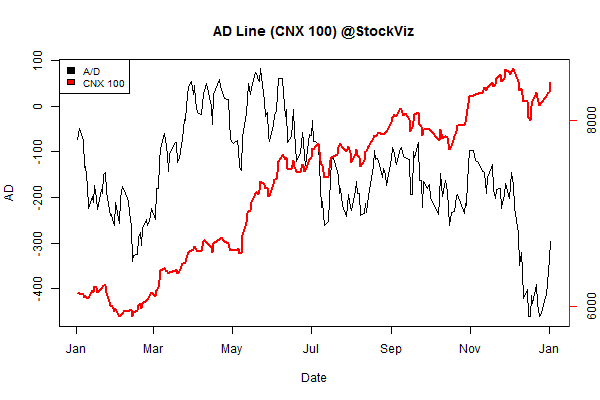
Advance Decline
Market Cap Decile Performance
Decile | Mkt. Cap. | Adv/Decl |
---|---|---|
1 (micro) | +1.36% | 65/73 |
2 | +2.57% | 72/65 |
3 | +1.58% | 70/68 |
4 | -0.78% | 72/65 |
5 | +0.66% | 58/80 |
6 | +0.64% | 76/61 |
7 | +0.95% | 69/69 |
8 | +0.37% | 64/73 |
9 | +1.24% | 69/69 |
10 (mega) | +0.98% | 72/66 |
Top winners and losers
LICHSGFIN | +10.03% |
COLPAL | +11.42% |
INGVYSYABK | +13.41% |
CIPLA | -6.30% |
RCOM | -5.43% |
APOLLOHOSP | -4.58% |
ETFs
JUNIORBEES | +3.32% |
PSUBNKBEES | +3.25% |
BANKBEES | +1.87% |
NIFTYBEES | +0.44% |
GOLDBEES | +0.01% |
INFRABEES | -0.98% |
CPSEETF | -1.01% |
Nifty OI
Bank Nifty OI
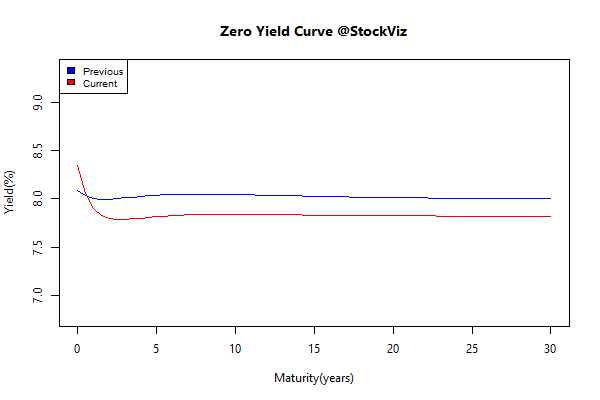
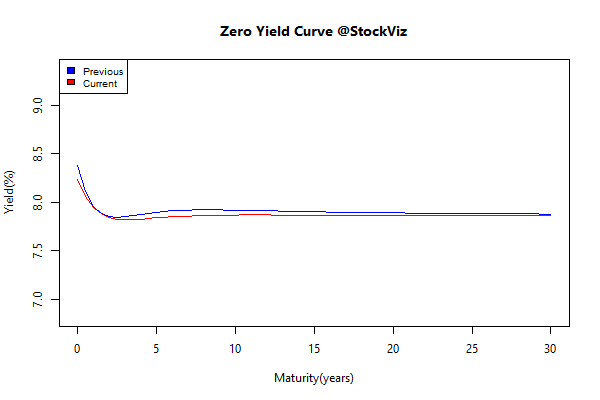
Yield Curve
Bond Indices
Sub Index | Change in YTM | Total Return(%) |
---|---|---|
GSEC TB | +0.17 | +0.11% |
GSEC SUB 1-3 | +0.17 | +0.01% |
GSEC SUB 3-8 | -0.10 | -0.01% |
GSEC SUB 8 | -0.05 | +0.37% |
Theme Performance
Growth with Moat | +6.09% |
Momentum 200 | +4.47% |
The Other Value | +2.92% |
IT 3rd Benchers | +2.57% |
Efficient Growth | +2.06% |
Market Elephants | +2.05% |
CNX 100 50-Day Tactical | +1.87% |
Market Fliers | +1.69% |
Industrial Value | +1.63% |
Quality to Price | +1.55% |
Financial Strength Value | +0.75% |
Old Economy Value | +0.73% |
Auto | +0.67% |
Enterprise Yield | +0.58% |
Momentum Long-Short | +0.00% |
Piotroski ROC Small Caps | -0.11% |
Balance-sheet Strength | -0.16% |
Magic Formula Investing | -0.37% |
Refract: PPFAS Long Term Value Fund | -0.66% |
ADAG Mania | -1.53% |
Thought for the weekend
Lessons and observations from the recent FX scandal:
- Everyone was much more interested in managing the dealing costs that they could see, not the execution quality which they couldn’t.
- Information is currency. But regulators tend to like to work on the assumption of markets in which everyone has exactly the same information set. Paying in information is sometimes cheaper for the client than paying in money.
- The client keeps on bidding the visible cost of trades downward, but isn’t prepared to put in any effort at all on his own part to see what consequences this has.
Source: Oranges, lemons and forex