The VIX index is considered a gauge of fear in the markets. A high VIX entails high option implied volatility and occurs when traders bid up options. Given the recent market turbulence where pretty much all asset classes and equity markets across the board tanked, we wanted to check if VIX indices across markets had any relationship with each other.
VIX since 2009
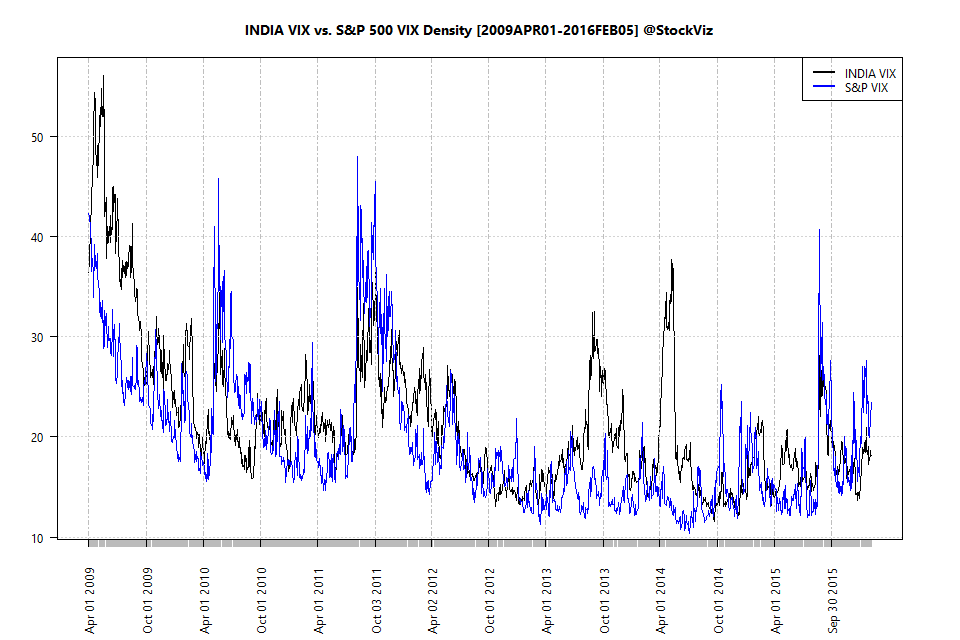
The India VIX index was introduced only in 2009. Let’s start by plotting it vs. the S&P 500 (SPX) Vix to see if it passes a visual sniff test.
We can see at least five instances where India Vix popped without a corresponding move by SPX VIX.
Distribution
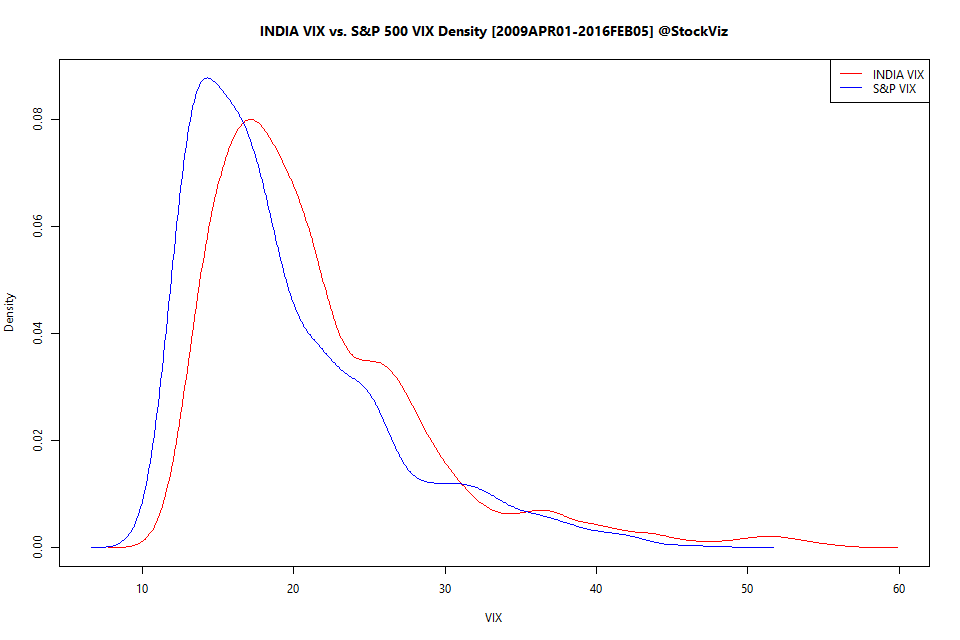
The problem with trying to nail down a relationship between the two indices is that, as one would expect, India VIX is way more dispersed than its SPX counterpart. Here’s the density plot.
India vs. spx vix density plot by year.
They might share the same suffix, but they are two completely different beasts.
Cross-correlation
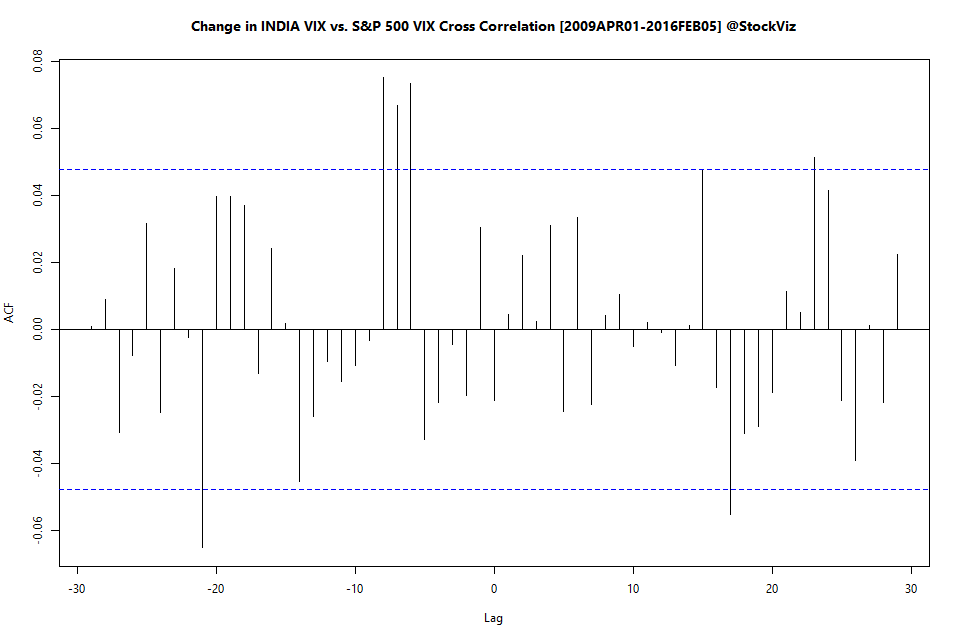
The plots above look at VIX levels. Maybe we should check if the changes in VIX are related. Here’s the cross-correlation plot.
India vix and spx vix cross correlation by year.
Conclusion
We cannot really use the two Vix indices to predict each other’s moves.


