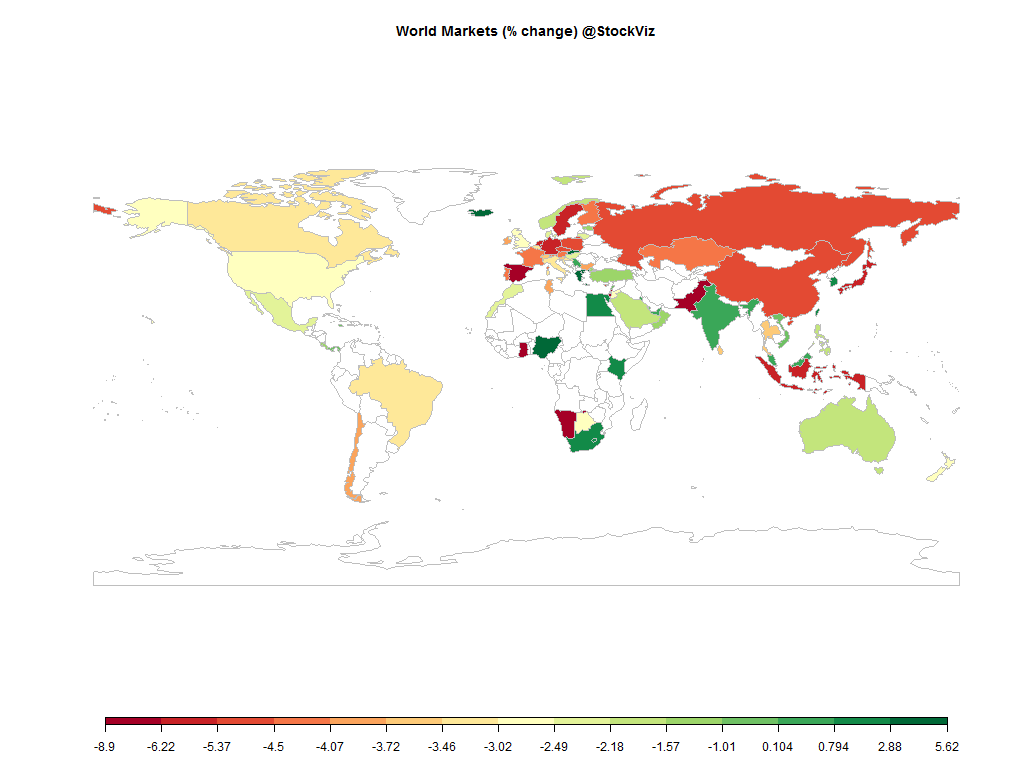
Equities
| MINTs | |
|---|---|
| JCI(IDN) | -5.43% |
| INMEX(MEX) | -2.18% |
| NGSEINDX(NGA) | +5.16% |
| XU030(TUR) | -1.22% |
| BRICS | |
|---|---|
| IBOV(BRA) | -3.23% |
| SHCOMP(CHN) | -4.78% |
| NIFTY(IND) | +0.24% |
| INDEXCF(RUS) | -5.20% |
| TOP40(ZAF) | +1.20% |
Commodities
| Energy | |
|---|---|
| Brent Crude Oil | -8.90% |
| Ethanol | +4.85% |
| Natural Gas | -5.45% |
| RBOB Gasoline | -15.74% |
| WTI Crude Oil | -5.77% |
| Heating Oil | -7.15% |
| Metals | |
|---|---|
| Gold 100oz | -1.51% |
| Platinum | -9.61% |
| Copper | +2.15% |
| Silver 5000oz | -0.68% |
| Palladium | +8.89% |
Currencies
| MINTs | |
|---|---|
| USDIDR(IDN) | +4.31% |
| USDMXN(MEX) | +1.02% |
| USDNGN(NGA) | +0.17% |
| USDTRY(TUR) | +3.91% |
| BRICS | |
|---|---|
| USDBRL(BRA) | +8.66% |
| USDCNY(CHN) | -0.34% |
| USDINR(IND) | -1.38% |
| USDRUB(RUS) | +2.21% |
| USDZAR(ZAF) | +4.24% |
| Agricultural | |
|---|---|
| Coffee (Arabica) | +0.21% |
| Wheat | +6.04% |
| Coffee (Robusta) | -1.52% |
| Orange Juice | -18.53% |
| Soybean Meal | -4.62% |
| White Sugar | +8.38% |
| Cattle | -13.66% |
| Lumber | -3.66% |
| Soybeans | -0.61% |
| Cocoa | +2.59% |
| Corn | +5.98% |
| Cotton | -7.19% |
| Feeder Cattle | -11.86% |
| Lean Hogs | +7.97% |
| Sugar #11 | +20.58% |
Credit Indices
| Index | Change |
|---|---|
| Markit CDX EM | -2.28% |
| Markit CDX NA HY | -2.05% |
| Markit CDX NA IG | +7.87% |
| Markit iTraxx Asia ex-Japan IG | +2.50% |
| Markit iTraxx Australia | +9.68% |
| Markit iTraxx Europe | +13.38% |
| Markit iTraxx Europe Crossover | +66.06% |
| Markit iTraxx Japan | +5.91% |
| Markit iTraxx SovX Western Europe | -2.27% |
| Markit LCDX (Loan CDS) | +0.00% |
| Markit MCDX (Municipal CDS) | +0.97% |
A painful month for the markets finally came to an end with a relief rally. Chinese rebalancing away from an investment driven economy to a consumption driven one is forcing a new economic world order. And just when things seemed to be improving in Europe, the Volkswagen scandal hit and dragged everybody down. Investors seem to have quit pretty much every risk-asset…
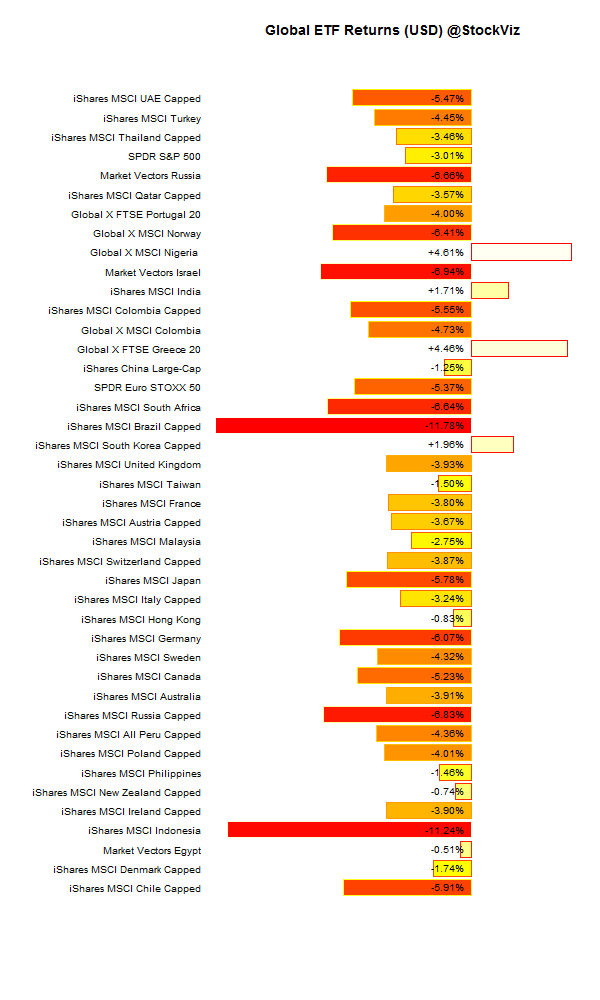
International ETFs
This gives you an idea of how widespread the carnage was. India was one of the few markets that managed to end September in the green.
Gold
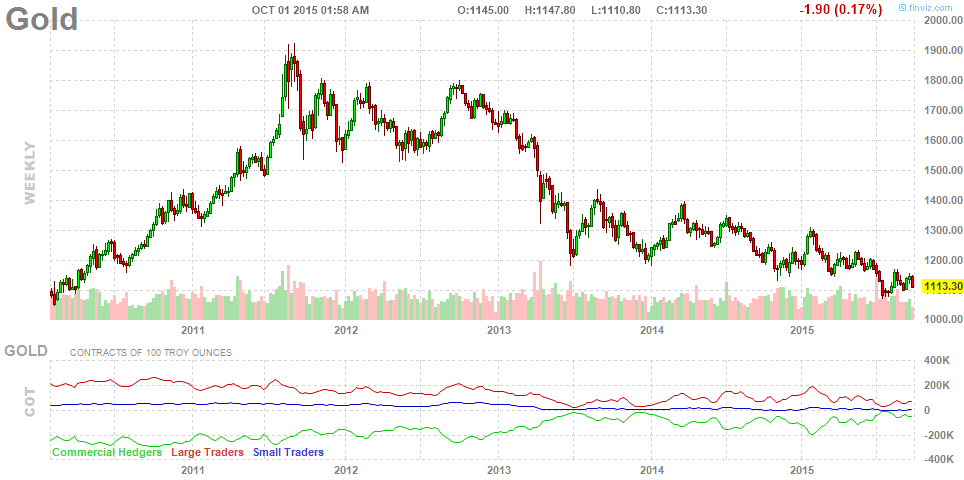
US rate hike jitters has pushed precious metals down for most of this year. With 2010’s hyper-inflation fears morphing into 2015’s deflation, gold has seen a massive sell-off…
Oil
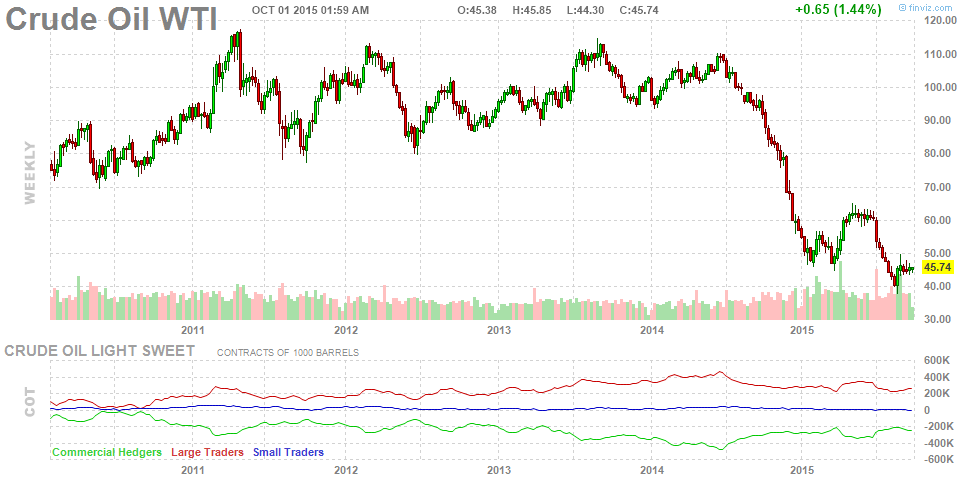
Saudi’s kept the pump running, hoping to drive US shale operators out of business. But slowing global growth and an appreciating US Dollar might have had a bigger impact on oil prices…
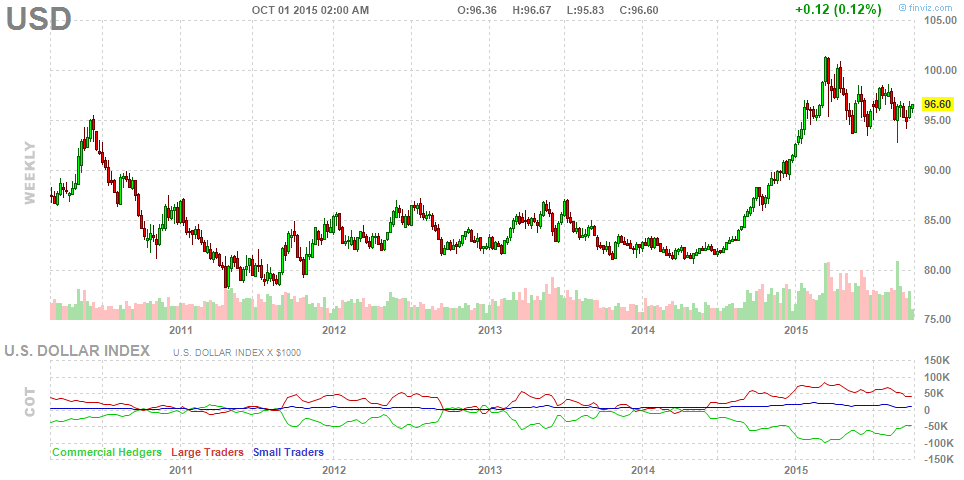
US Dollar
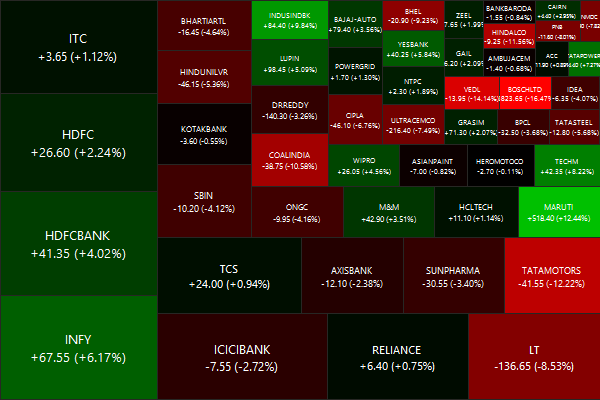
Nifty Heatmap
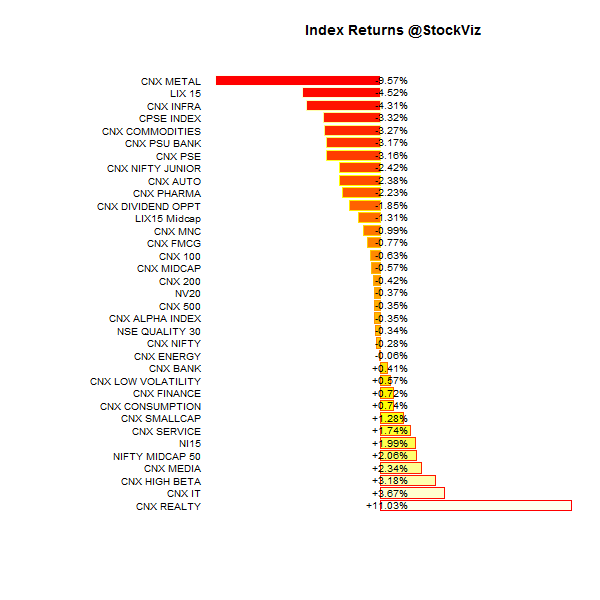
Index Returns
Market Cap Decile Performance
| Decile | Mkt. Cap. | Adv/Decl |
|---|---|---|
| 1 (micro) | -1.65% | 68/63 |
| 2 | -0.57% | 71/59 |
| 3 | -1.01% | 61/69 |
| 4 | +0.97% | 64/67 |
| 5 | +0.84% | 68/62 |
| 6 | -2.22% | 60/71 |
| 7 | -1.06% | 63/68 |
| 8 | +1.48% | 62/68 |
| 9 | +0.03% | 67/64 |
| 10 (mega) | -2.04% | 64/67 |
Large caps bore the brunt of the selloff…
Top Winners and Losers
| SRTRANSFIN | +13.78% |
| RPOWER | +14.67% |
| RELCAPITAL | +19.59% |
| MOTHERSUMI | -24.10% |
| BHARATFORG | -22.29% |
| BOSCHLTD | -16.47% |
Auto stocks got shellacked because nobody knows how deep the Volkswagen scandal runs…
ETF Performance
| BANKBEES | +0.16% |
| NIFTYBEES | -0.82% |
| GOLDBEES | -1.82% |
| JUNIORBEES | -2.38% |
| CPSEETF | -3.21% |
| PSUBNKBEES | -4.22% |
| INFRABEES | -6.32% |
Hopefully, the 50bps rate cut will breathe some life into these…
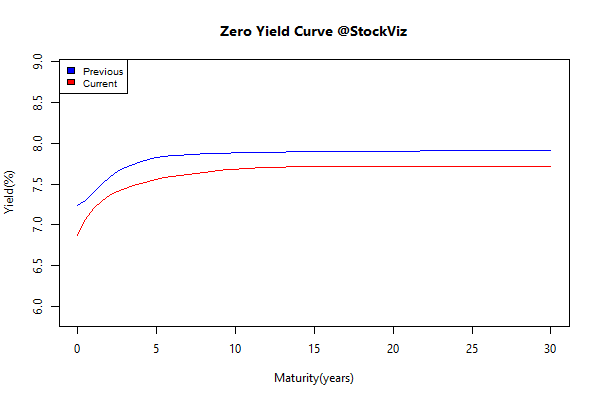
Yield Curve
Bond Indices
| Sub Index | Change in YTM | Total Return(%) |
|---|---|---|
| 0 5 | -0.28 | +1.35% |
| 5 10 | -0.23 | +1.85% |
| 10 15 | -0.15 | +1.77% |
| 15 20 | -0.21 | +2.54% |
| 20 30 | -0.20 | +2.77% |
Bonds rallied on the back of rate cuts. Is the bulk of the move done?
Investment Theme Performance
| ADAG stocks | +12.21% |
| Momentum | +3.94% |
| High Beta | +3.69% |
| CNX 100 Enterprise Yield | +1.53% |
| Magic Formula | +1.26% |
| Quality to Price | +0.77% |
| Balance Sheet Strength | -0.63% |
| Financial Strength Value | -0.91% |
| PPFAS Long Term Value | -0.94% |
| The RBI Restricted List | -1.07% |
| Tactical CNX 100 | -1.58% |
| ASK Life | -3.01% |
| Low Volatility | -3.71% |
| Next Trillion | -6.57% |
A mixed bag…
Equity Mutual Funds
Bond Mutual Funds
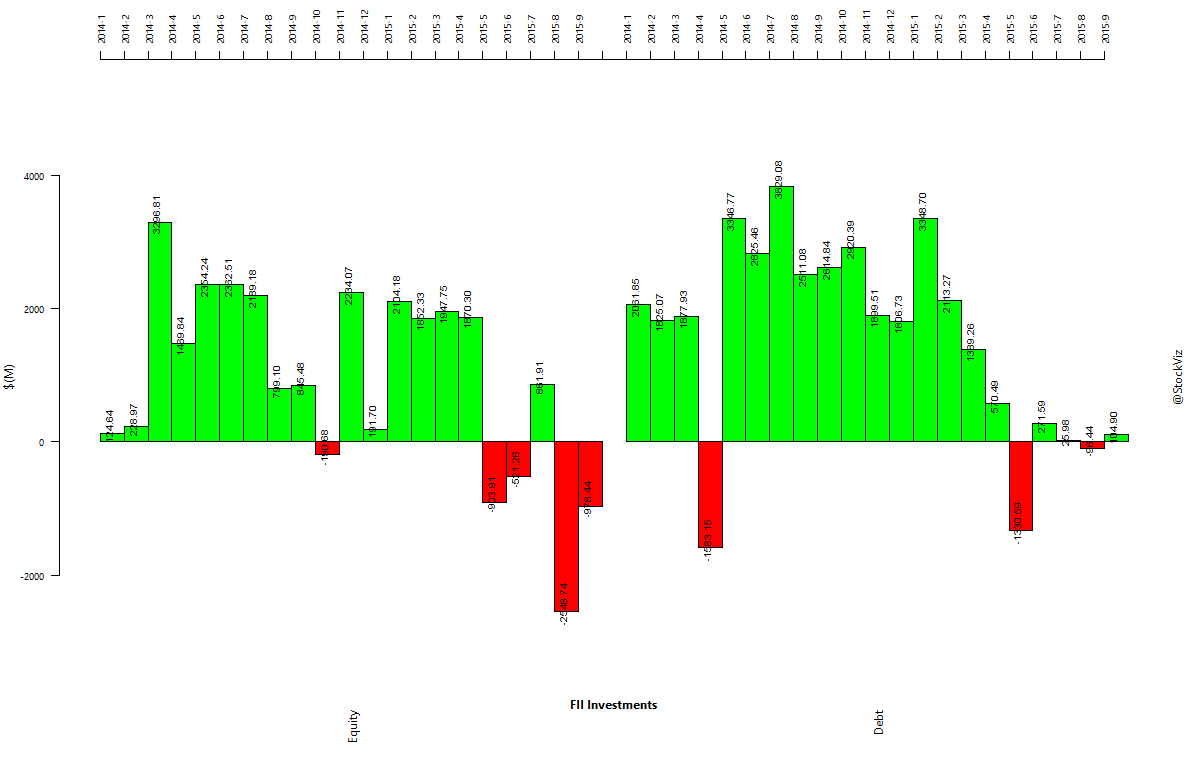
Foreign Institutional Investments
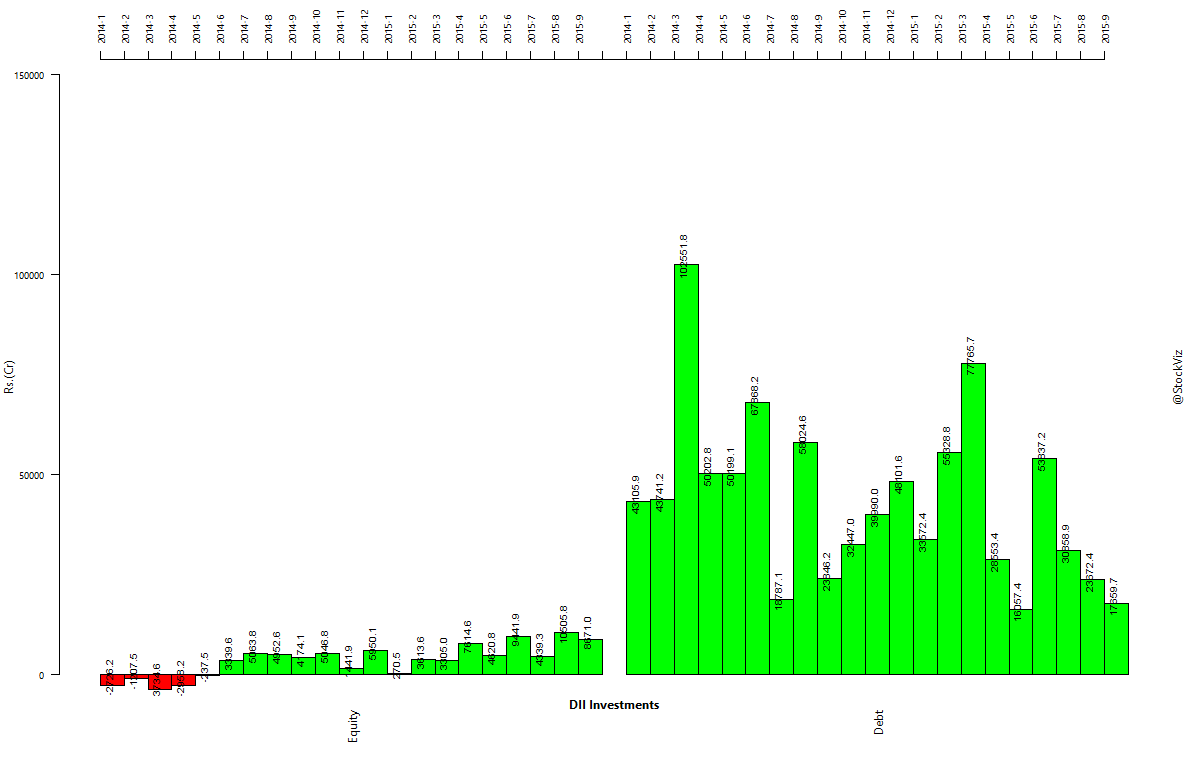
Domestic Institutional Investments
Thought to sum up the month
There are four types of investment returns:
- Consistently bad.
- Mostly bad and occasionally good.
- Mostly decent and occasionally good.
- Consistently good and fraudulent.
Look at the long-term history of great investors, and you’ll find they occupy the third category.
Source: Good Investing Hurts
