Introduction
Our previous post discussed how a simple SMA On/Off Switch based tactical algo can be enhanced by a volatility metric. We generated significant alpha by following a simple rule:
But what if we trained a machine on the same data and allowed it to decide when to go long and short?
Support Vector Machines
We fed an SVM our volatility metric and the percentage distance from 50-day SMA. A 5-year training set was used to predict the next year daily long/short. We will not delve into the details of how SVMs work, Wikipedia does a decent job introducing the concept.
Performance
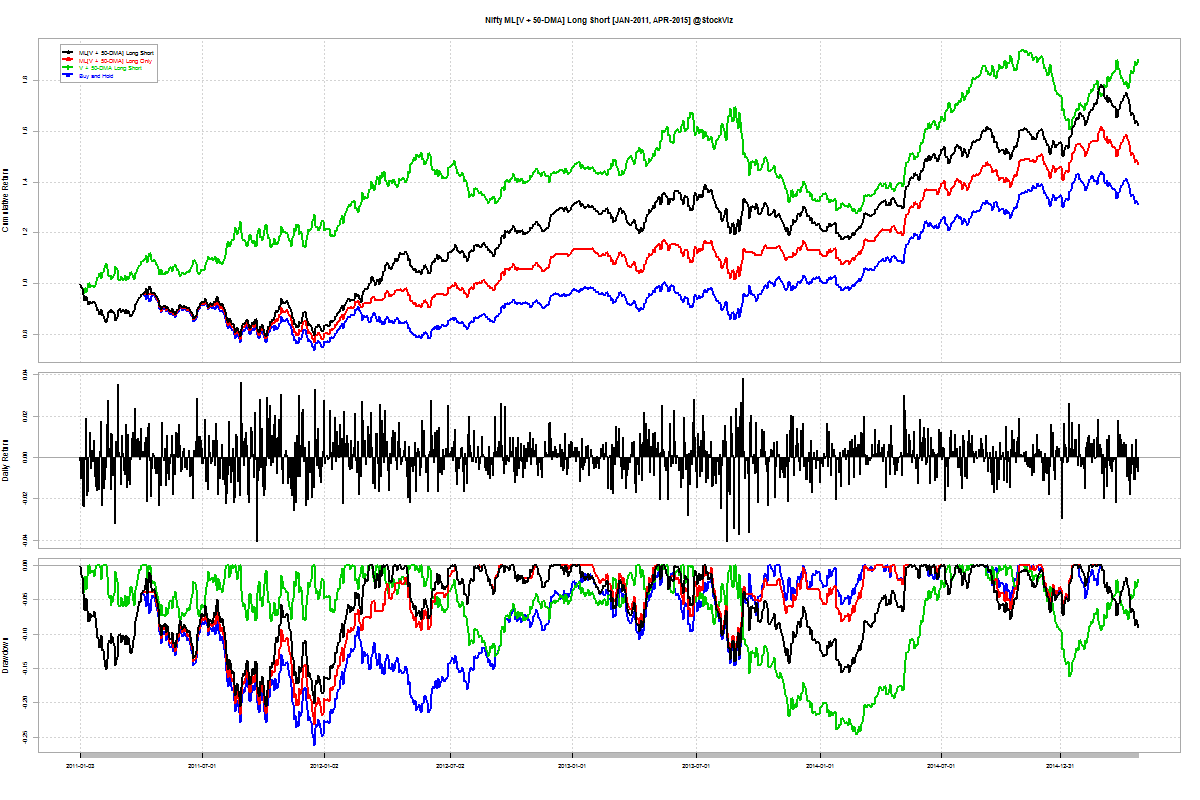
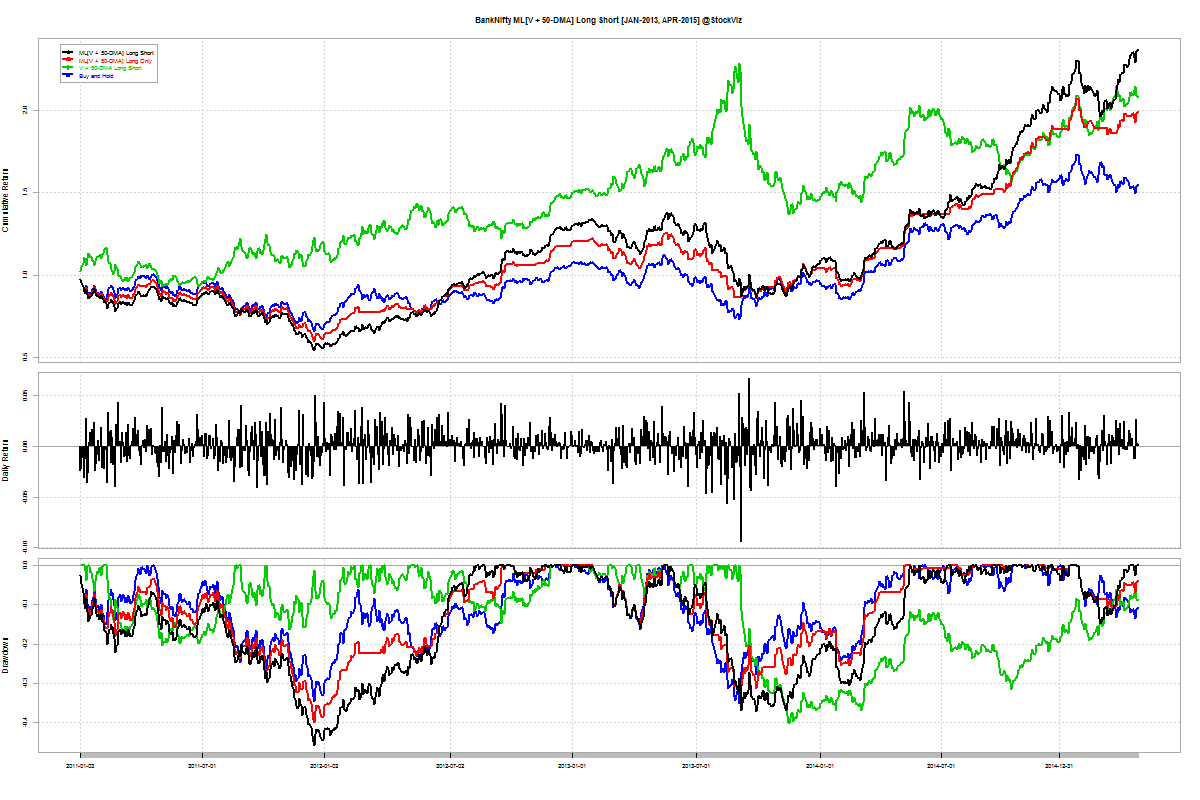
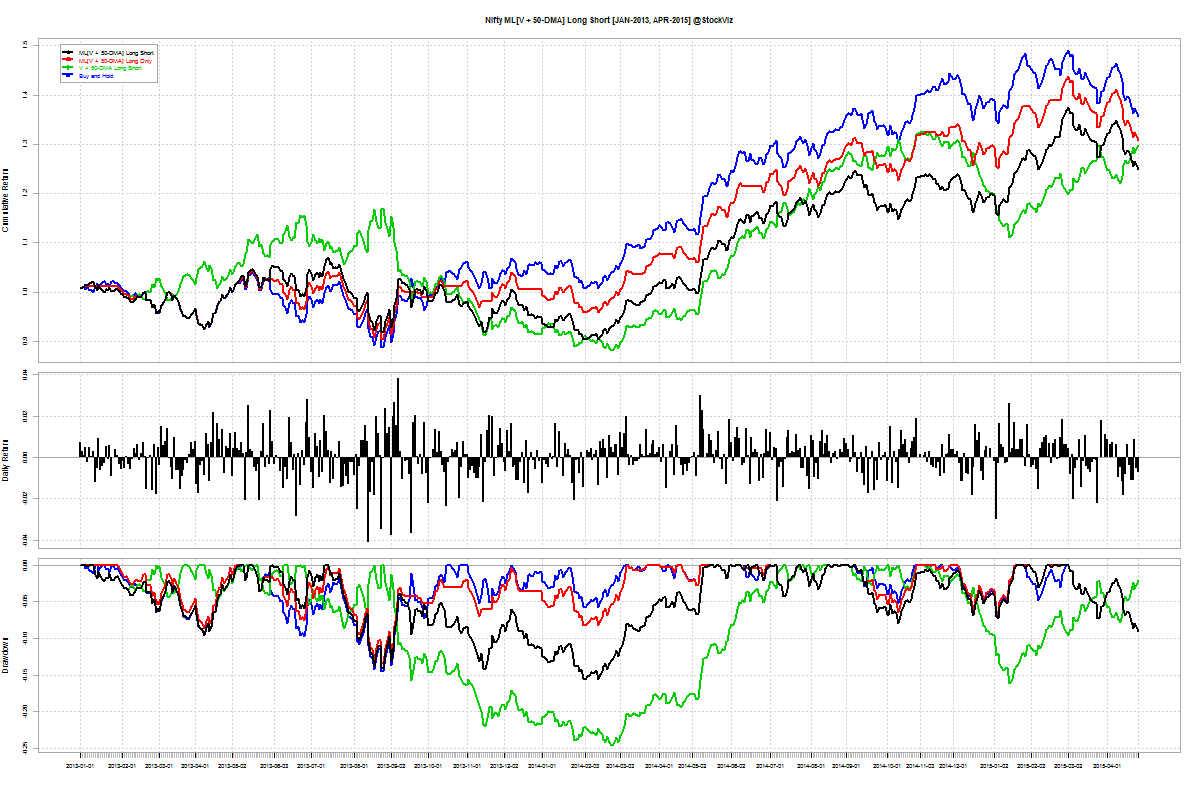
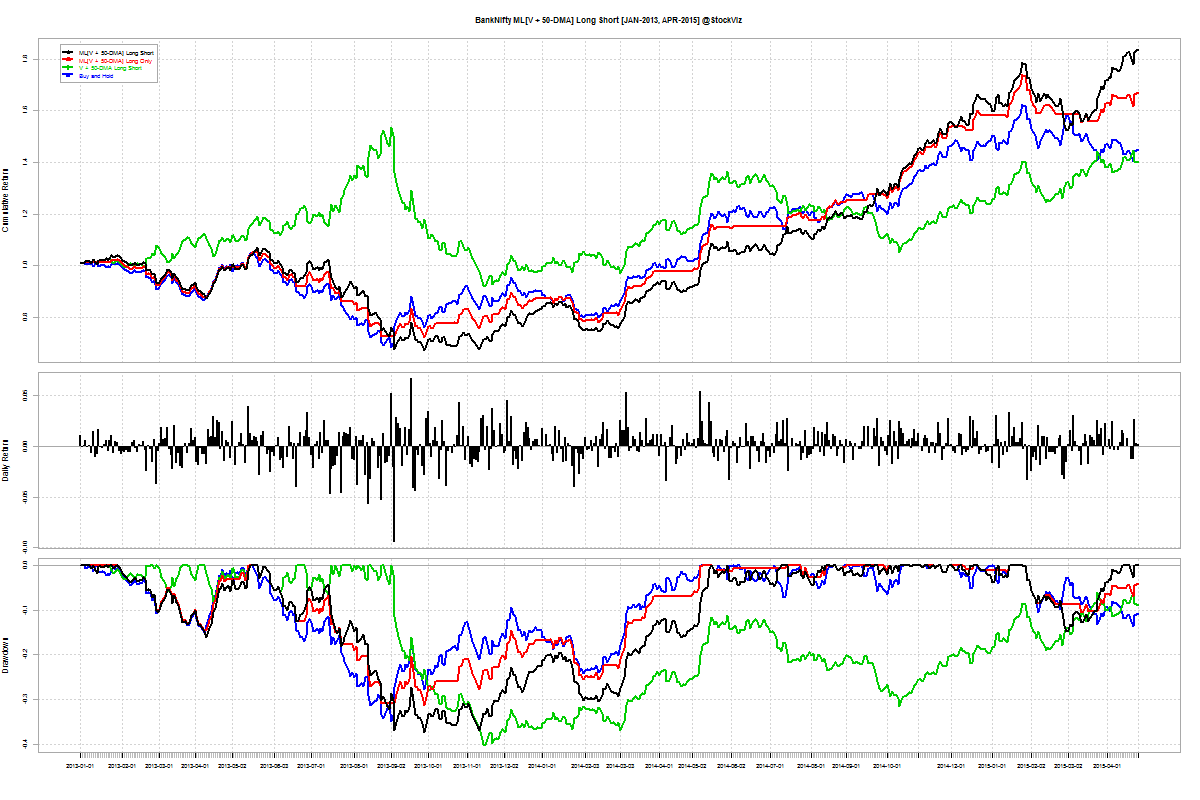
To make it easier to compare, we plot the wealth-charts for the NIFTY and BANKNIFTY indices side-by-side.
The black line is the Machine Learning Long-Short Model and the blue line is buy-and-hold. NIFTY and BANKNIFTY since 2011:
NIFTY and BANKNIFTY since 2013:
Cumulative Returns
Buy-and-hold has two big advantages over a trading strategy: transaction costs and tax treatment. Here is how the different strategies compare with buy and hold:
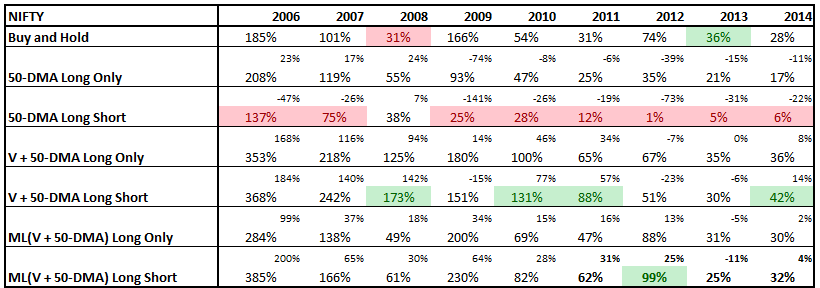
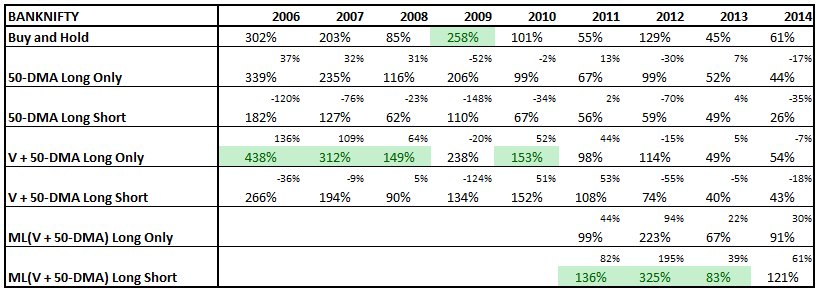
It appears that the ML(V + 50-DMA) Long Short strategy works better on the BankNifty than on the Nifty. The out-performance of the ML model on the BankNifty more than compensates for transaction costs and taxation.
Conclusion
The ML model outperformed the NIFTY by an average of 12% in the last 4-years and the BANKNIFTY by 94% in the same period. The out-performance on the BANKNIFTY is considerable enough to warrant further exploration.