If I were Flipcart, I would sell!
Amazon set to launch services in India next year – The Times of India.
Invest Without Emotions
If I were Flipcart, I would sell!
Amazon set to launch services in India next year – The Times of India.
There are three categories of price patterns that yield profitable signals.
This signal is given when the market price level penetrates the extension of a straight line drawn through successive troughs (in a rising market) or successive peaks (in a falling market).


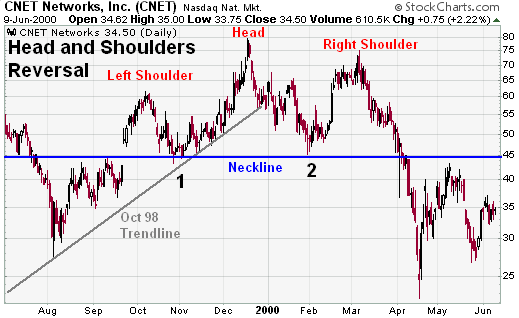 The H&S formation is similar in shape to a silhouette of a person’s head and shoulders. In the case of a top formation, the ‘left shoulder’ is formed by the period of price weakness just prior to the market moving to a new high; the ‘head’ is formed by the new high itself; and the ‘right shoulder’ is formed by a period of price strength just after the new height. The base of both the left and right shoulder occur at roughly the same price levels – you can draw a ‘neckline’ between the two. A sell signal is generated when prices penetrate the neckline.

A trading signal is generated when the price bounces away from a particular level at least twice. At market peaks, such a pattern is called the double top.
This is one of a series of posts reviewing The Psychology of Technical Analysis by Tony Plummer.

A few big themes:
via Facebook Investor Roger McNamee Explains Why Social Is Over.
The truth is that India is in no position to become a superpower. It is not a rising power, nor even an emerging power. It is merely a fascinating, complex, and perhaps unique experiment in nationhood and democracy, whose leaders need still to attend to the fault lines within, rather than presume to take on the world without.
 Financial markets exhibit crowd behaviour. A crowd is a dynamic system. A dynamic system can be expressed as a system of spirals. Hence, it follows that if we can identify the presence of an unstable cycle in price movements, we should be able to calculate the precise price targets. The life cycle of a positive shock goes something like this: the initial market reaction that establishes a new trend or the resumption of an old one, a reversal under a spiral mechanism and finally, a jump in a dynamic move. The final jump is 2.618 (the Golden Ratio) times the length of the last wave of the base pattern that precedes it.
The actual shape of a price pulse will be distorted by higher-order trends. However, in practice, any price movement subdivides into there phases: the first two phases constitute either a top or base pattern. The third phase consists of a dynamic impulse wave. Subsidiary fluctuations occur because this three-wave pattern is repeated at all levels of the hierarchy.
This is one of a series of posts reviewing The Psychology of Technical Analysis by Tony Plummer.
