Category: Uncategorized

Trend-following Strategies on MCP Server

We have added two new trend-following strategies to our Mutual Fund MCP server. They track midcap and small cap indices.

  1. Indian MF Tactical Midcap (tactical-midcap)

    • Frequency: Daily
    • Rule: Holds midcap equity when the NIFTY Midcap 150 TRI is above its 20-session SMA; otherwise holds an overnight fund.
    • Benchmark: NIFTY Midcap 150 TRI
    • Coverage: March 2017–October 2026
    • Current allocation: Nippon India Overnight Fund — Direct Growth
  2. Indian MF Tactical Smallcap (tactical-smallcap)

    • Frequency: Daily
    • Rule: Holds smallcap equity when the NIFTY Smallcap 250 TRI is above its 50-session SMA; otherwise holds an overnight fund.
    • Benchmark: NIFTY Smallcap 250 TRI
    • Coverage: April 2023–October 2026
    • Current allocation: Nippon India Overnight Fund — Direct Growth

The same strategies are being currently run using ETFs: Tactical MIDCAP 150 and Tactical SMALLCAP 250. We ran a few scenarios on how their returns would look like under different brokerage slabs and if implemented through mutual funds.

Fun fact: because of the way mutual fund transactions work, you are better off not switching to overnight funds when the SMA exits equities. Cash works better because if there is a whipsaw the next day, you can get long fast.

The deep dives for midcaps and smallcaps are on github.

Analysis: PFIZER

Today’s pick is [stockquote]PFIZER[/stockquote]. The stock has been range-bound between the 1100 to 1350 levels since last December. The stock is currently trading close to its 52 weeks low of 1100. In the last three month period, the stock moved -10% Vs + 5% as that of Nifty’s.

image

Oscillators RSI and CMO are at currently at 37 and -27 are hovering around the over-sold territory but are not suggesting any direction.

MACD line and the signal line are moving very close to each other since a long time and are not suggesting any trend.

The GMMA chart is not suggesting any up-move in the long term as well.

image

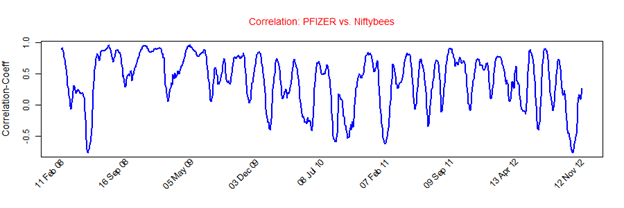
PFIZER’s average correlation of 0.40 with the Nifty is positive. The stock will not replicate the movements of Nifty closely because of the low co-efficient. [stockquote]NIFTYBEES[/stockquote]

image

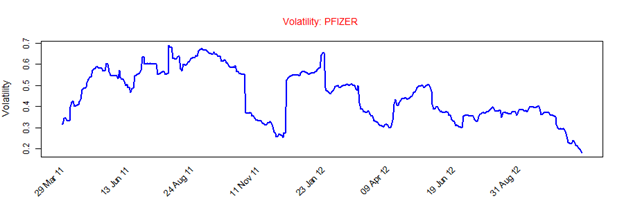
PFIZER has a historical volatility in the range of 0.2 to 0.7. The scrip’s volatility is currently at the lowest point of the range and hence should not be a concern.

Looking at these technicals a short-term buy is suggested upon a decisive MACD cross-over. A break-out of the range in either direction will trigger a longer-term call.

Enhanced by Zemanta