Category: Investing Insight

Investing insight to make you a better investor.

Daily Momentum

Daily Momentum and New Investors in an Emerging Stock Market (SSRN) describes the trading behavior of Chinese retail investors.

Our study finds that daily returns, instead of monthly returns, display price momentum and attributes it to the trading behaviors of new investors using account-level transaction data.

Apparently, most new entrants to the market in China take a very short-term punt on whatever worked on the day. They go on to study a bunch of DM and EM markets and its worth a read.

The interesting bit is that Indian investors don’t chase daily momentum. In fact, for an equal-weighted “buy the best performing quintile and hold till tomorrow’s close” strategy, after transaction costs and taxes, there’s nothing left, on average.

The median average next-day return of the 5th quintile (highest return) is 0.30%, before slippage.

Also, buying the worst performers did no better either.

Intraday Volatility

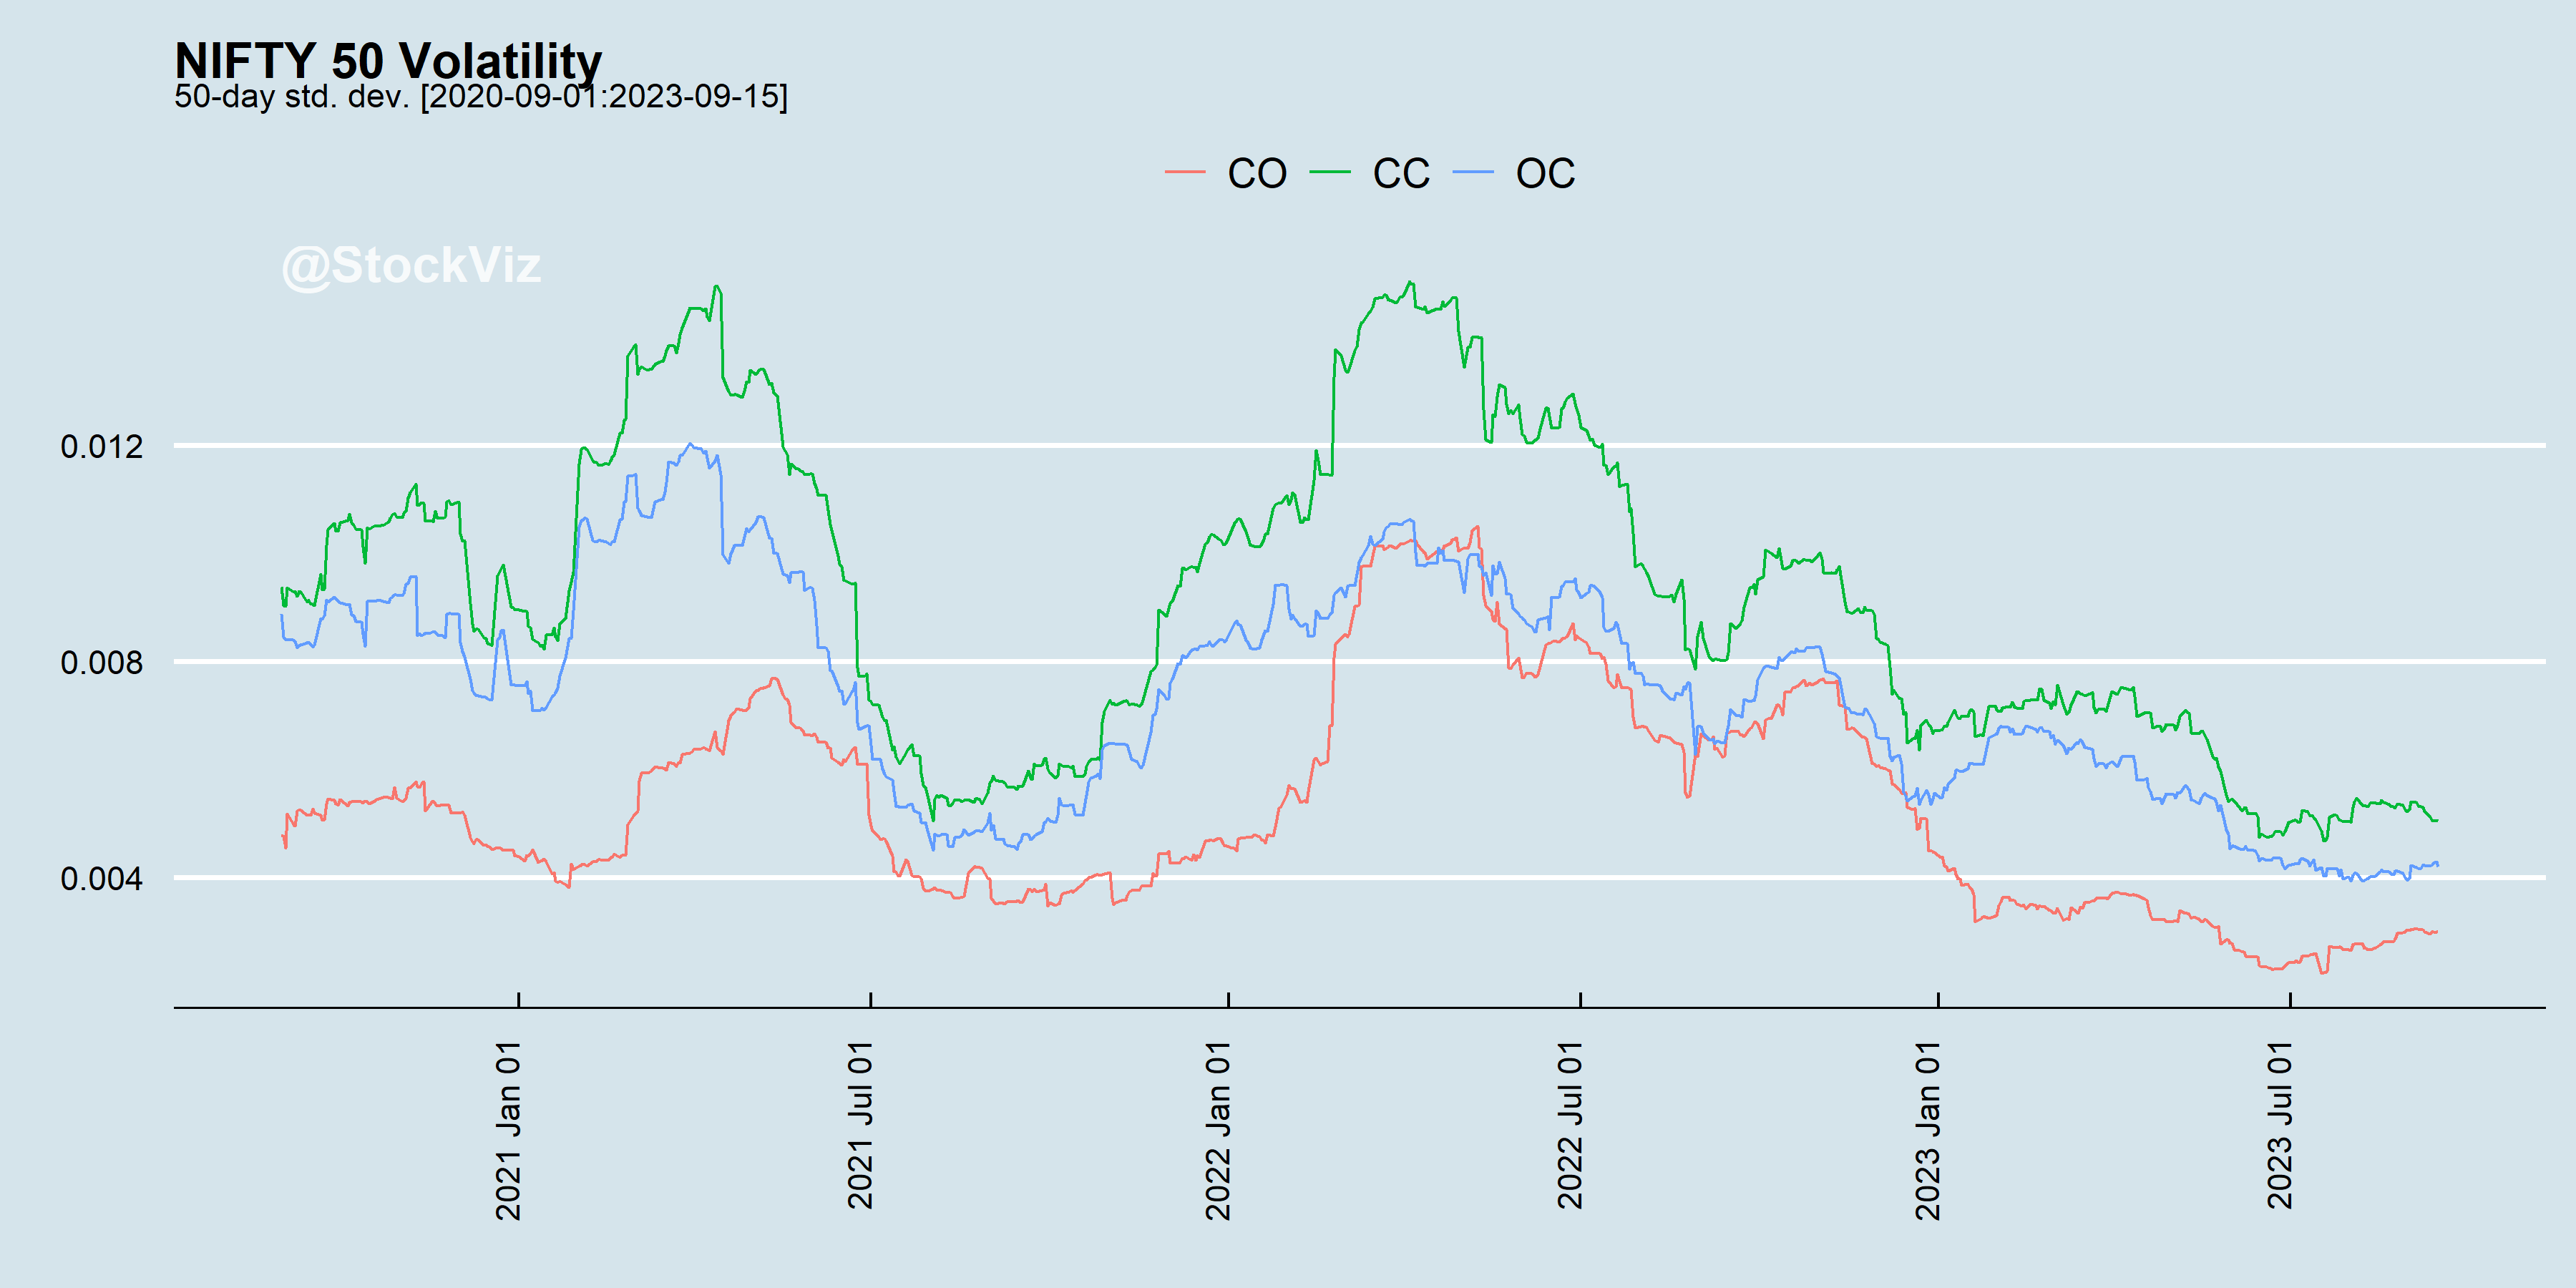
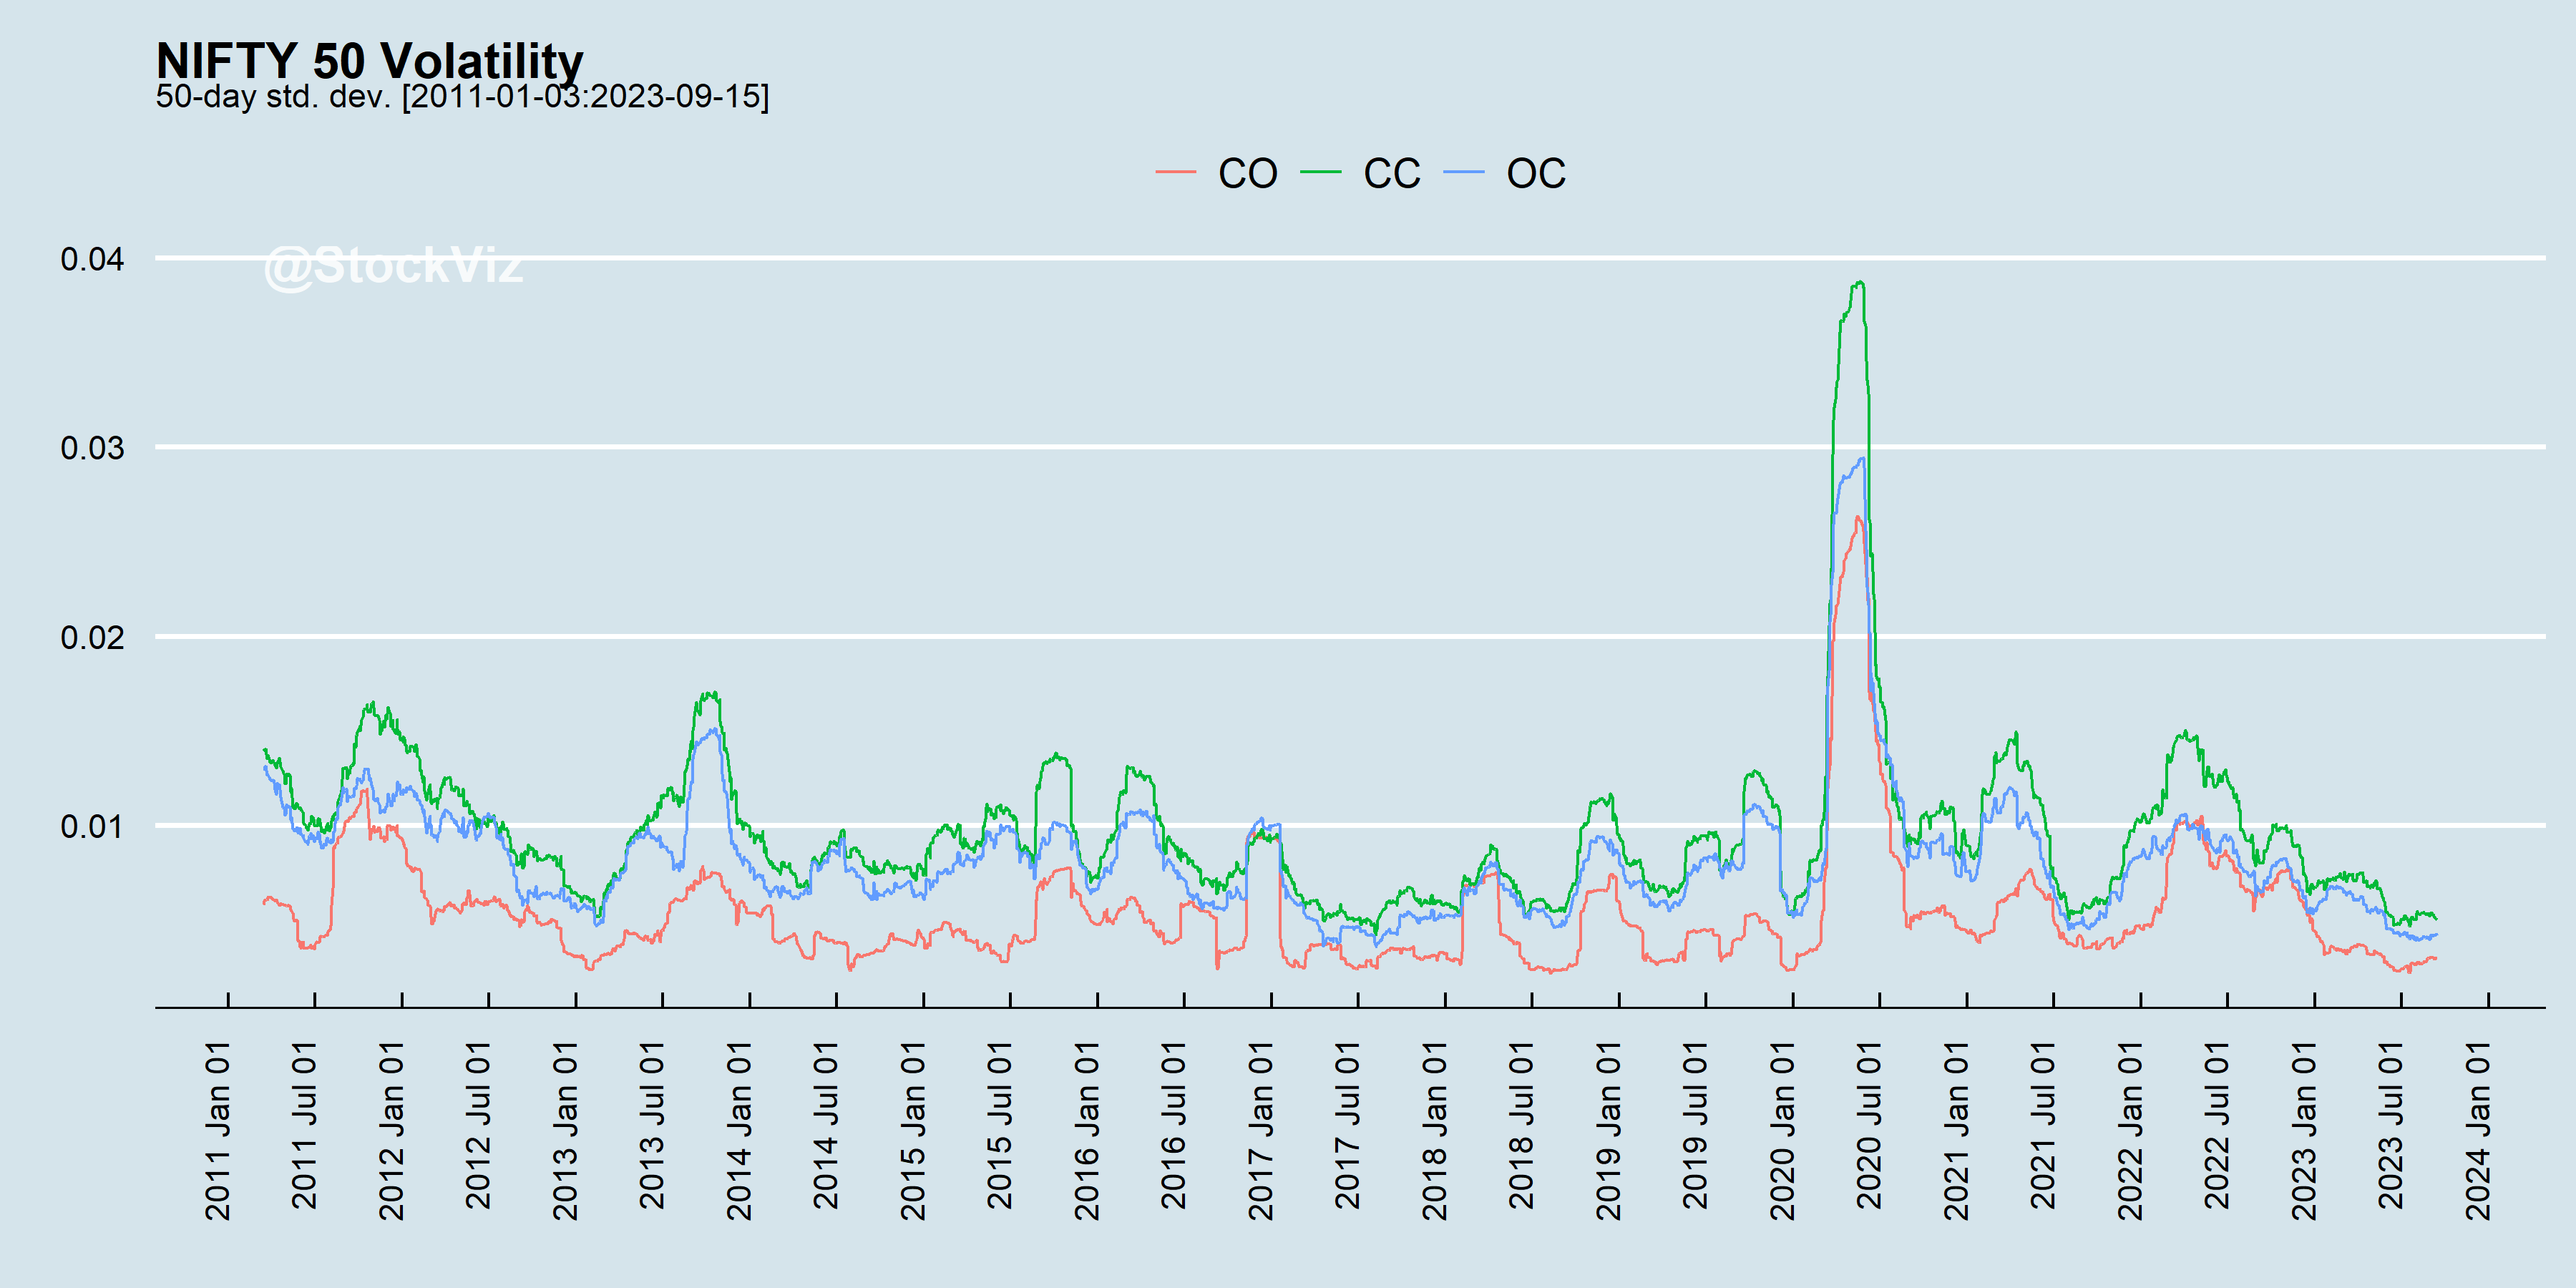
Realized Semi-variance is a measure of intraday volatility. It is nothing more than the sum of squared high-frequency positive and negative returns.

It is typically used for forecasting volatility. However, can it be used for market timing? After all, volatility is said to be sticky and avoiding downside volatility is supposed to be desirable.

What if, you exit the market when the current volatility is more than the historical average (based on some lookback)?

Turns out, doing something like that would’ve worked on the pre-pandemic NIFTY 50. Maybe not higher returns but better Sharpe than buy & hold.

However, post-pandemic returns have been disappointing.

The same thing can be observed on the MIDCAP 50 index as well.

We’ll add this to the growing pile of disappointing results of using volatility for directional bets.

Volatility Lookbacks

Volatility is calculated over a time period – the lookback. While developing a strategy, it is typical to try a range of lookbacks and pick one that looks reasonable for the strategy being built. However, is there an “ideal” lookback period?

This is where a volatility signature plot comes into the picture. It is typically used in high frequency trading but there is no reason not to use it on a lower frequency time series.

If you plot the distribution of volatility over different lookbacks, this is how it looks:

Ideally, you want the box to be small, the median in the middle and the wicks to be short. After all, if you are using volatility to drive a strategy, if the distribution of volatility itself is too wonky, then how do you trust the output?

Correlation Timing

The previous post discussed how high correlation environments have fat left-tails. Can correlation states be used for timing?

A quick look suggests that it might not be possible. Both LO (long-only) and LS (long-short) strategies that use the correlation state seem to underperform buy-and-hold.

There was some “crisis alpha” in using correlation for timing during the COVID crash of 2020. However, Buy & Hold ruled the roost both before…

… and after things normalized.

The slightly better drawdown performance of LO in some circumstances might be interesting for levered investors but the unlevered returns of these timing strategies are not much to write home about.

Correlation vs. Returns & Volatility

The previous post presented historical NIFTY 50 constituent pair-wise correlation distributions and discussed how high correlation environments persist. How do the 5th-quintile return and volatility look like?

If you focus on the 5, 10 and 20-day pair-wise correlations (T5, T10 & T20), you’ll see large left-tailed returns and high volatility in the 5th quintile compared to the others (1st, 2nd, 3rd & 4th).

Looking at this the other way, T10 – the 10-day pairwise correlation – has this profile:

It looks like if you dodge the 5th quintile here, you might be able to boost returns in linear strategies.