Author: shyam

StockViz Tools

Compare and Plot multiple time-series datasets

Ever wondered how the dollar adjusted NIFTY MIDCAP 100 index performed vs. US Midcaps? Wonder no more! You can now quickly run a comparison using our new Compare tool.

compre time-series

We have made a large number of datasets available:

NASDAQOMX The NASDAQ OMX TR USD Dataset
MF A pruned set of Indian mutual funds
FRED The St. Louis FRED dataset
THEME StockViz Themes
IN_NSE Indices available on the NSE
IN_BSE Indices available on the BSE
ETF_US US listed ETFs
EQ_US US listed Stocks
EQ_NSE Stocks listed on the NSE
EQ_BSE Stocks listed on the BSE
MCX Commodity futures listed on MCX
NCDEX Commodity futures listed on NCDEX

The “THEME” comparison tools also gives you the impact of STT and brokerage costs on returns.

So, now you can compare pretty much anything with everything.

When it comes to plotting a single time-series, we have made intraday prices on stocks listed on the NSE available. You can run these 10-days at a time:
chart time-series

The daily chart of NSE stocks also marks important corporate actions:
TCS daily time-series candle-stick with corporate actions

Keeping it free

The biggest challenge we faced was managing data storage costs. Earlier, we tried to upload all the data to the cloud but we quickly ran into performance bottlenecks and costs overruns. So we went back to the drawing board and designed a hybrid solution where the data and the analytics reside within our firewalls and only results are displayed to the user. This allows us to keep these tools free and open to everybody.

I want more!

If you want to see something here that would be of interest to other investors/traders, please WhatsApp us (+918026650232) with your ideas!

Book Review: The Attention Merchants

In The Attention Merchants: The Epic Scramble to Get Inside Our Heads (Amazon,) author Tim Wu walks us through how the advertising industry evolved from its patent medicine roots to the current mess of privacy invading ad exchanges.

Advertising is primarily about gaining a person’s attention. The medium through which this is done has evolved from posters and billboards to newspapers and magazines to tv and internet. The media is the aggregator of attention – their principle goal is to draw people in and then sell their attention to the highest bidder. But how do you measure attention? How do you know if someone watched your ad? Or, for that matter, should watch your ad? What are the boundaries of one’s privacy?

What struck me was that as the stakes kept getting higher, so did the degree of invasion into our head-space. We are now at a point where the vast majority of websites you visit are sending your data to third-party sources, usually without your permission or knowledge.

For every two eyes looking at a screen there are probably ten or more looking back at them.

And it is no longer just your “digital” footprint.

Did you know that there are now billboards that can track you by your phone’s wifi?

All WiFi-capable devices broadcast a unique ID – a Media Access Control (MAC) address – when they’re looking for networks (and so long as WiFi is enabled, they’re always looking for networks). So if you walk around carrying a mobile phone with WiFi turned on, you’re broadcasting your own, unique radio beacon, and it’s easy to track your movements.

Scary stuff.

Recommendation: Worth a read.

Book Review: Mistakes Were Made (But Not by Me)

Mistakes Were Made (But Not by Me): Why We Justify Foolish Beliefs, Bad Decisions, and Hurtful Acts by Carol Tavris (Amazon,) shows how we self-justify the mistakes we make, blame it others and perpetuate a destructive cycle.

Almost all of us carry an image of ourselves that we are smart, and basically good. When me make decisions that lead to poor outcomes, it conflicts with this internal image. This dissonance, if left unchecked, is resolved by self-justification. And so, unconsciously, we create fictions that absolve us of responsibility, restoring our belief that we are smart, moral, and right – a belief that often keeps us on a course that is dumb, immoral, and wrong.

As investors, we aim to have “strong convictions that are weakly held.” But it is easier said than done. Even though we know to follow scientific process, while faced with disconcerting evidence, we tend to double down – “having the courage of one’s convictions.”

It is part of the scientific attitude to change one’s beliefs once they are discredited. Well, it’s not an easy thing to do. Combine invested time, invested money, high hopes, high expectations, and a relative amount of pride, and you’re up for quite a challenge when confronted with contradicting evidence.

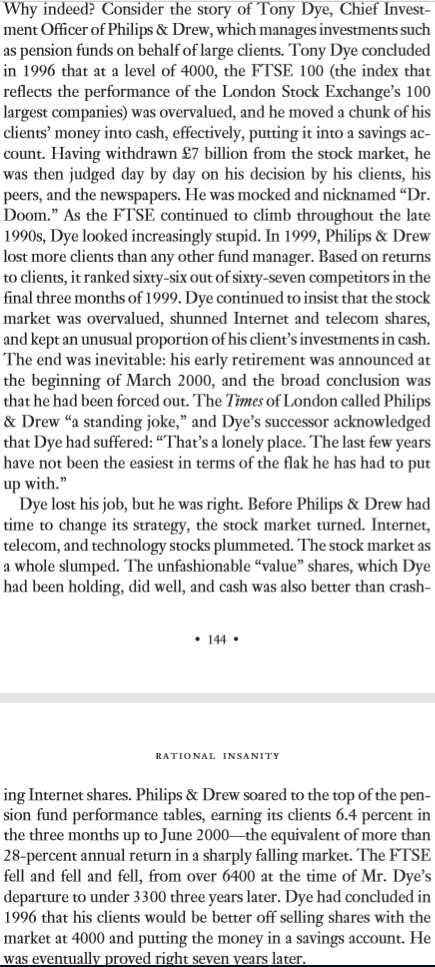
In investing, there are examples where both “sticking to ones guns” and “be like water, my friend” have worked. Here’s an example of the former: Tony Dye (from the Undercover Economist) stuck to his guns, lost his job, but was eventually proven right.

And as an example of why you shouldn’t stick to your guns: The Half-Life of Investment Strategies

And when you are wrong, even the best of us try to reduce dissonance by blaming somebody else: This Angry Stock Picker Says Trump Tweets Are Hurting His Investments

How do you change your mind?

Recommendation: Worth a read.

Tax Drag on Compounding

The long-term capital gains tax on equity returns of 10% may not seem as much but it makes a huge difference if you are one of those “long-term” mutual fund investors who switch funds every year. To think through the effect of the tax on compounded returns, imagine a simple scenario where you invest in the midcap index and just sell and buy it back at the end of every year. In this hypothetical scenario, from the year 2002 through now, gross returns of buy-and-hold would have been 2245% vs. 1754% after tax. That’s ~22% of profits gone poof.

after tax midcap 100 returns

Will mutual fund investors be better behaved given this new normal?

Code and more charts on github.

Simple Momentum with Transaction costs and Taxes

The earlier post on a simple momentum strategy ignored transaction costs and taxes. Typically, these are added to backtests where gross profits are high enough to consider them for further analysis. However, one of readers requested that we add these costs to get an idea of their effect on returns.

To keep things simple, we assumed a 25bps net transaction cost and a 10% tax on gains. The tax part is a bit tricky so we ran the analysis with some simplifying assumptions. Follow the github link to the code if you are curious.

Running with these assumptions, transaction costs and taxes lopped 82% off gross returns over Jan 2005 through June 2018.

cumulative midcap 100 simple momentum strategy returns after transaction costs and taxes

What kills you are the taxes, not the transaction costs. There were only 17 trades throughout the period. It is the 10% tax on gains that ruins the compounding.

Code and other charts are on github. Look for ones with a ‘tx’ in the suffix.