Tag: bonds

Trend-following Bonds

Does trend following work on bonds? According to alphaarchitect, it should. However, they use data going back to 1928 and we wanted to look at something more recent. Also, we wanted to check if it worked for Indian bonds?

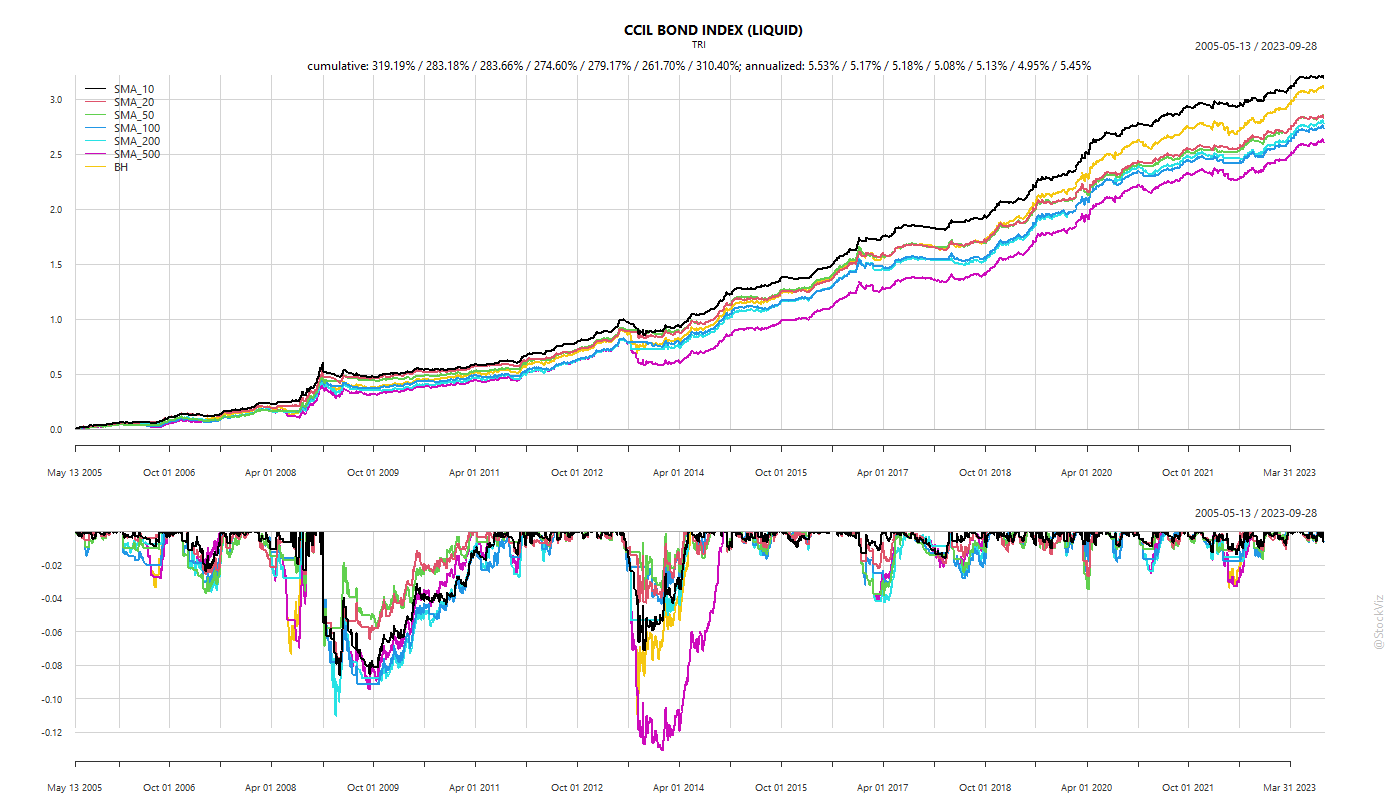
For Indian bonds, you are better off buying and holding. Once you consider transaction costs and taxes, there is no benefit.

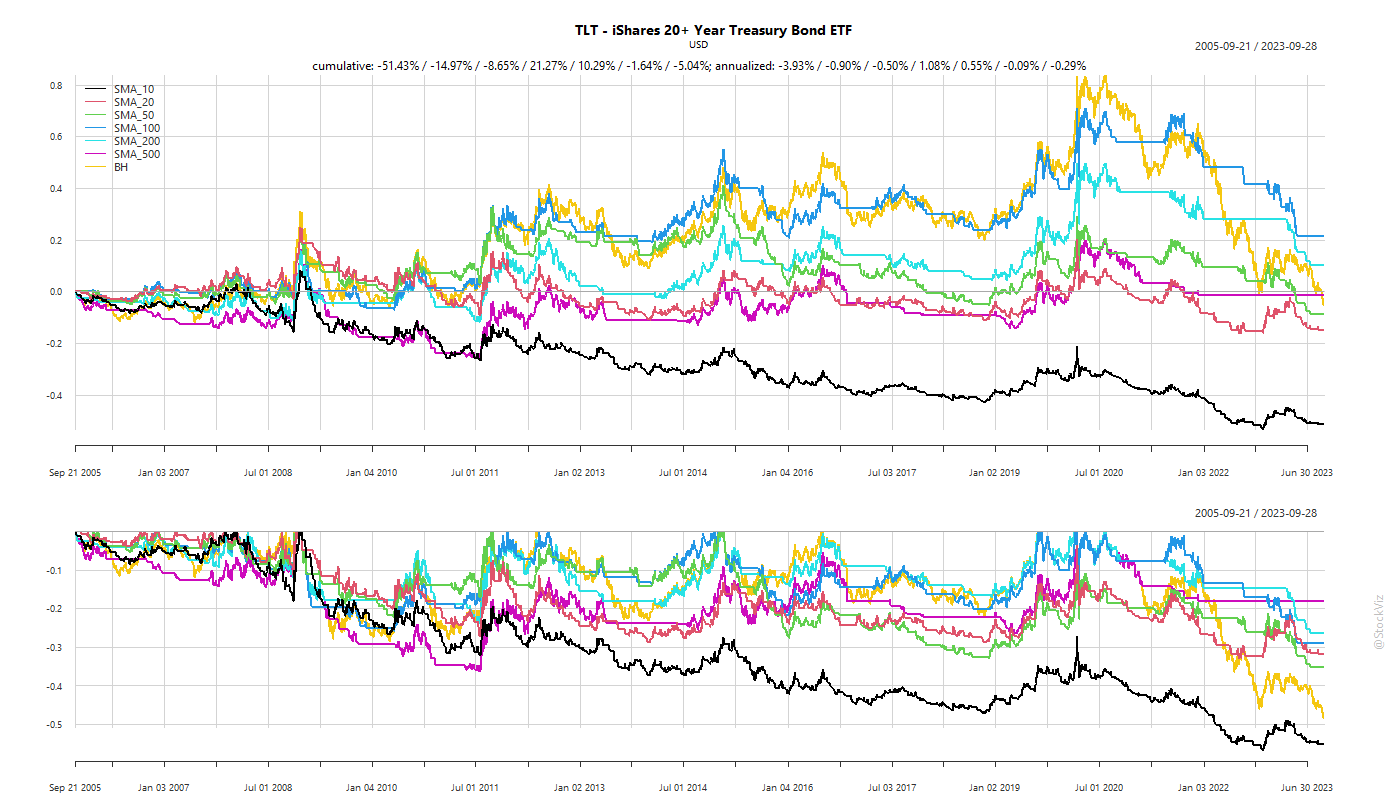
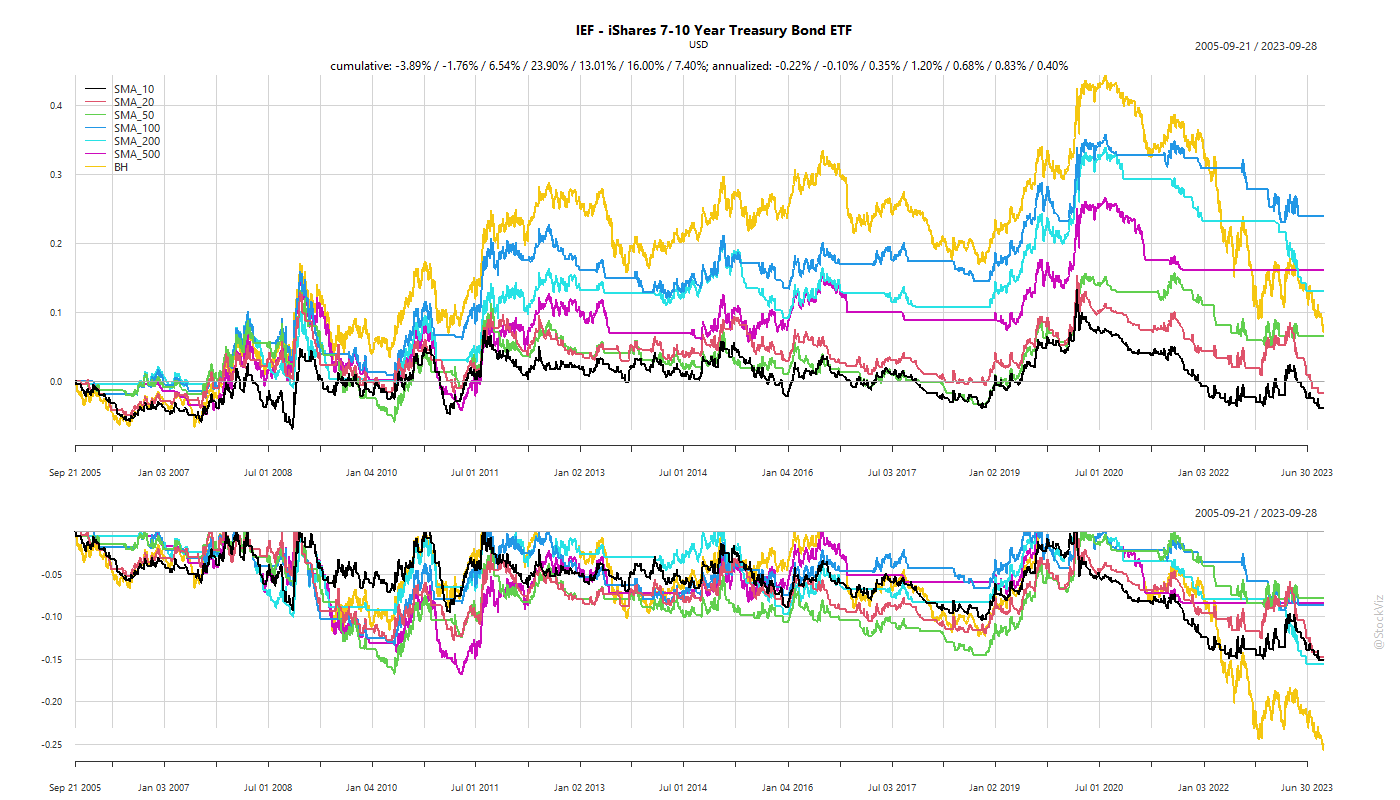
For US, we ran the same SMA scenarios on the TLT (20+), IEF (7-10), SHY (1-3) and AGG etfs. There is some benefit to applying a 100-day SMA filter on the first three. However, the after-cost benefits are questionable.

Code and charts on github.

EM Bonds out-performed EM Equities the last decade

A recent article in WSJ had this to say about emerging market bonds:

Research on hard-currency bonds since Britain and Prussia defeated France at the Battle of Waterloo in 1815 shows that on average the return from lending to governments issuing external debt in sterling or dollars delivered a return close to U.S. stocks, with lower volatility.

EM bonds giving better returns than US stocks seems counter-intuitive. There is an ETF that tracks the bond index that the article talks about: EMB – iShares JP Morgan USD Emerging Markets Bond ETF. The ETF was launched on December 2007 (not during the Battle of Waterloo,) so we cannot really put that claim to test. However, here are the last 10-years for EMB, EEM (iShares MSCI Emerging Markets ETF) and SPY (SPDR S&P 500 ETF Trust):
ETF.EMB-EEM-SPY.cumulative returns

EM bonds beat EM equities, but not US stocks (SPY). US mega-caps pretty much beat every other equity market. Here are the MSCI indices of USA, WORLD ex US and EM:
USA, WORLD ex-USA, EM cumulative returns

Can’t really single out EM for under-performance when everything trailed. Besides, if you look at performance since 1987, aggregate returns from EM have been on par with those of US with complementary periods:
USA, WORLD ex-USA, EM cumulative returns

So, should you ditch your EM equities portfolio and get into EM bonds and US stocks? Some analysts could look at a decade of EM equity under-performance, point to its valuation spread vs. US mega-caps, and conclude that EMs are a better place to be for the next decade. While others could point out that the US is the home to most of the world’s biggest tech monopolies so it deserves the out-performance. We will only know who is right once 2030 rolls in. Until then, diversify your portfolio and enjoy your life.

Code and annual return charts are on github.

An Equity, Bond and Gold Portfolio

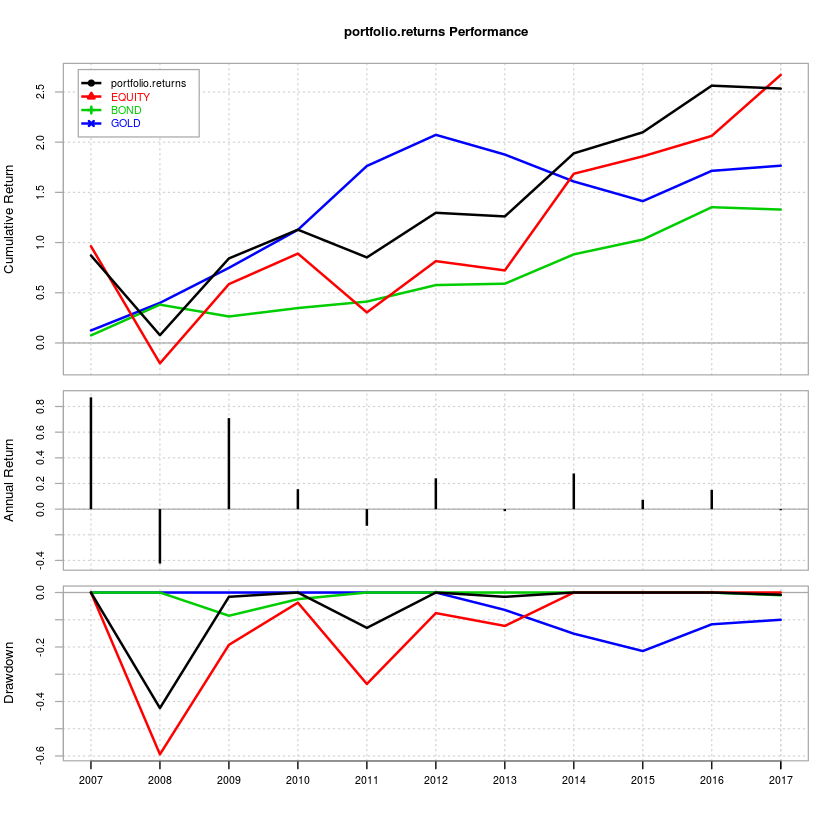
How did diversification across Midcap equity, bonds and gold work out for Indian investors over the last 10 years? Not too shabby, as it turns out:

Combined portfolio – Annualized: 12.16%; Max drawdown: -42.42%
Gold only portfolio – Annualized: 9.69%; Max drawdown: -21.49%
Equity only portfolio – Annualized: 12.55%; Max drawdown: -59.39%
Bond only portfolio – Annualized: 7.99%; Max drawdown: -8.52%
*Not including transaction charges/taxes.

The Setup

  • Annual rebalance.
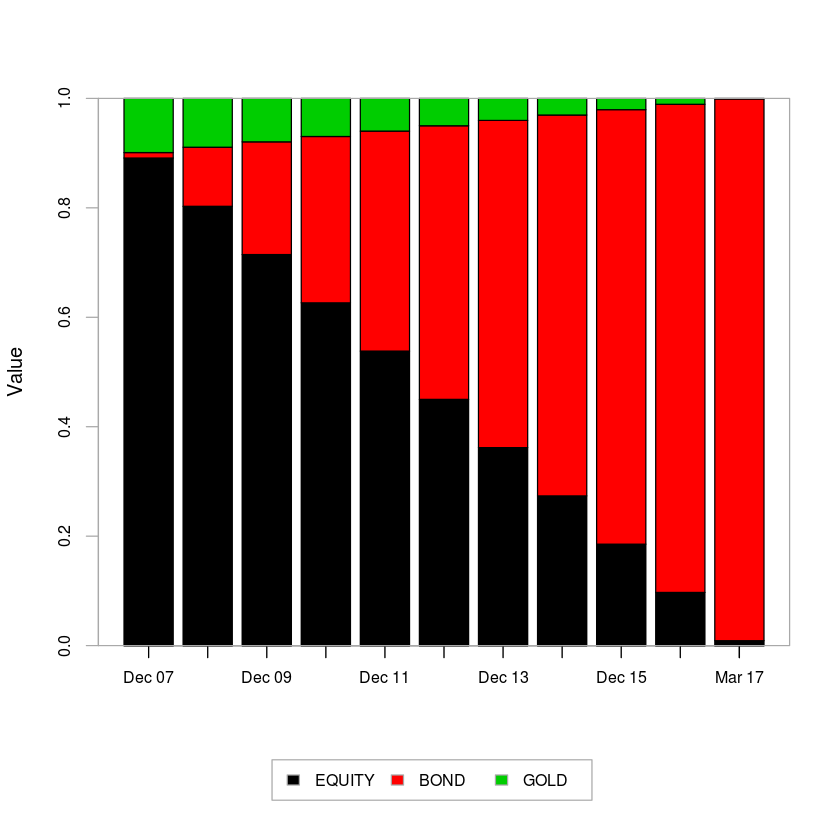
  • Bonds start at 1%, the rest is divided between Gold (10%) and Equities.
  • The total return index for the 5-10 year tenure published by CCIL is used as a proxy for Bonds.
  • The MID100 FREE index is used as a proxy for Equities.
  • The GOLDBEES ETF is used as a proxy for Gold.
  • Period under observation: 2007-04-01 through 2017-03-31.

The idea is that you start with mostly Equity and Gold in the portfolio and rebalance at the end of every year so that at the end of 10 years, you end up with mostly Bonds.

Returns

Notice the drawdown of the equity vs. that of the portfolio. You end up with similar returns but with lower volatility.

If you remove Gold from the equation and go with only Equity and Bonds:

Combined portfolio – Annualized: 11.38%; Max drawdown: -49.90%
Equity only portfolio – Annualized: 12.55%; Max drawdown: -59.39%
Bond only portfolio – Annualized: 7.99%; Max drawdown: -8.52%

Even though a diversified, rebalanced portfolio makes sense on the surface, the tax treatment on Gold and Bonds make an annual rebalance an expensive affair.

Code and detailed results are on Github.

Investing in Gold

The almighty dollar

Although India and China account for a bulk of world gold consumption, the price of gold continues to be set in London and New York. When you buy gold in India, you are exposed to two things:

  1. The dollar price of gold.
  2. The USD/INR exchange rate.

Even at times when the price of gold goes down in dollar terms, if the rupee goes down more, then you still have a profit in your hands. This partly explains why Indians are crazy about gold – it is the easiest way to get short the rupee.

Dollar returns of gold

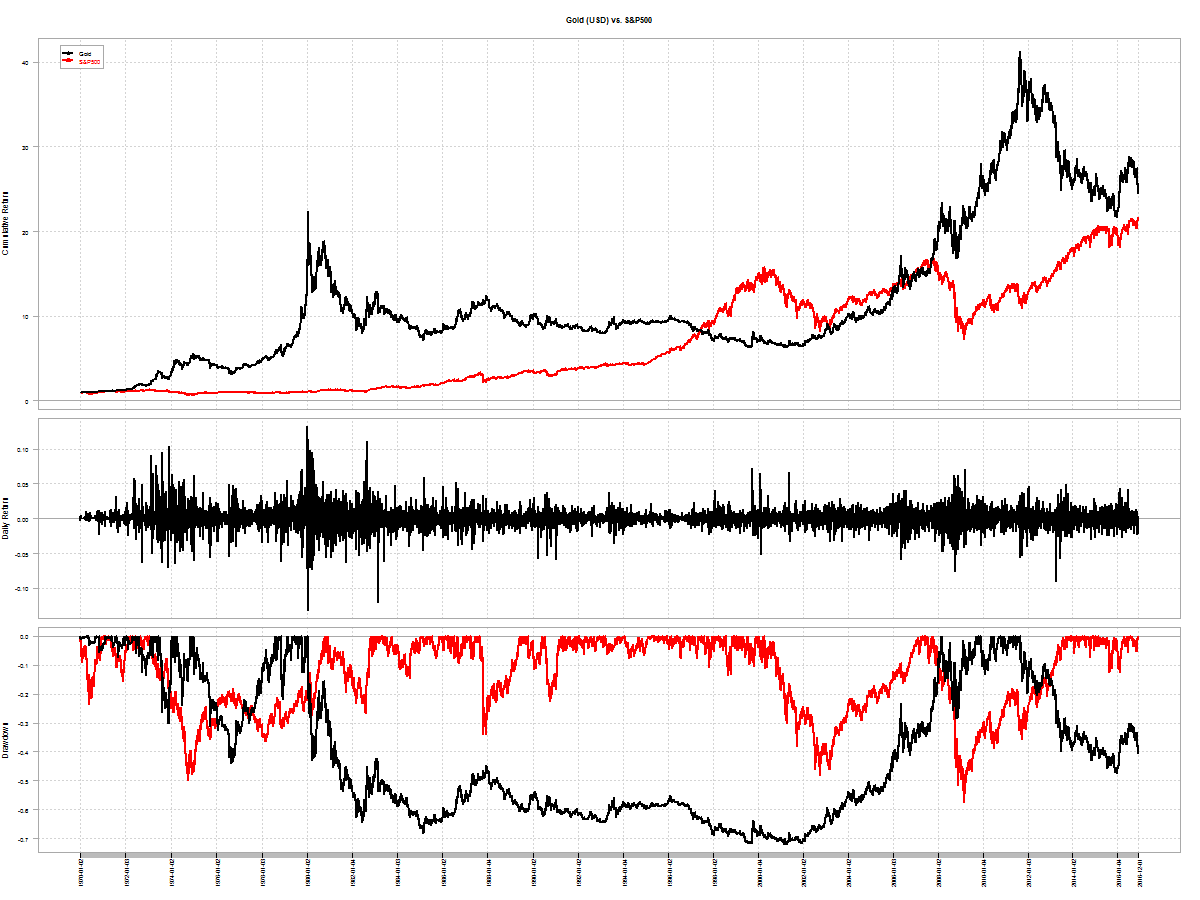
If you look at the returns of the S&P 500 vs. gold since 1970’s, gold comes out a winner.
gold-sp500-usd

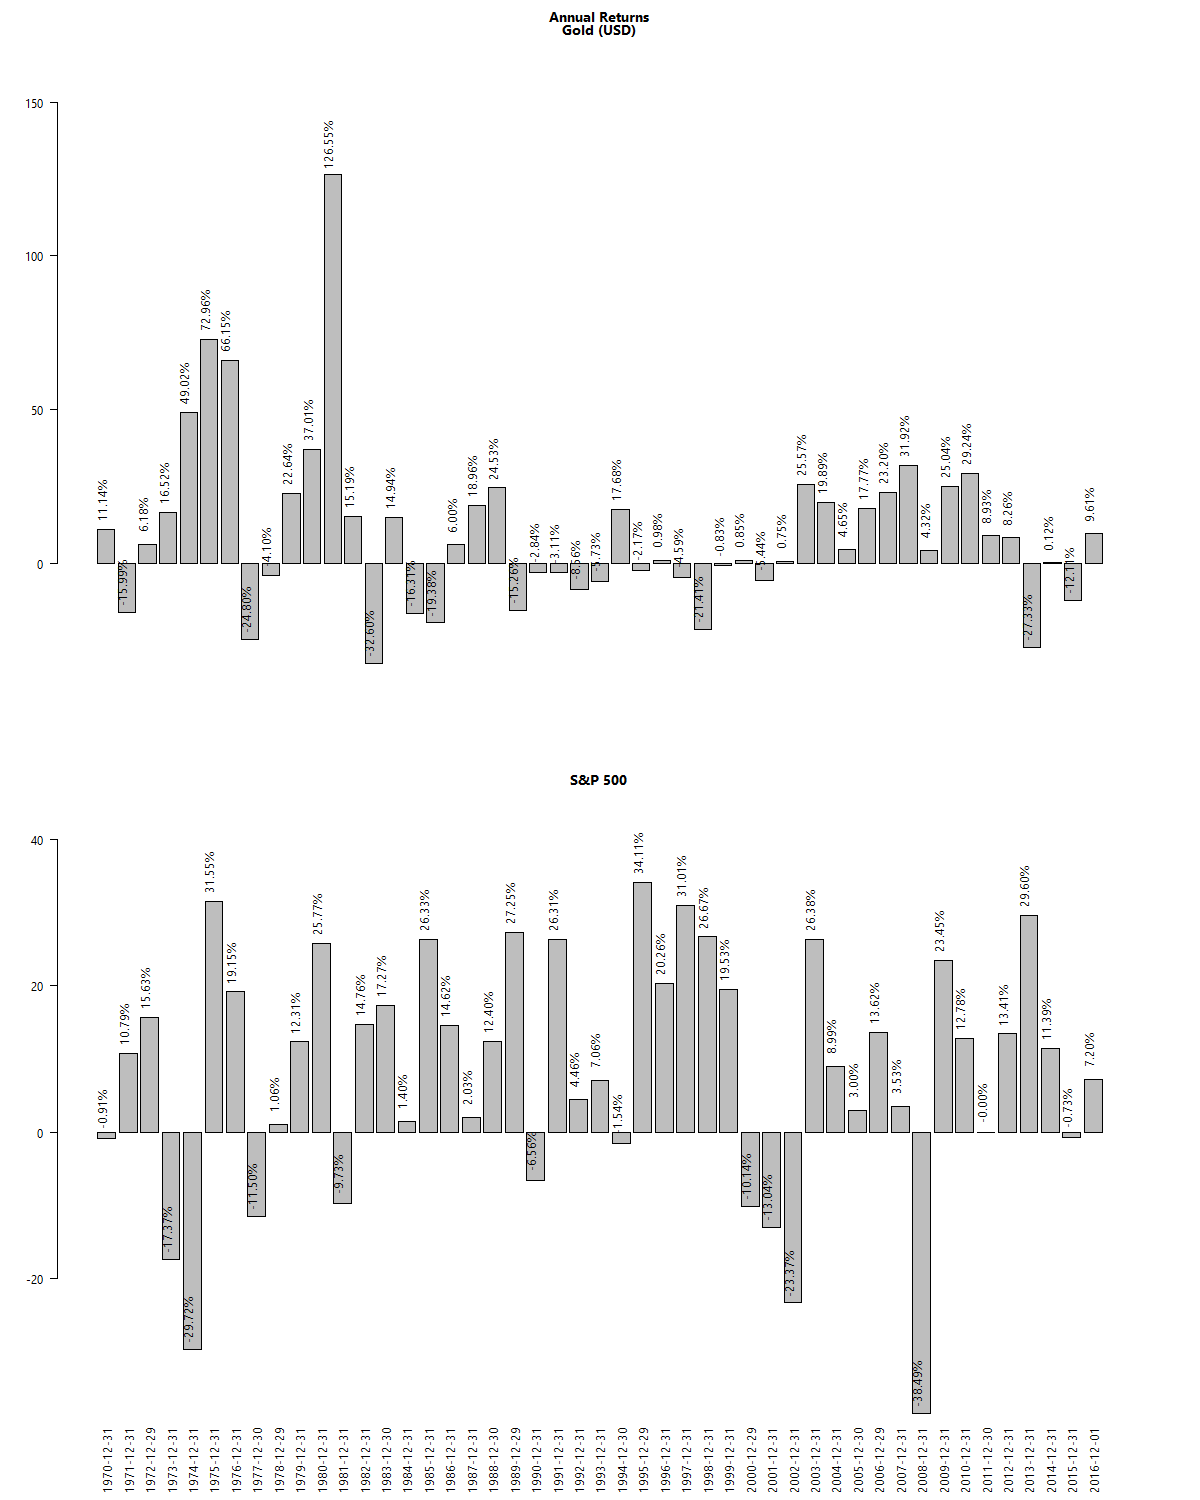
Not to say that it was easy to own. Gold peaked in the 80’s and remained out of favor till 2008!
gold-sp500-usd-annual

Rupee depreciation

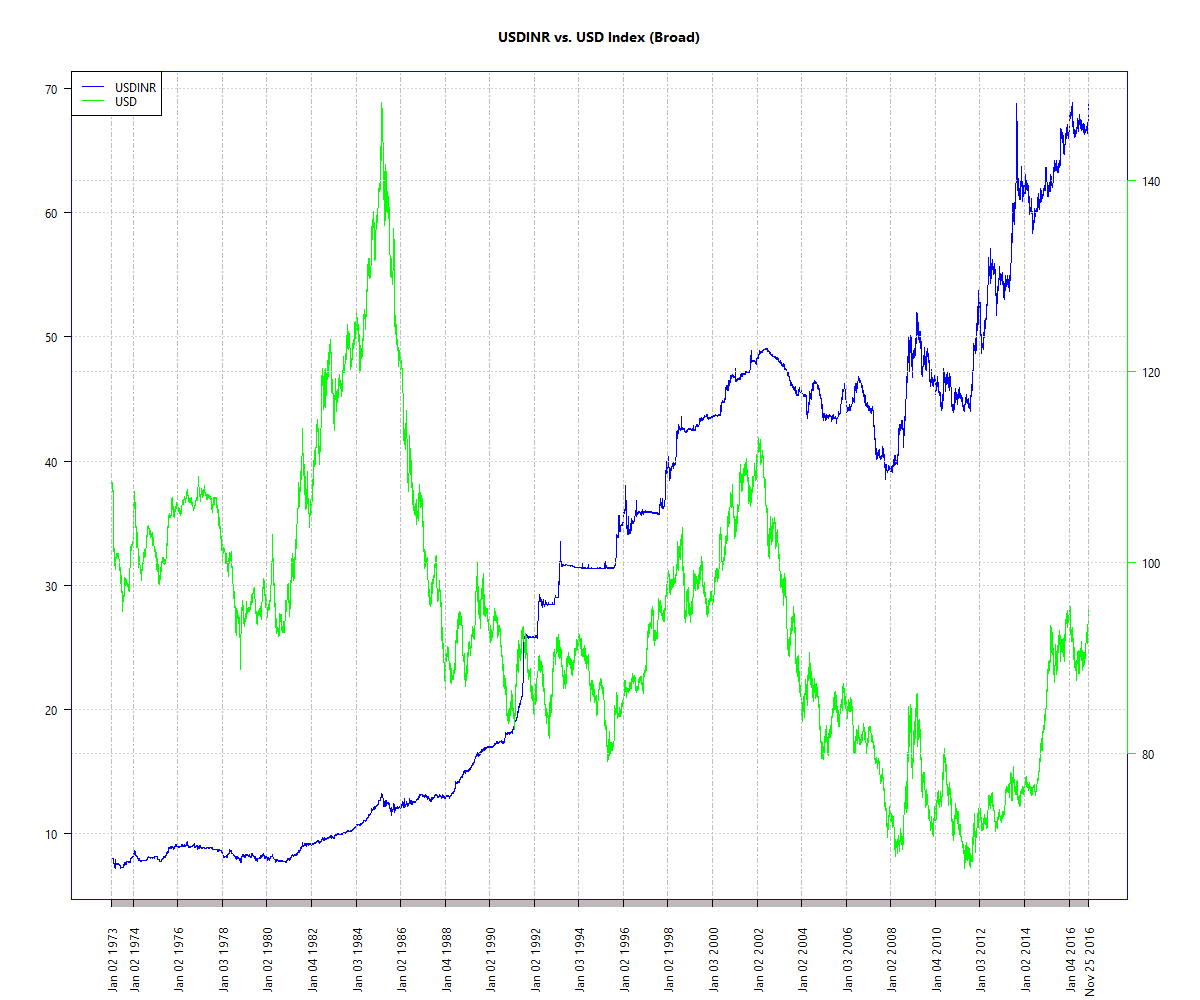
The dollar returns of gold is only a small part of the story. The bigger picture here is that of rupee depreciation. Let us see how USDINR compares with USD vs. a board basket of currencies:
inr-usd

See the blue line? That is how much the US Dollar has appreciated against the rupee. The green line is the dollar vs. other currencies with which America does business with.

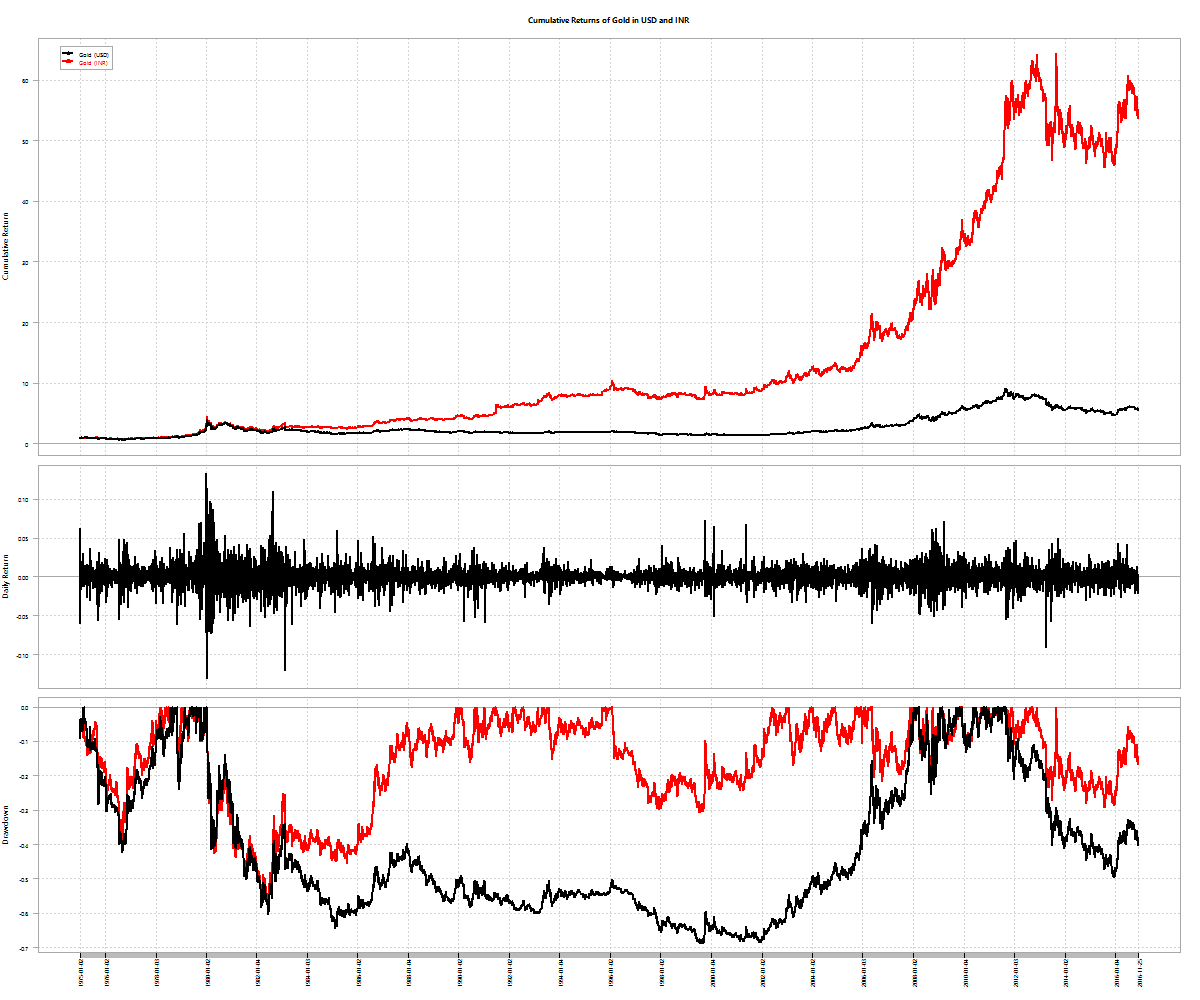
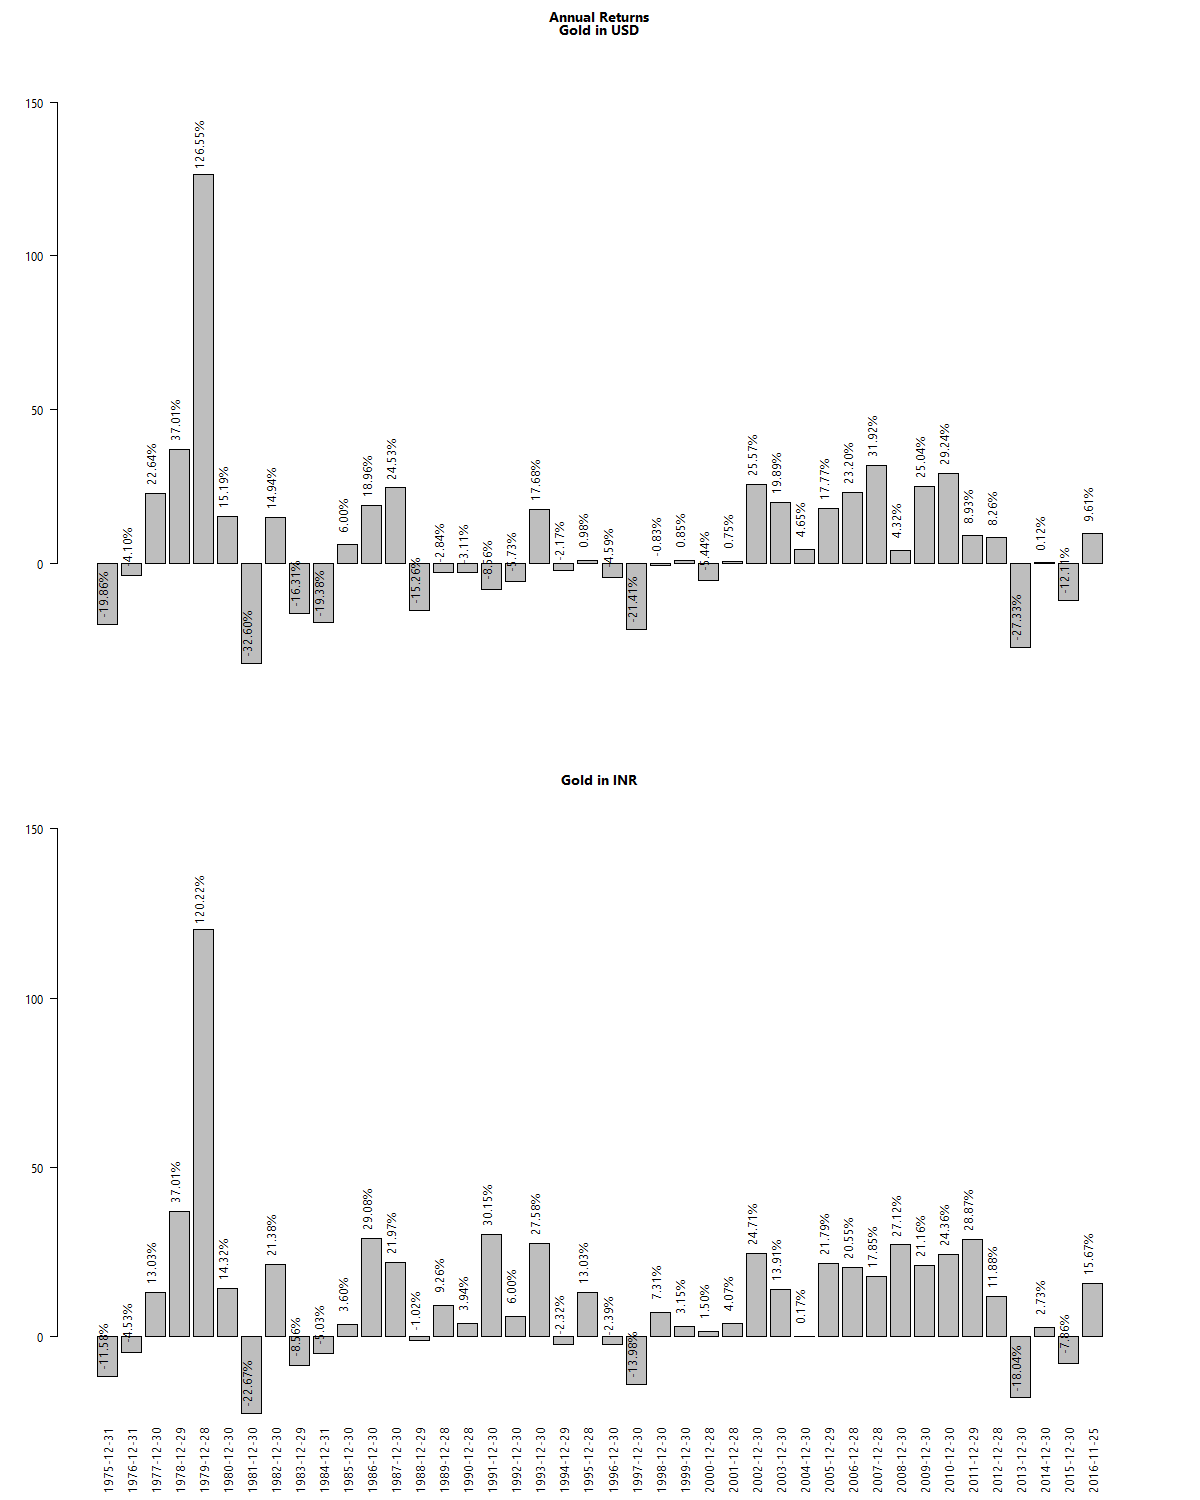
With this in mind, let’s compare the returns from gold in USD vs. gold in INR:
gold-inr-usd-cumulative

Notice the troughs of Gold/INR is shallower than those of Gold/USD?
gold-inr-usd

When you have a depreciating currency in hand, you can’t get rid of it fast enough. And the easiest way to do that in India is to buy gold. Our government can’t print more of it, can’t set its price and is fairly liquid.

Gold vs. NIFTY50

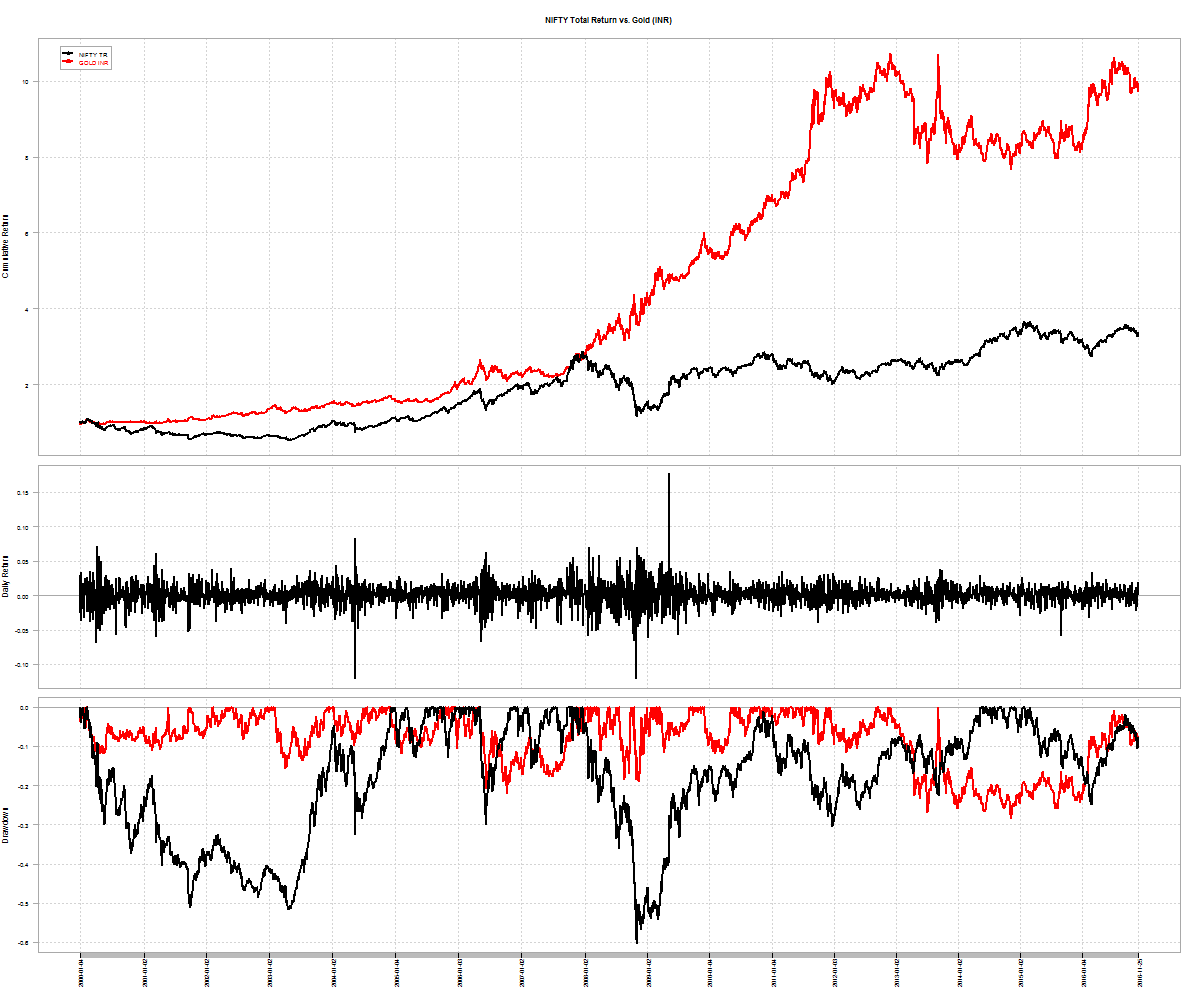
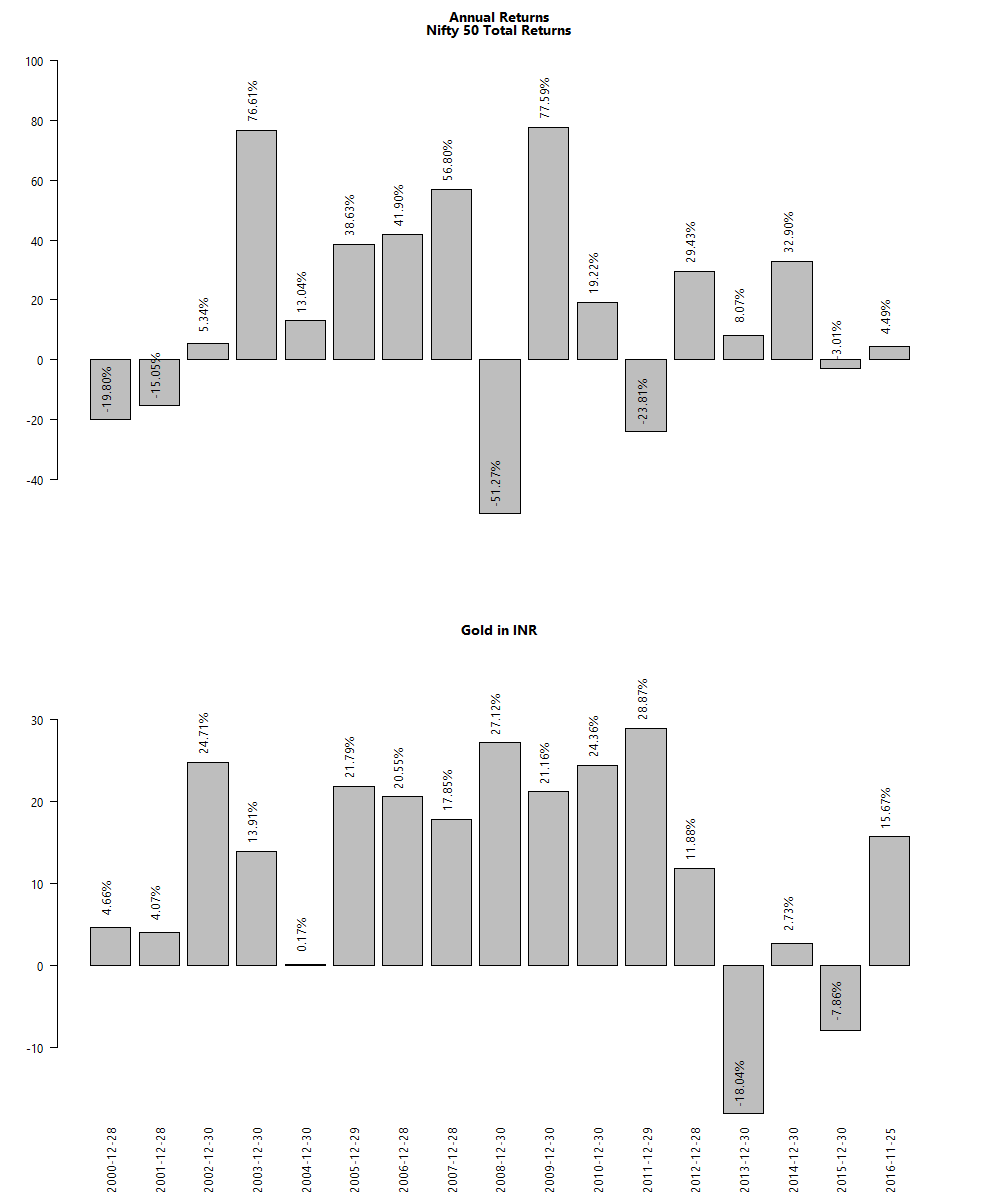
Since 2000, Rupee-for-rupee, gold had given better returns than the NIFTY 50.
gold-inr-nifty-cumulative

It is only the recent under-performance that has the anti-gold lobby all fired up.
gold-inr-nifty

The long arch of the depreciating rupee is a more powerful force than what equity-only investors will have you believe.

Ways to invest in gold

Until recently, the only way to buy gold was to buy physical gold. However that is a very expensive proposition. Then came the gold ETF – GOLDBEES – that allowed investors to hold paper gold in demat form and provided instant liquidity. This year, the government came out with Sovereign Gold Bonds that is pretty good alternative. Here’s a handy table that looks at different aspects:

goldbond

SGBs not only pay the price of gold at maturity but actually pay the investors an annual coupon. Currently, investors get 2.5% on their investment in SGBs. Contrast this to gold ETFs where investors have to pay asset management fees to the the fund house. From an asset allocation perspective, SGBs are a better deal than Gold ETFs. Go with gold bonds!