Linear Regression
The easiest relationship to examine between a pair of stocks is linearity. You can try and fit a linear model through their daily log returns first and then decide further course of action.
Here’s a scatter-plot that shows how Bank of India and Canara Bank could be related to each other.
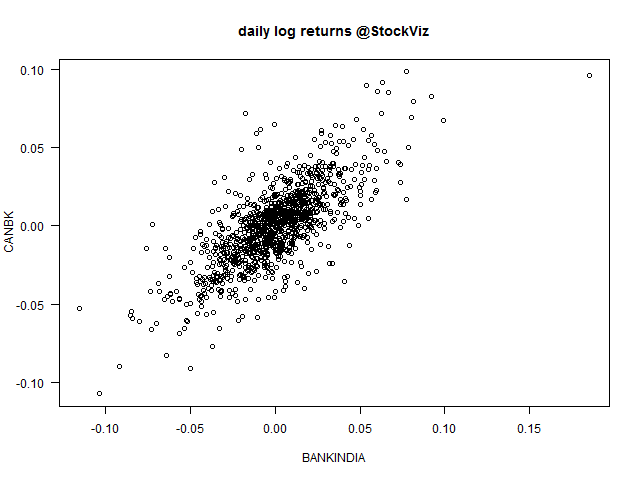
Results of linear regression:
Residuals:
      Min        1Q    Median        3Q       Max
-0.055050 -0.009995  0.000331  0.009440  0.063258

Coefficients:
              Estimate Std. Error t value Pr(>|t|)
(Intercept) -0.0002843  0.0006817  -0.417    0.677
BANKINDIA    0.7451950  0.0232860  32.002   <2e-16 ***
---
Residual standard error: 0.01638 on 575 degrees of freedom
Multiple R-squared:  0.6404,    Adjusted R-squared:  0.6398
F-statistic:  1024 on 1 and 575 DF,  p-value: < 2.2e-16
After fitting a regression model it is important to determine whether all the necessary model assumptions are valid before performing inference. If there are any violations, subsequent inferential procedures may be invalid resulting in faulty conclusions. Therefore, it is crucial to perform appropriate model diagnostics.
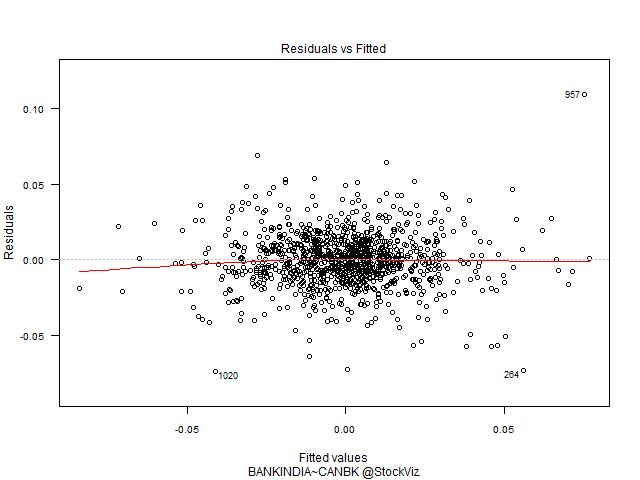
Residuals vs. Fitted
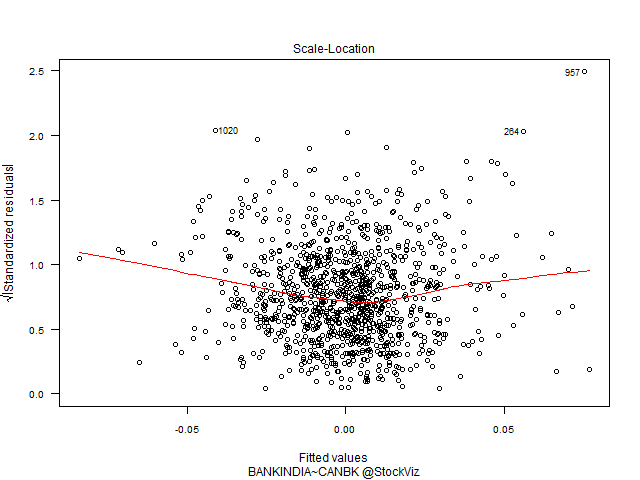
Residuals are estimates of experimental error obtained by subtracting the observed responses from the predicted responses. The predicted response is calculated from the model after all the unknown model parameters have been estimated from the data. Ideally, we should not see any pattern here.
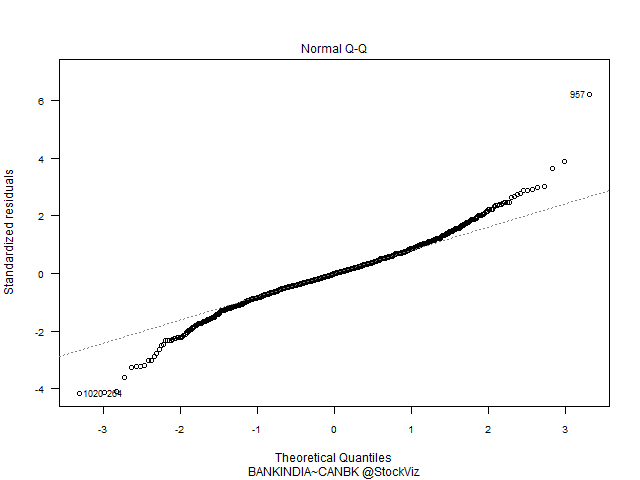
Q-Q Plot of Residuals
The QQ Plot shows fat tails.
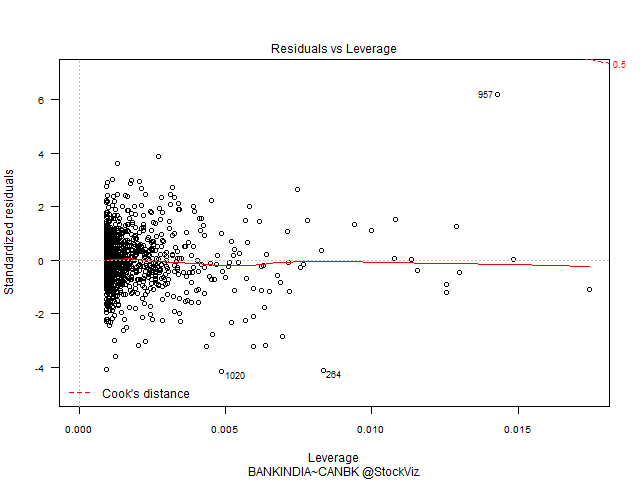
Residuals vs. Leverage
The leverage of an observation measures its ability to move the regression model all by itself by simply moving in the y-direction. The leverage measures the amount by which the predicted value would change if the observation was shifted one unit in the y-direction. The leverage always takes values between 0 and 1. A point with zero leverage has no effect on the regression model. If a point has leverage equal to 1 the line must follow the point perfectly.
Labeled points on this plot represent cases we may want to investigate as possibly having undue influence on the regression relationship.
Conclusion
A linear model on daily log returns may not be the best way to understand the relationship between the two stocks. We can either change the model (linear) or change the attribute (daily log returns) that we are using.
To be continued…
Source: Model Diagnostics for Regression
Related articles
- Least Squares Regression Line and How to Calculate it from your Data. (udemy.com)
- Nifty Statistical Study (stockviz.biz)
