Tag: sma

Tactical Allocation, An Introduction, Part II

We introduced tactical allocation in our Free Float newsletter last week. We saw how, by using a simple moving average to toggle between equities and bonds, one can reduce drawdowns in their portfolios. In the ensuing discussion, we mentioned how excess-returns found during back-tests could be an artifact of illiquidity and high transaction costs of the markets in the past. It is not like people who traded markets before us were dumb (or somehow, we suddenly added 50 IQ points in the last 20 years.) There has to be a reason why the money was left on the table.

Indian markets have seen significant changes over time. It has got more deeper and wider with better liquidity, lower transaction costs and higher levels of automation. One way to gauge the efficacy of strategies is to use a metric like Sharpe or Information Ratio over rolling-windows through time. Also, the drivers of total returns in allocation strategies will be different across different time-horizons leading to different tax liabilities. It is useful to decompose returns to handicap them from a tax angle.
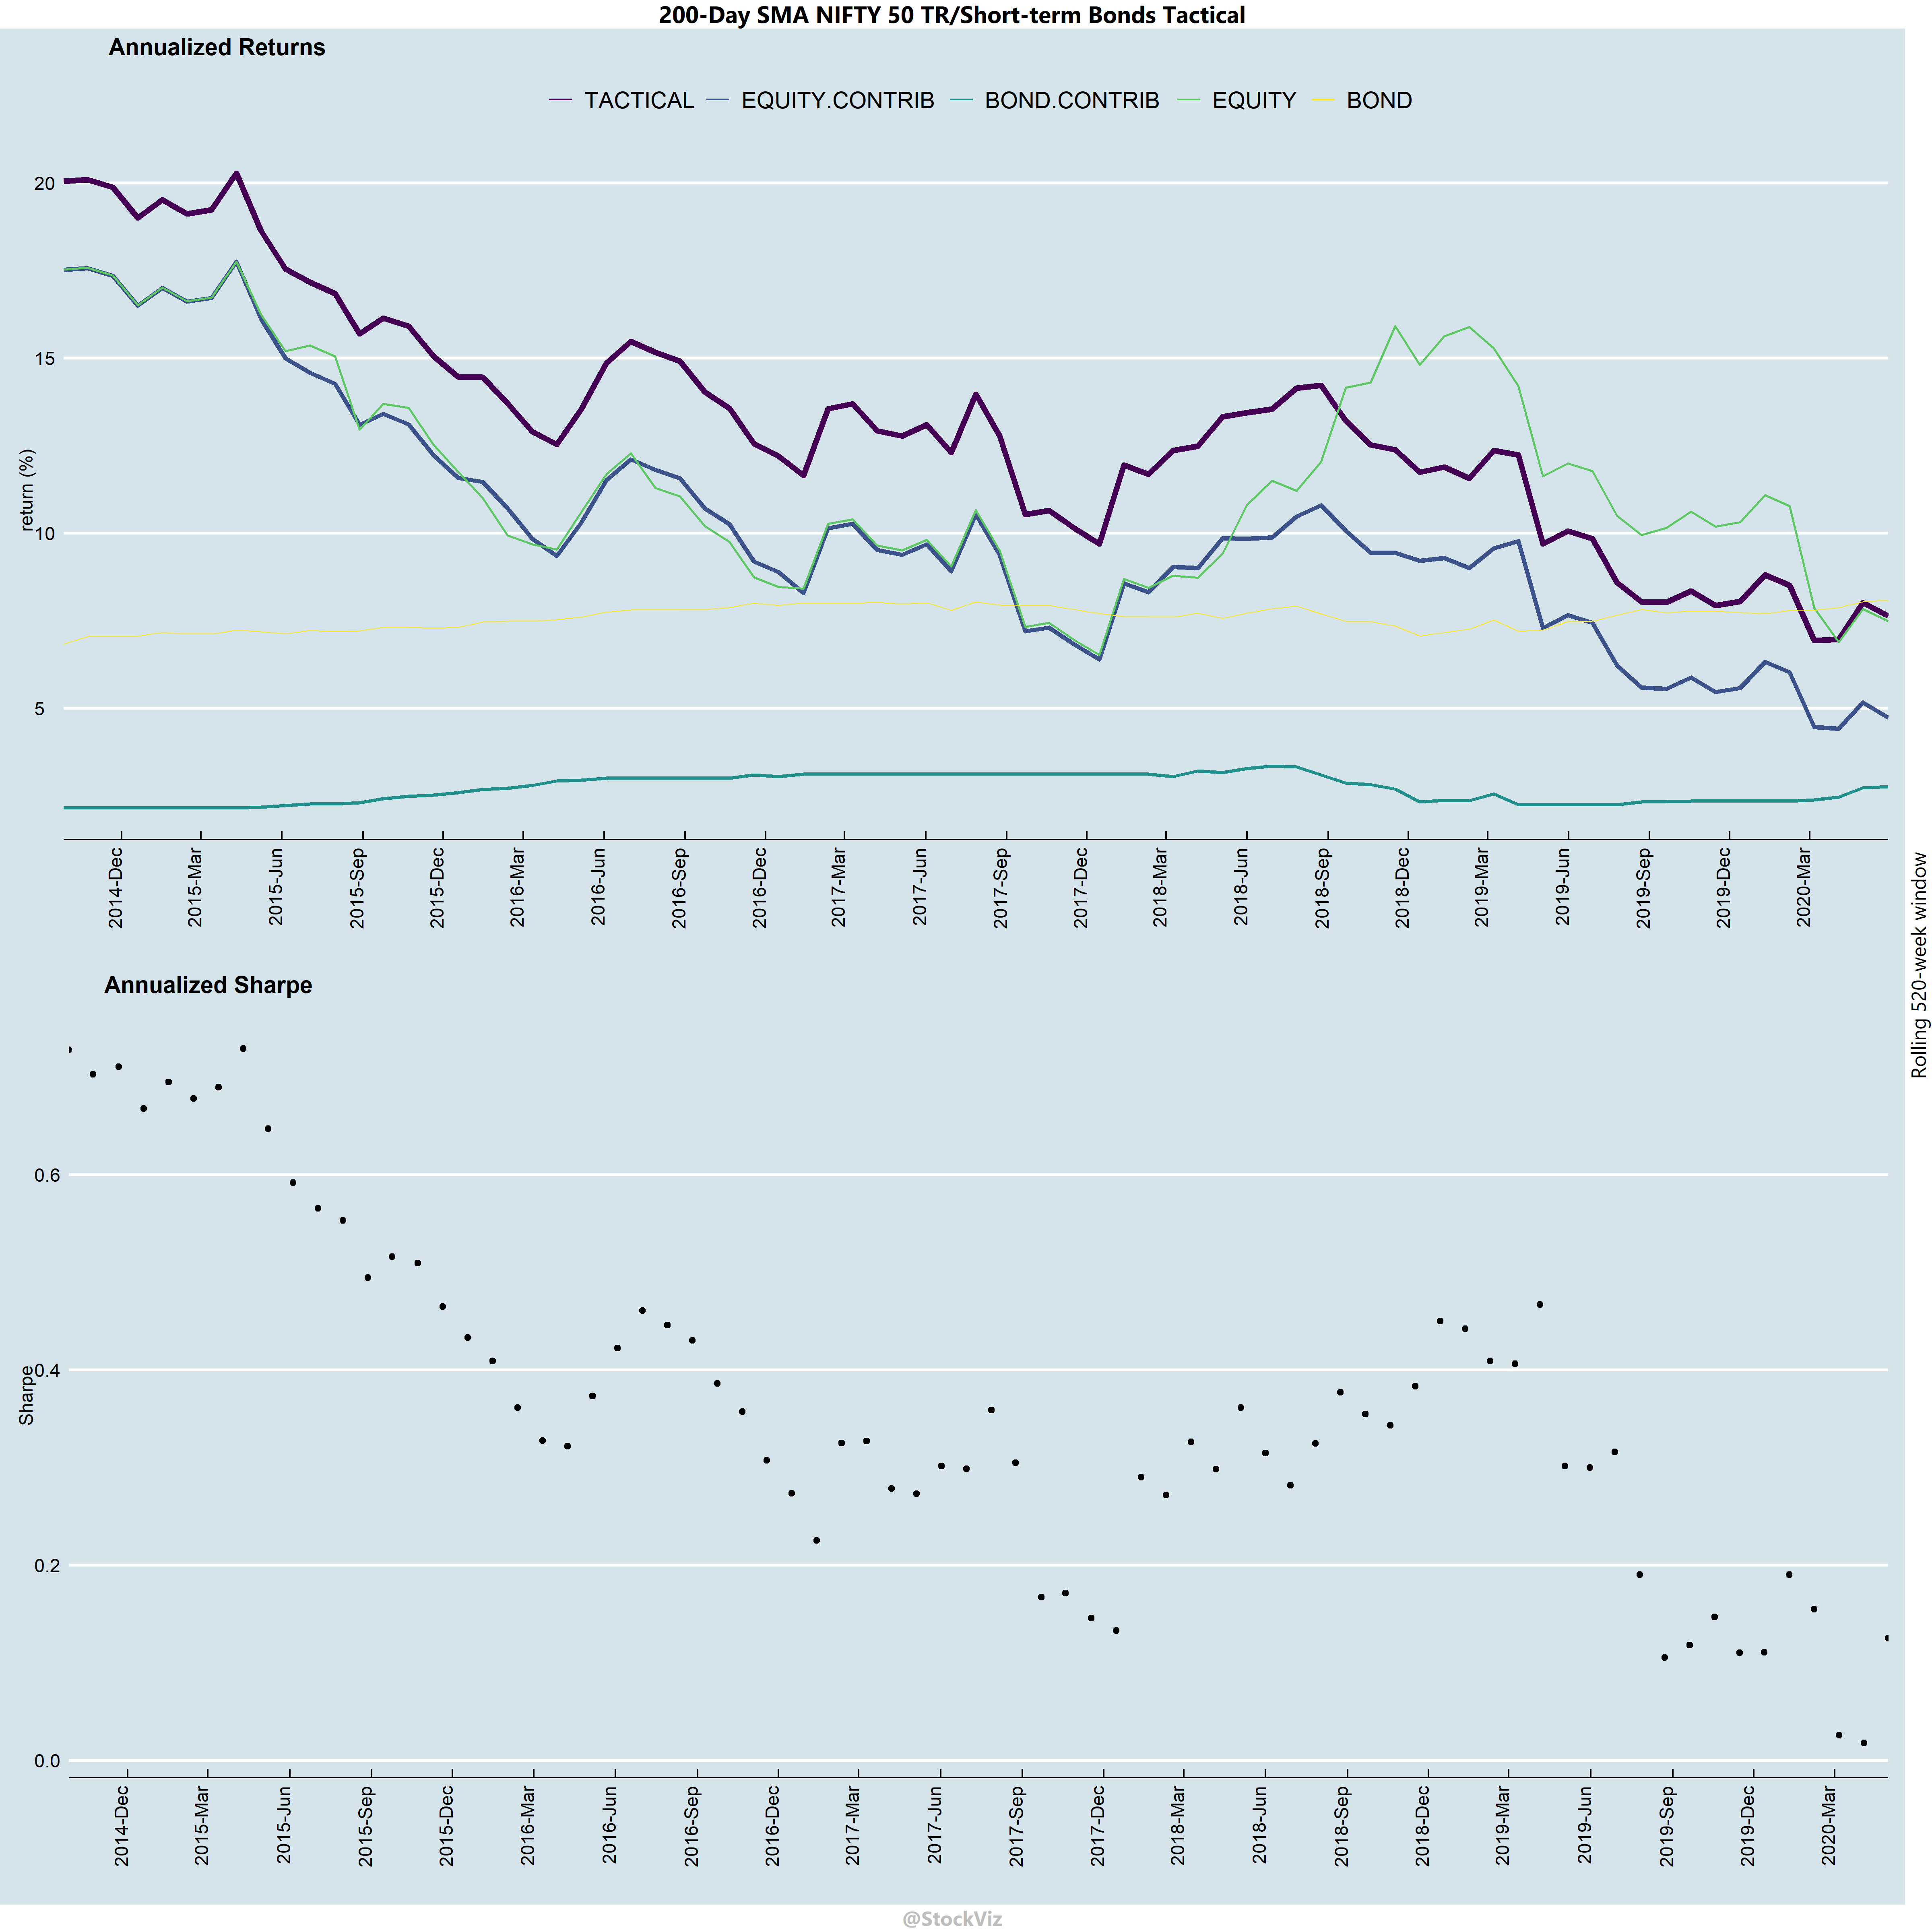
200-day Tactical Strategy
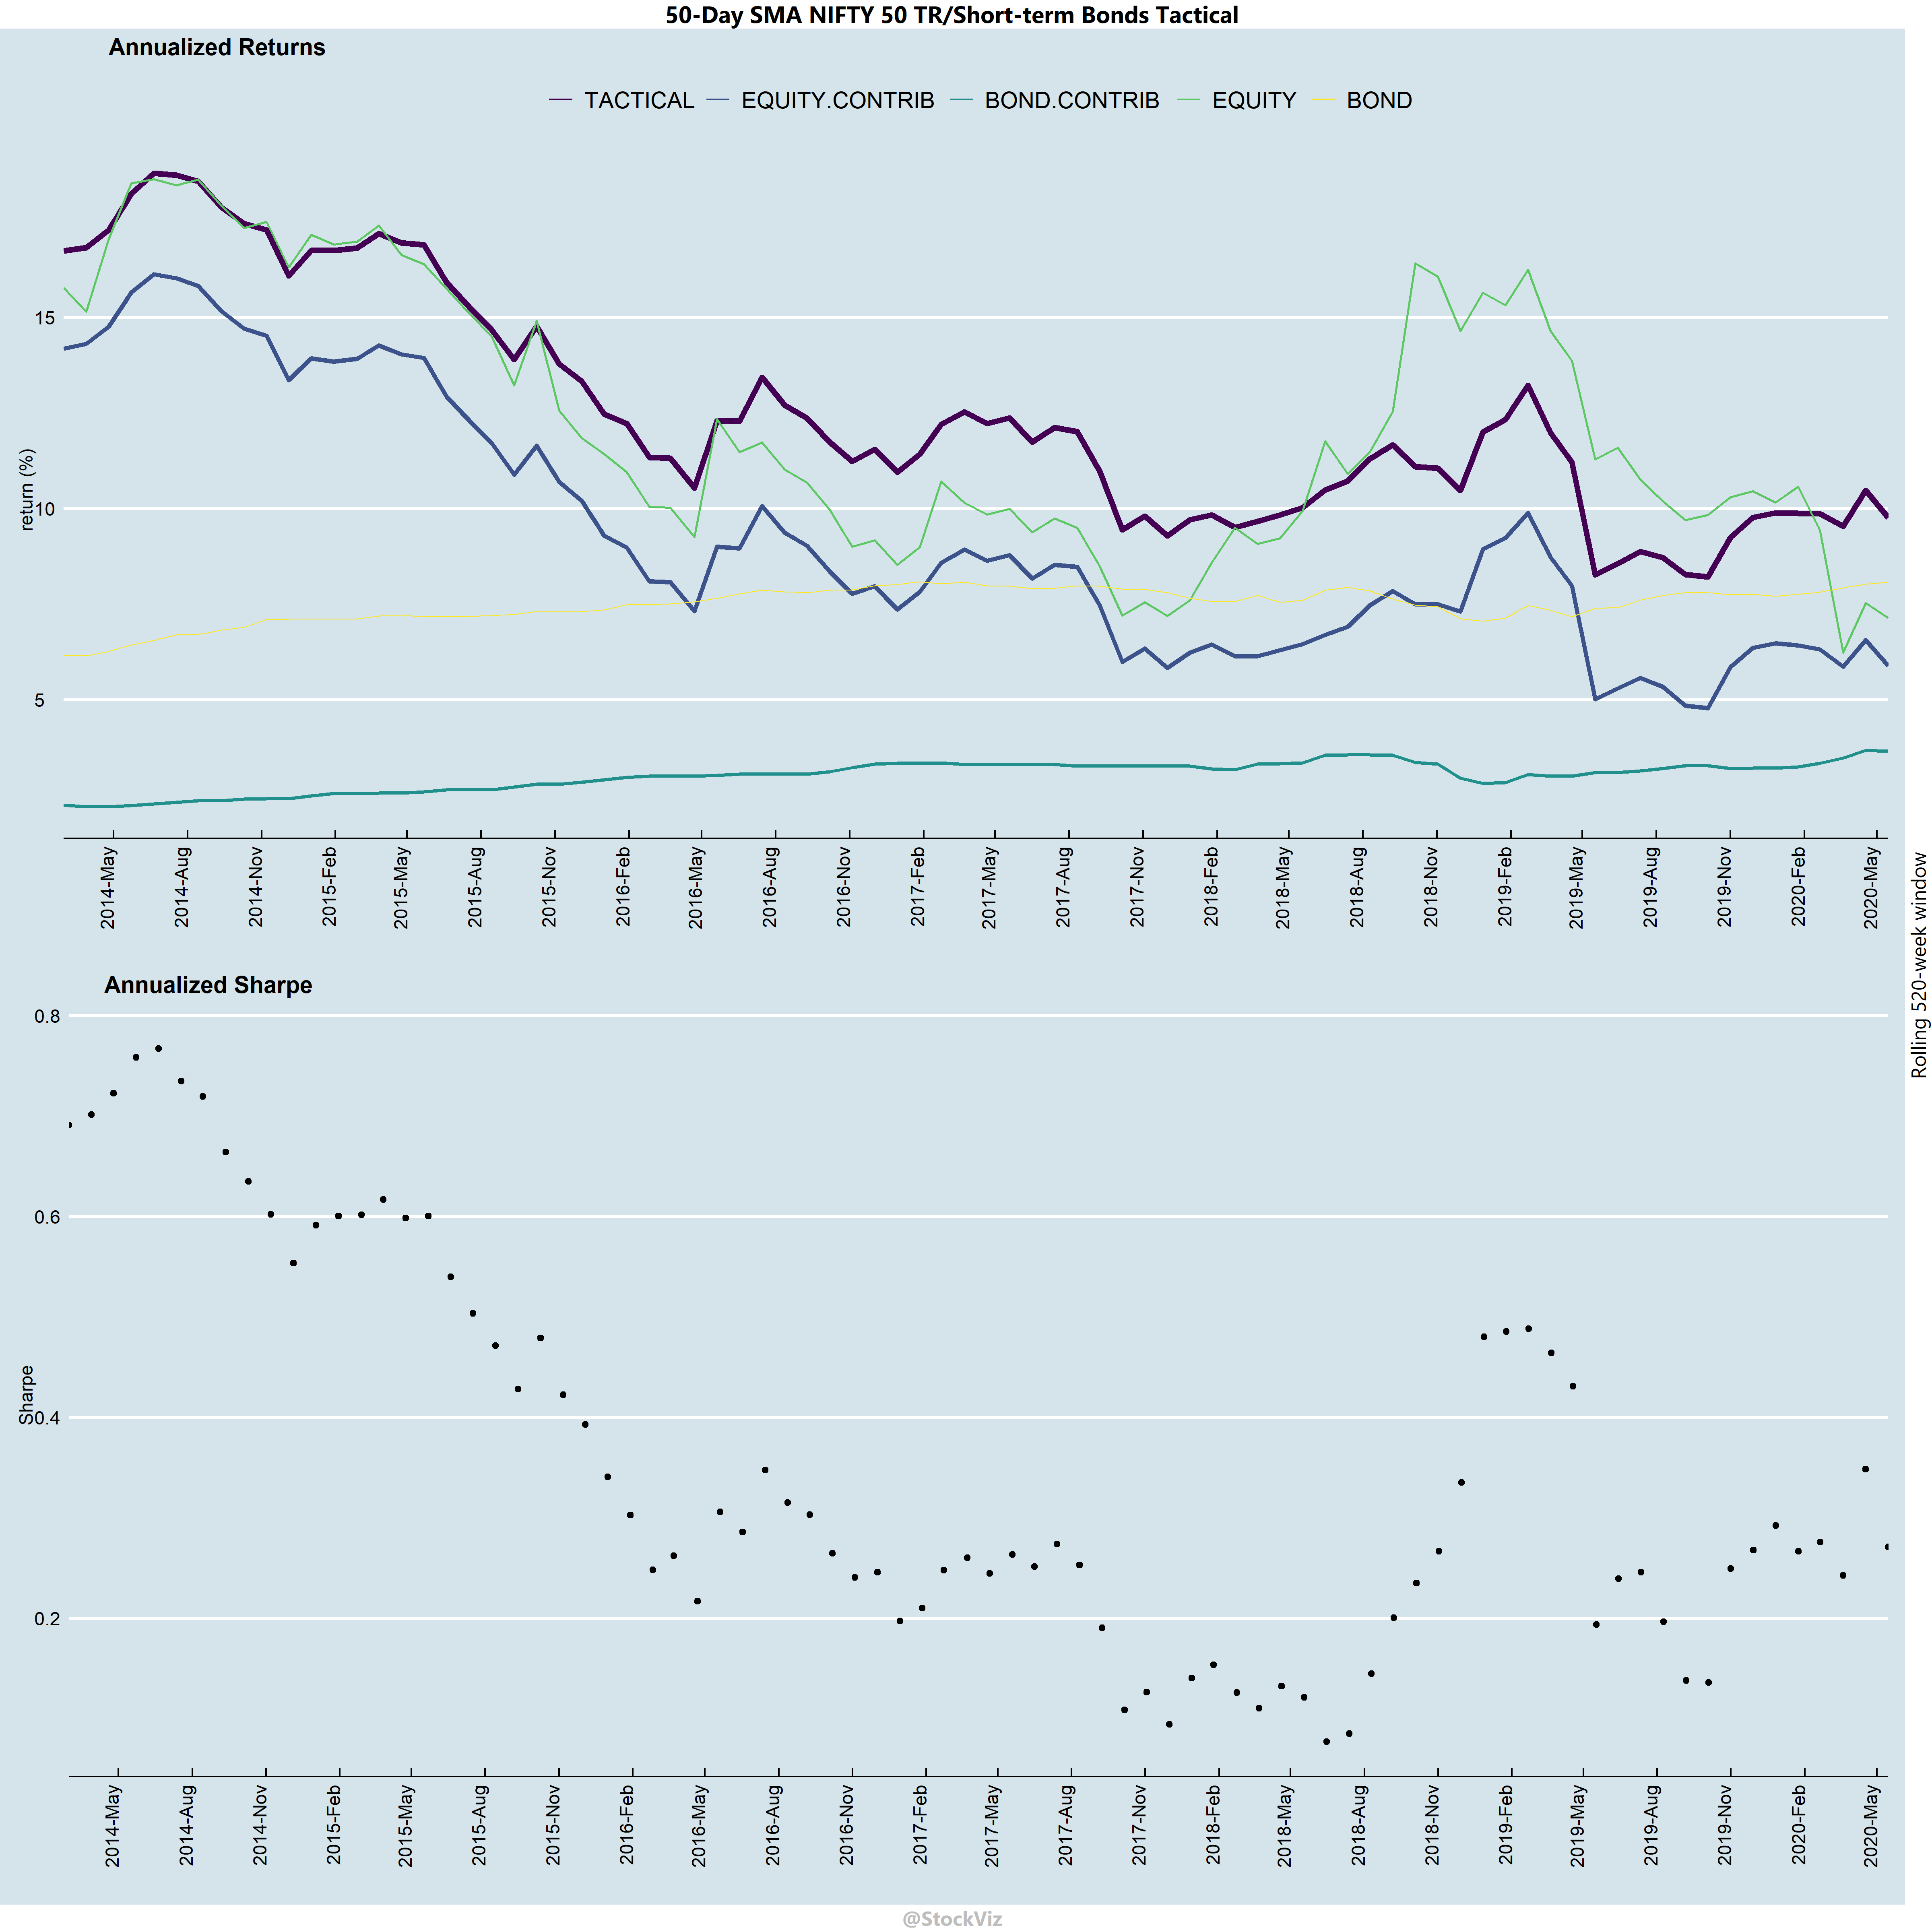
50-day Tactical Strategy
  • There are quite a few time-periods where tactical allocations will under-perform buy-and-hold equities.
  • Over a 10-year horizon, on an annualized basis, bonds have contributed about 1-4% to over-all returns.
  • Sharpes have been falling through time. One should expect this strategy to attenuate further.
  • Bonds have a bigger say in determining over-all returns in low equity return environments. So, use both assets!
  • Bond returns have been less volatile that those of equities’. However, that doesn’t mean that have been constant through time.
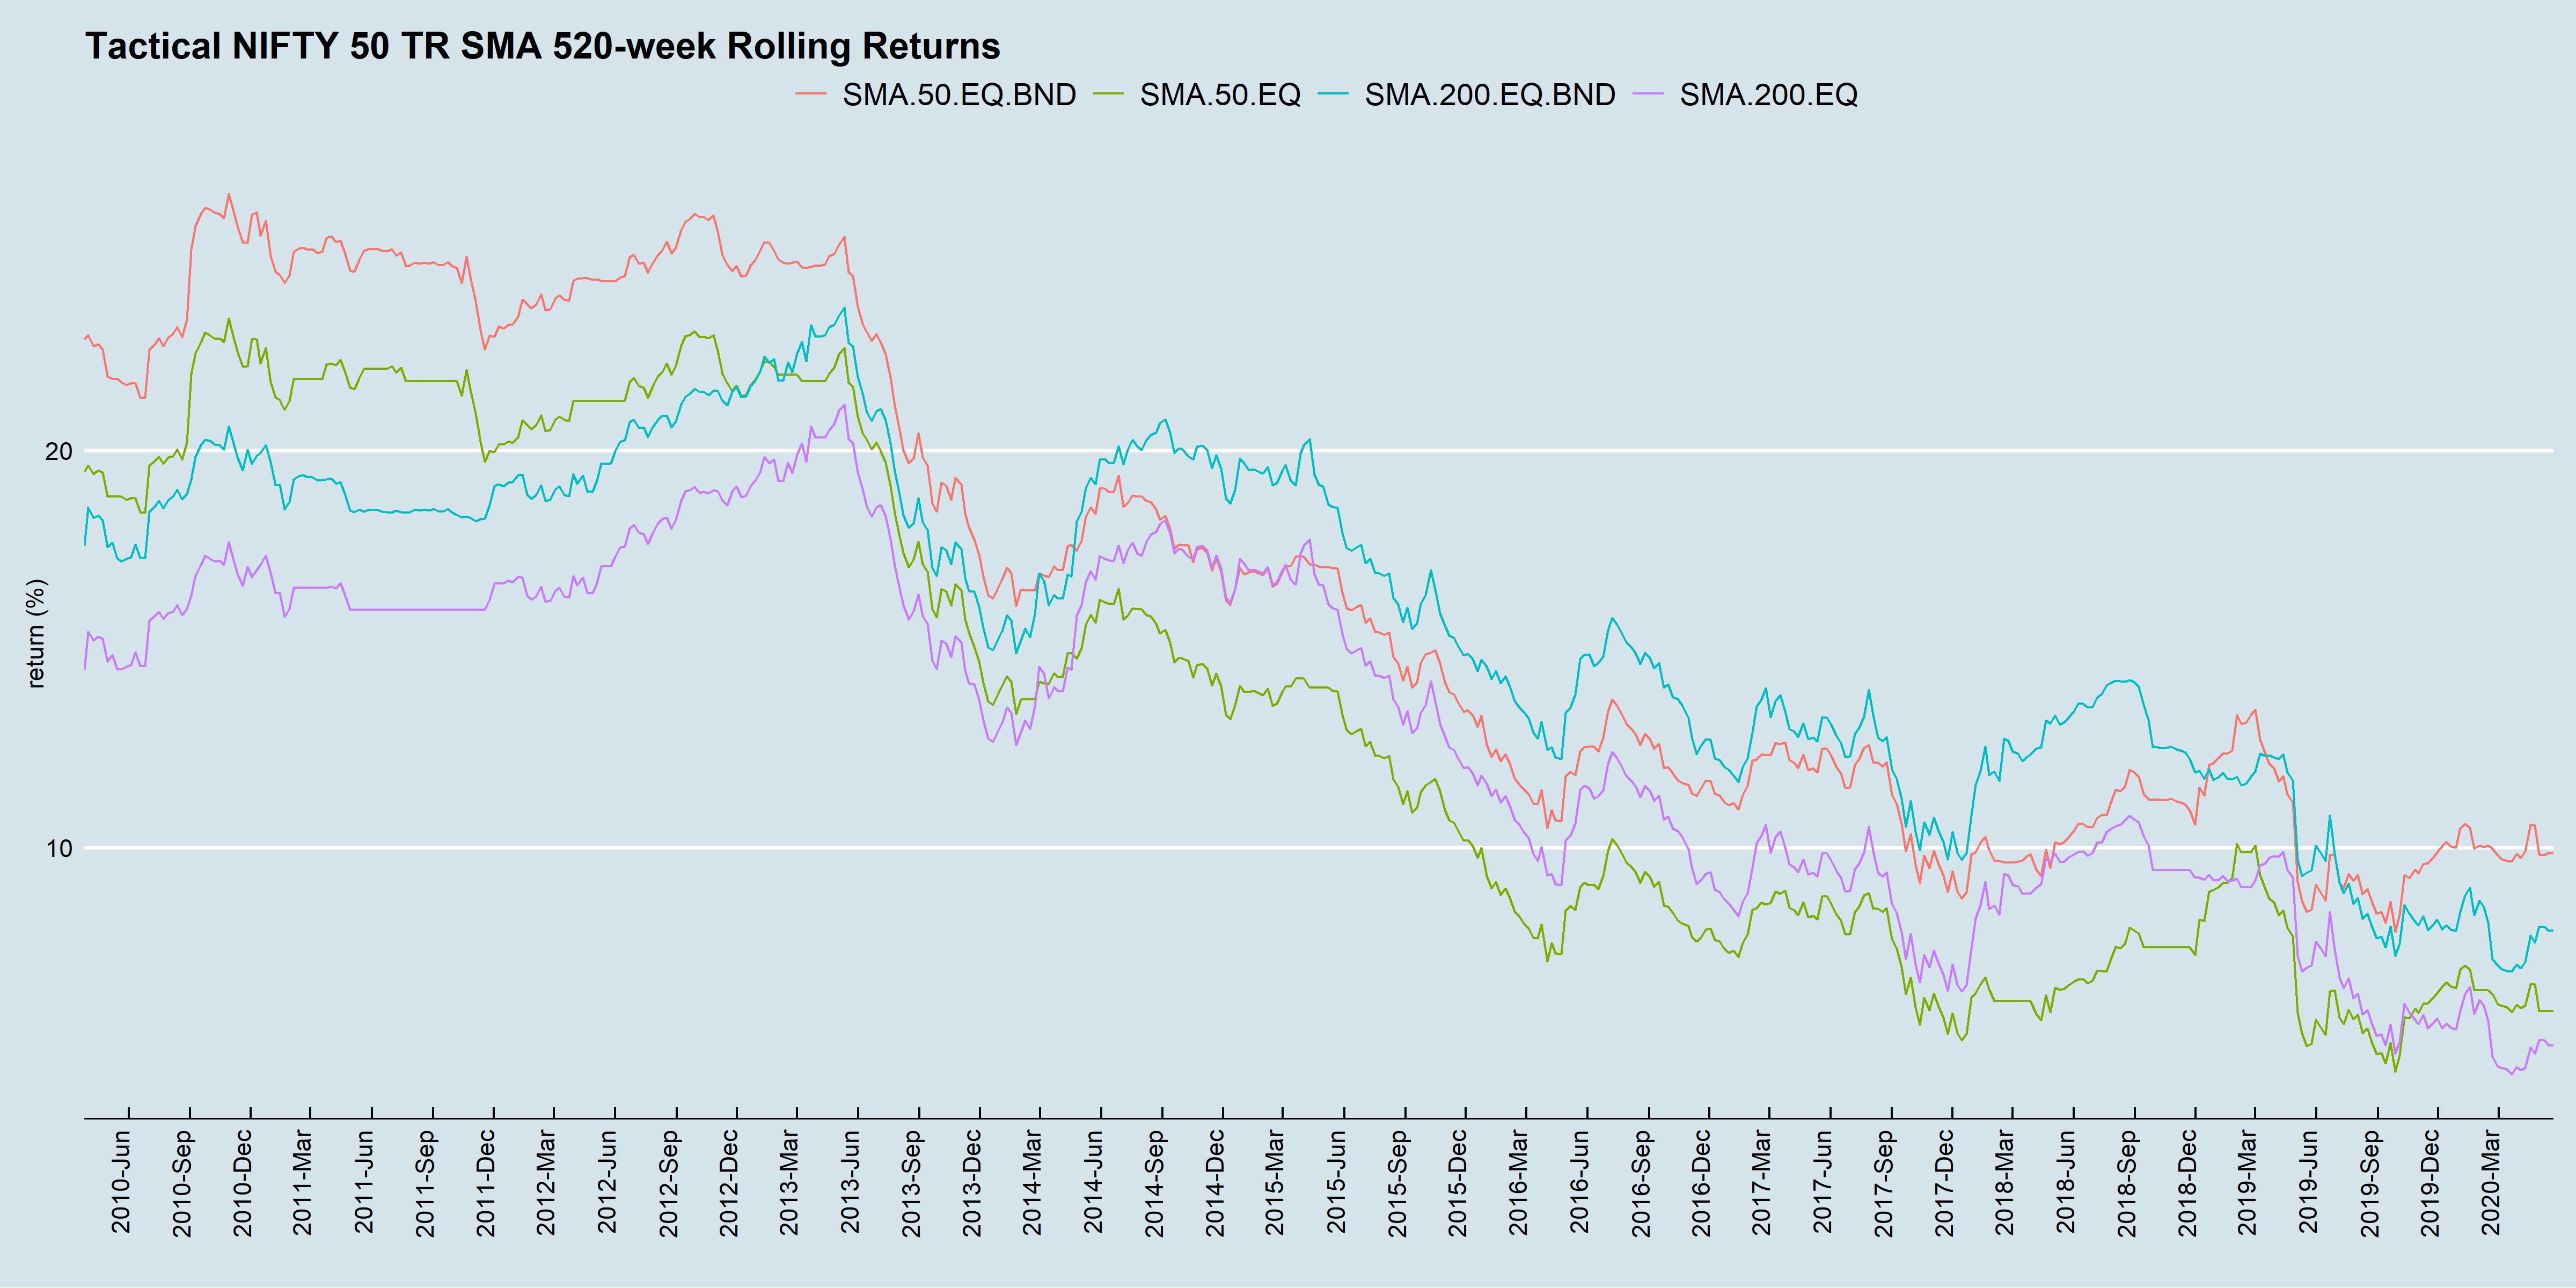
With and without bonds

In high equity-returns environments, bonds are usually an after-thought. However, running these strategies “equities-only” is ill-advised. In the chart above, returns in the recent 10-year periods have been palatable only because of the returns contributed by bonds.

Our personal experience has been that when equities drawdown, investors switch over to tactical strategies, only to abandon them once stocks recover. Thus, leaving their downsides exposed during the next drawdown; ensuring that they end up with the worst of both worlds.

Excess returns aside, SMA strategies are also useful in managing risk. With lower risk, one can employ a bit of leverage to boost returns. We have done deep-dives into variations of these strategies in the past. Interested readers can have a look at our SMA Collection.

SMA Strategy Transaction Cost Analysis

In our previous blog post on using SMAs to trade ETFs (SMA Strategies using ETFs,) we saw how using SMAs reduced drawdowns and boosted returns. We also saw how our Tactical Midcap 100 Theme out-performed mid-cap mutual funds even after taking into account STT and brokerage costs. Given the increased interest in our newly launched Tactical Midcap 150 Theme, we added transaction cost analysis to our backtests to give investors an idea of what gross and net returns of different SMA look-backs look like over buy and hold.

Annualized Returns

SMA Strategy Transaction Cost Analysis
transaction cost = 0.2%

Take-away

1) SMA strategies on the NIFTY 50 index do not produce excess returns over buy-and-hold. However, the 200-day SMA did keep an investor out of the worst of the 2008 drawdown at a reasonable cost.
NIFTY 50 SMA

2) For other indices, perhaps counter-intuitively, 20-day SMA beat 10-day SMA both in Gross and Net returns.

3) SMA strategies will under-perform buy-and-hold when markets are generally trending up. However, they will out-perform when markets turn negative.
NIFTY MIDCAP 150 TR.20.cumulative
NIFTY MIDCAP 150 TR-20.annual

The RETFMID150 ETF tracking the NIFTY MIDCAP 150 index, continues to be well traded on the NSE. You can access the SMA(20) strategy shown above through our Tactical Midcap 150 Theme.

Code and additional charts on github.

SMA Strategies, Part III

In Part II of SMA Strategies, we saw how we could reduce drawdowns by making sure that we go long only when the slope of the SMA is positive. i.e., when the SMA is trending higher. Here, we will look at cross-overs.

While previous strategies compared the current value of the index vs. its SMA, a cross-over strategy uses a smaller look-back SMA instead of the index. Essentially, go long if SMA(N/4) > SMA(N).

NIFTY 50 Cumulative Returns

Cross-over only

NIFTY%2050

Cross-over with slope check

NIFTY%2050

The stand-alone slope check from Part II has lower peak drawdowns than the cross-over versions. The additional averaging of recent prices leads to a lagged response. Given the proclivity of our markets to cliff dive, a lagged response will result in higher drawdowns. It could, however, lead to lower transaction costs by papering over short-term mean-reverting moves.

Code and additional charts are on github.

SMA Strategies, Part II

In Part I we saw how a simple tactical strategy that can be implemented by ETfs out-performs an actively managed mutual fund even after transaction costs. However, there are more than a million ways to implement an SMA strategy. Everything from picking the lookback period, cross-overs and enveloping are all open questions. There is no single “best” way to do it. Here, we add a simple check that makes sure that the SMA is trending higher before going long.

Quite simply, for an N-day SMA, we compare Nth-day to N/2th-day. If it is higher, then we go long.

Cumulative returns

NIFTY 50

NIFTY%2050

NIFTY MIDCAP 100

NIFTY%20MIDCAP%20100

NIFTY SMLCAP 100

NIFTY%20SMLCAP%20100

Take-away

The gross returns are lower than the “raw” strategy that we saw in Part I. However, the drawdowns for the 10-day SMA are a lot shallower. Shallower drawdowns allow a bit of leverage to be employed. This could be a good starting point for a NIFTY futures trading strategy.

In Part III, we look at how cross-over strategies perform.

Code and charts are on github.

SMA Strategies using ETFs

A simple moving average of an index is nothing but the average of closing prices of that index over a specified period of time. We did a quick backtest to see how an SMA based toggle between going long an index vs. cash performed.

Cumulative returns

NIFTY 50

NIFTY%2050

NIFTY MIDCAP 100

NIFTY%20MIDCAP%20100

NIFTY SMLCAP 100

NIFTY%20SMLCAP%20100

Feasibility

The backtest, unsurprisingly, shows that shorter the SMA look-back period, better the performance. However, the boost in performance comes at the expense of higher number of trades. Lower look-backs are only viable now thanks to brokerages where you would pay zero for these trades (however, you still pay the securities transaction tax.) To see how this would shake out in the real world, have a look at how our Tactical Midcap 100 Theme has performed in the last ~2 years:

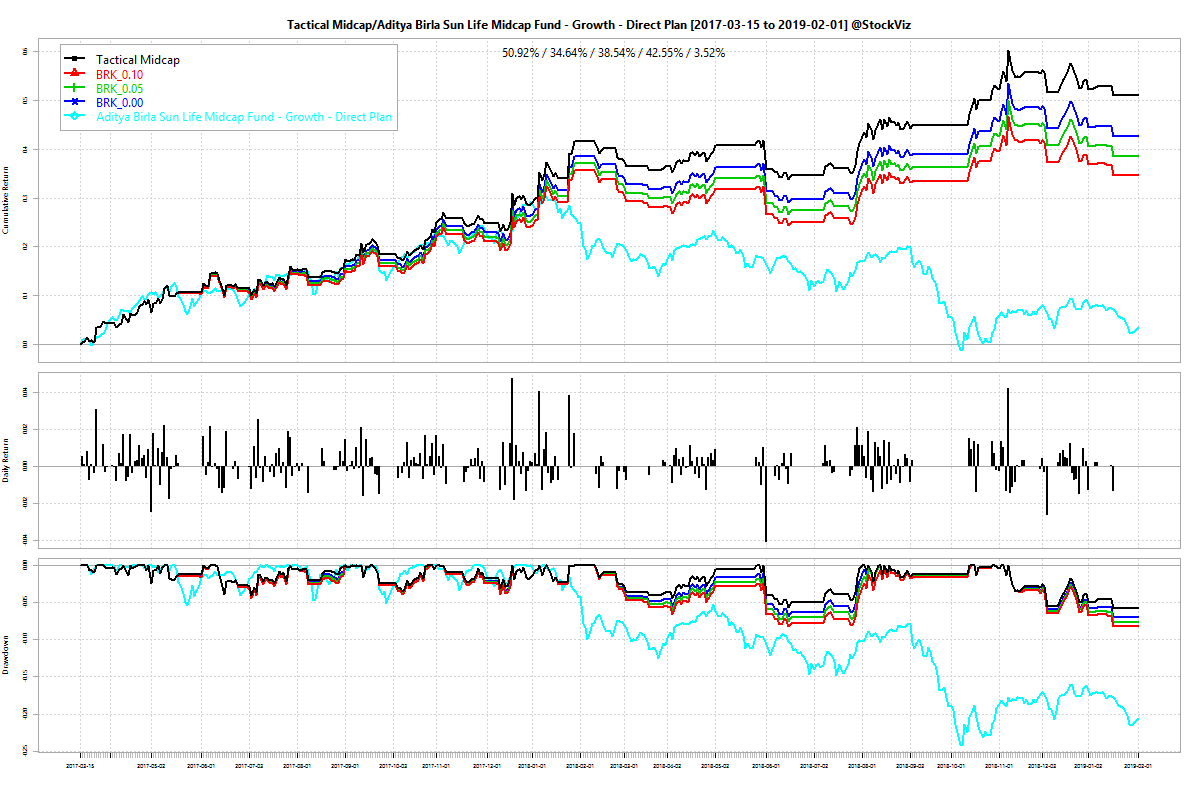
The Theme used the M100 ETF (Motilal Oswal Midcap 100 ETF) with a 10-day SMA toggle to switch between the ETF and LIQUIDBEES. The blue line represents zero brokerage and 0.1% STT and the green line represents a brokerage of 5p and 0.1% STT. The chart shows it beating an actively managed midcap fund across all transaction fee scenarios.

The snag is that this strategy is tough to scale. The M100 ETF just doesn’t trade enough for this strategy to absorb more than Rs. 10 lakhs. And there is no small cap ETF on the horizon to implement the strategy in that space.

The second problem is that M100 trades to a wide premium/discount to NAV (see: ETF Premium/Discount to NAV.) This is another layer of risk that an investor could do without.

However, things seem to be moving in the right direction. Reliance Capital launched a new ETF recently that tracks the NIFTY MIDCAP 150 index. Their ETFs usually trade better – tighter spreads, narrower tracking errors, better liquidity. Hopefully, it will emerge as a stronger alternative to M100 and allow these strategies to scale. We setup the Tactical Midcap 150 Theme that uses the RETFMID150 ETF instead of the M100 ETF for those who are interested.

In Part II, we will see how adding a simple check on the SMA can reduce drawdowns.

Code and charts are on github.