MOMENTUM
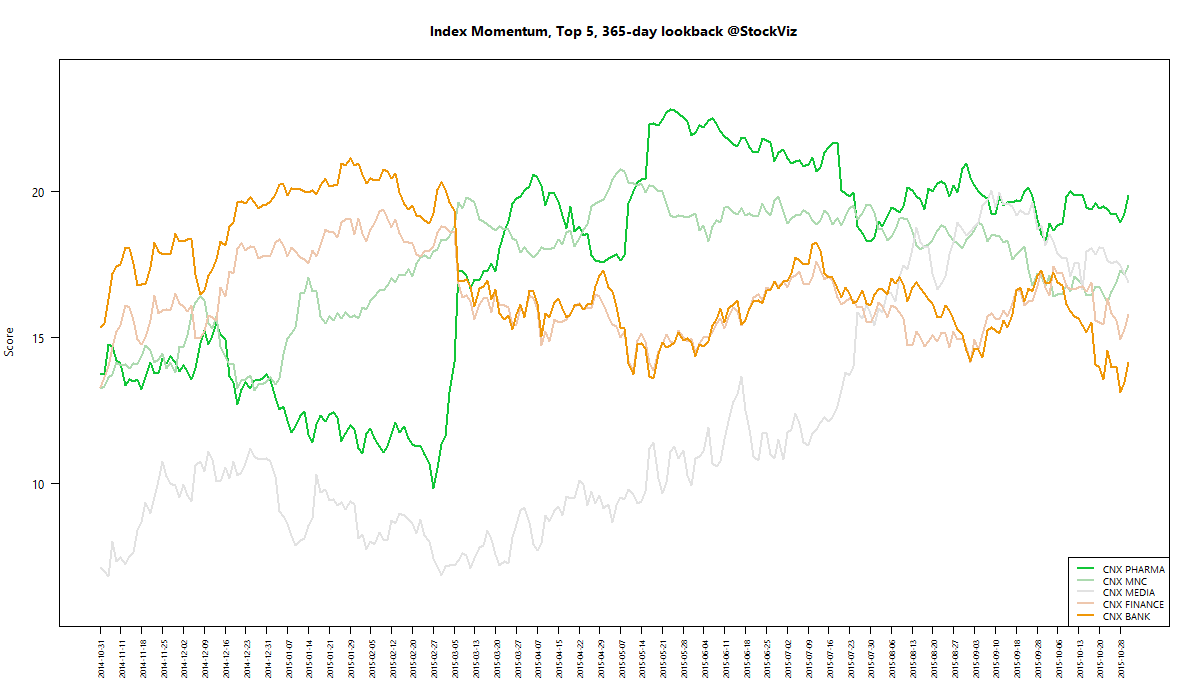
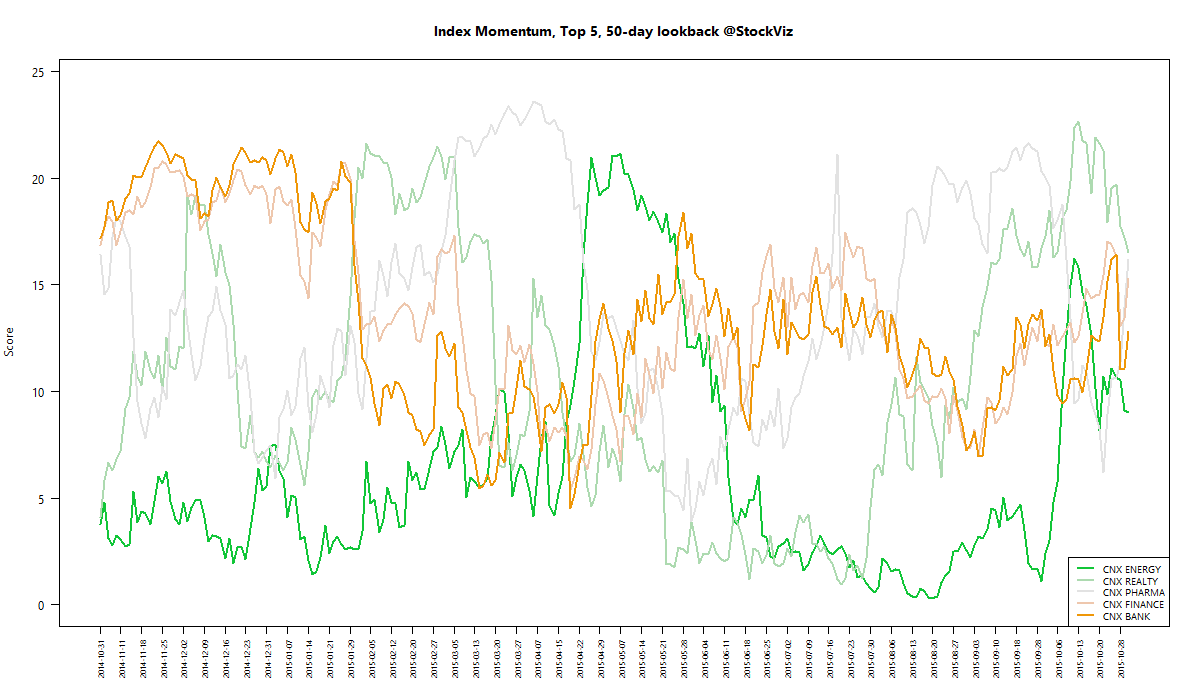
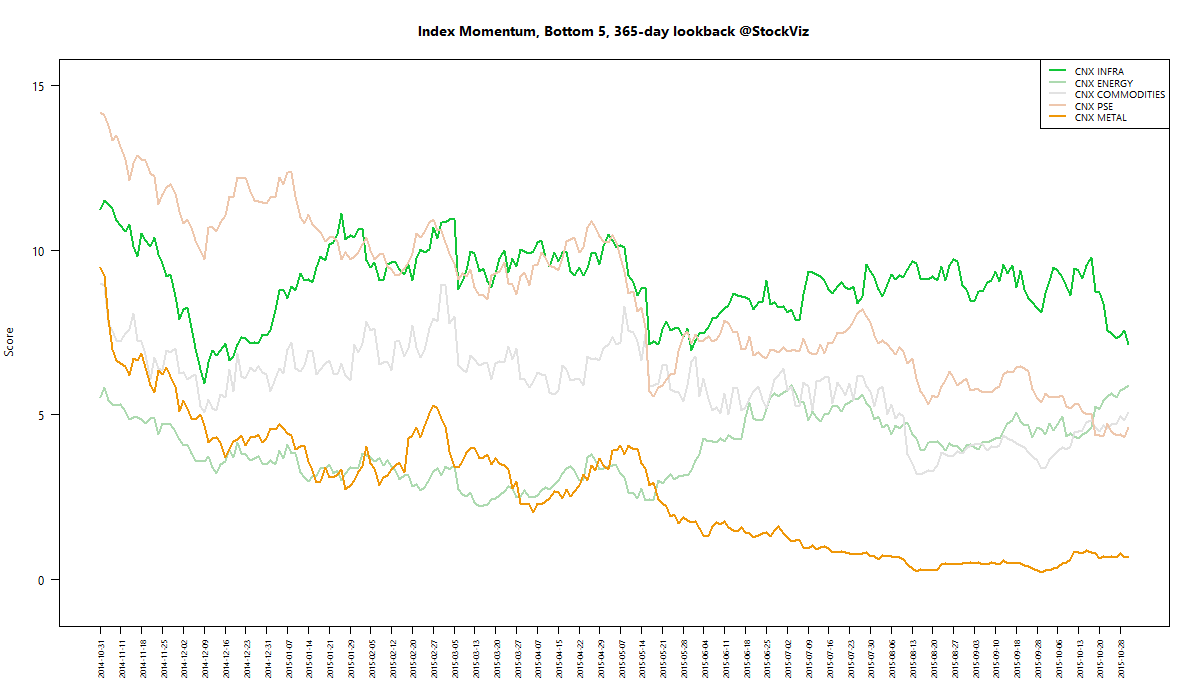
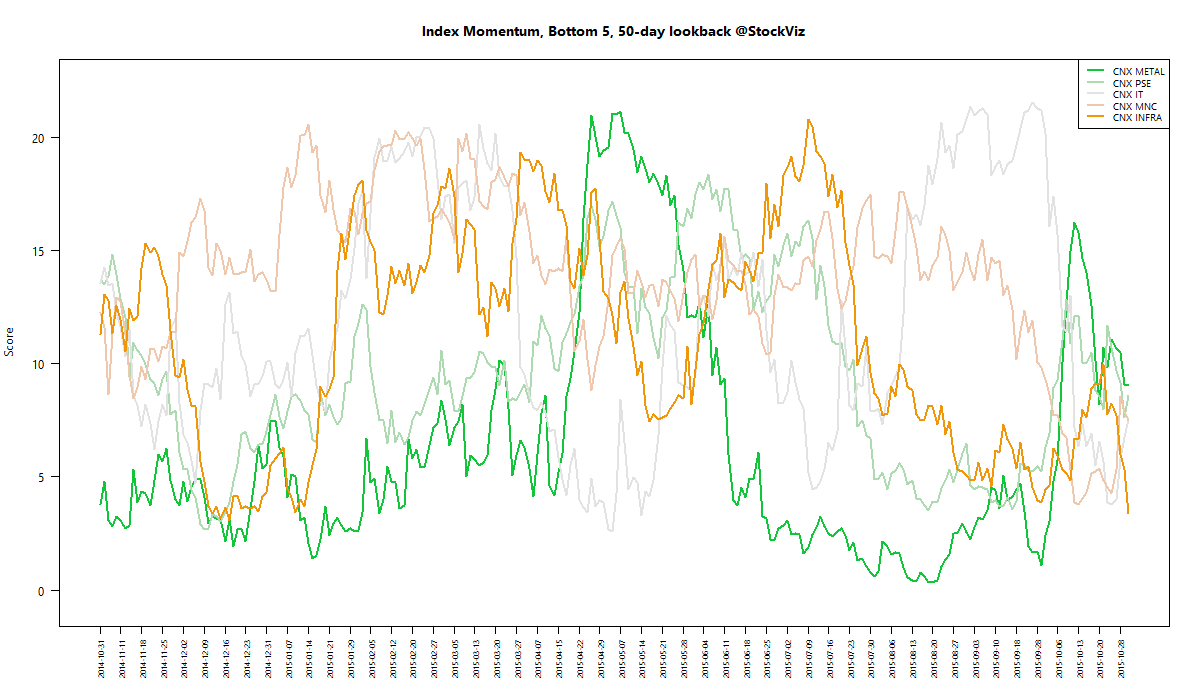
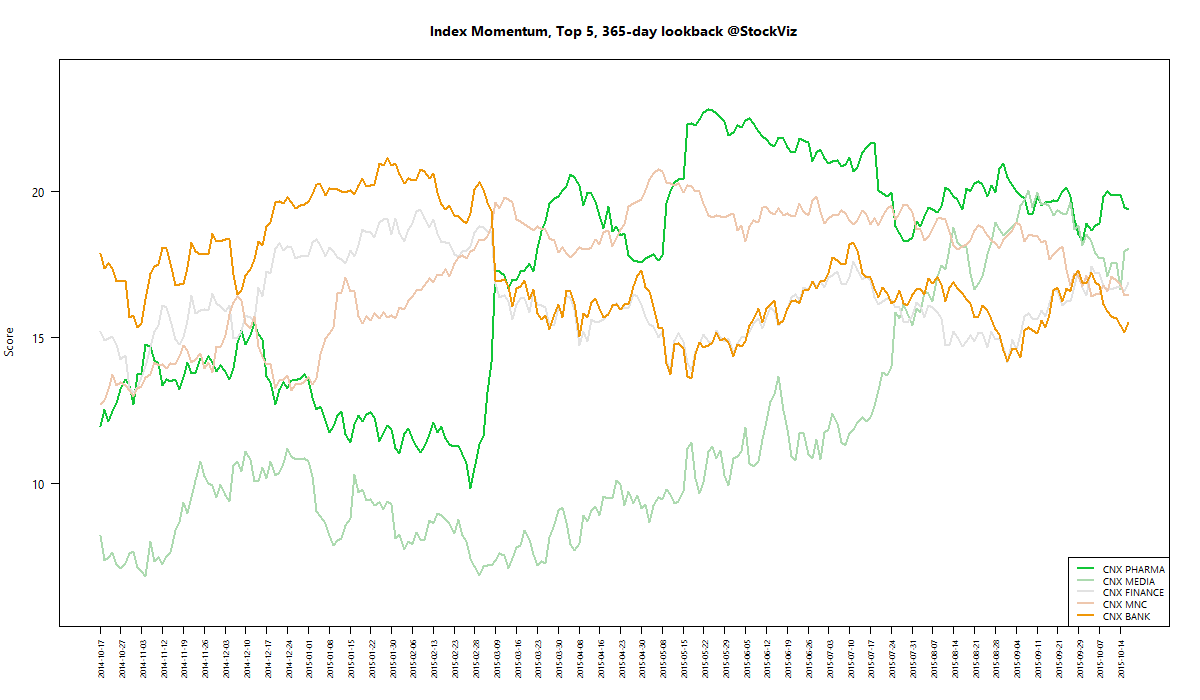
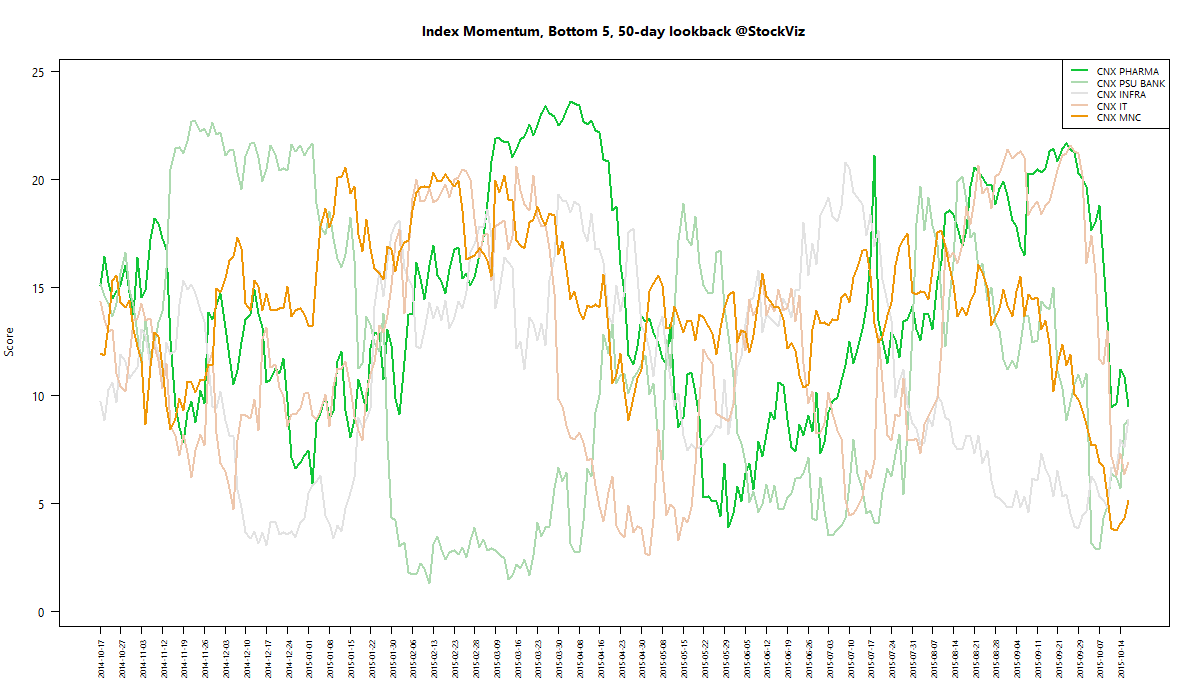
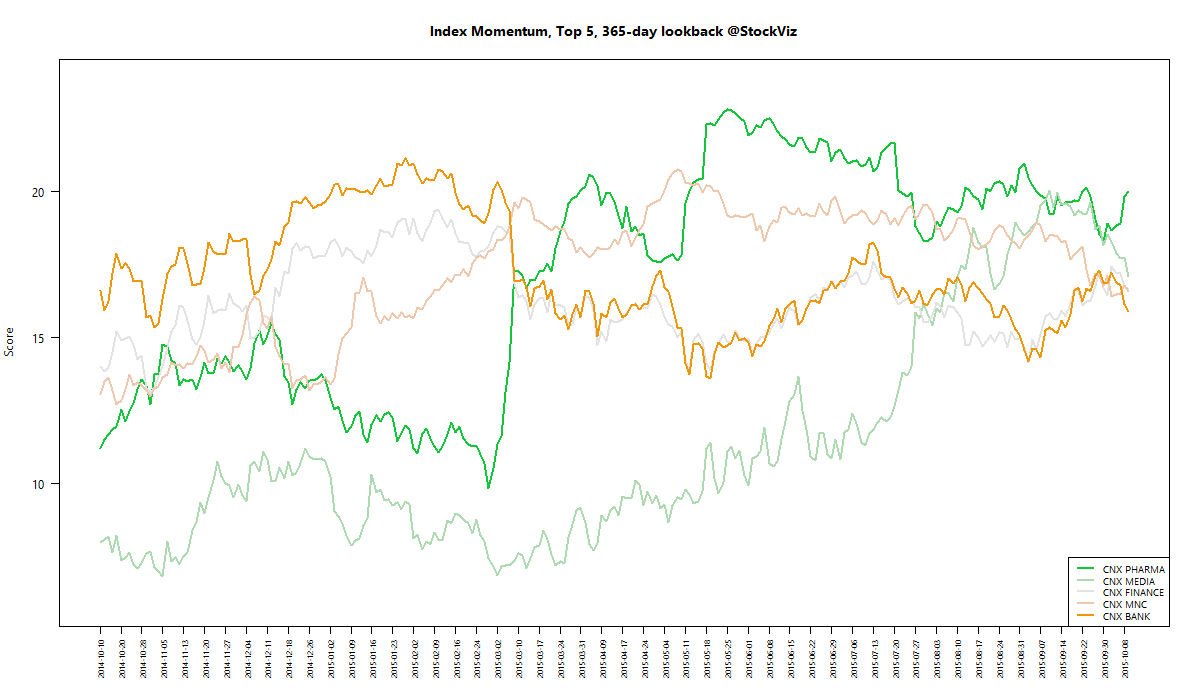
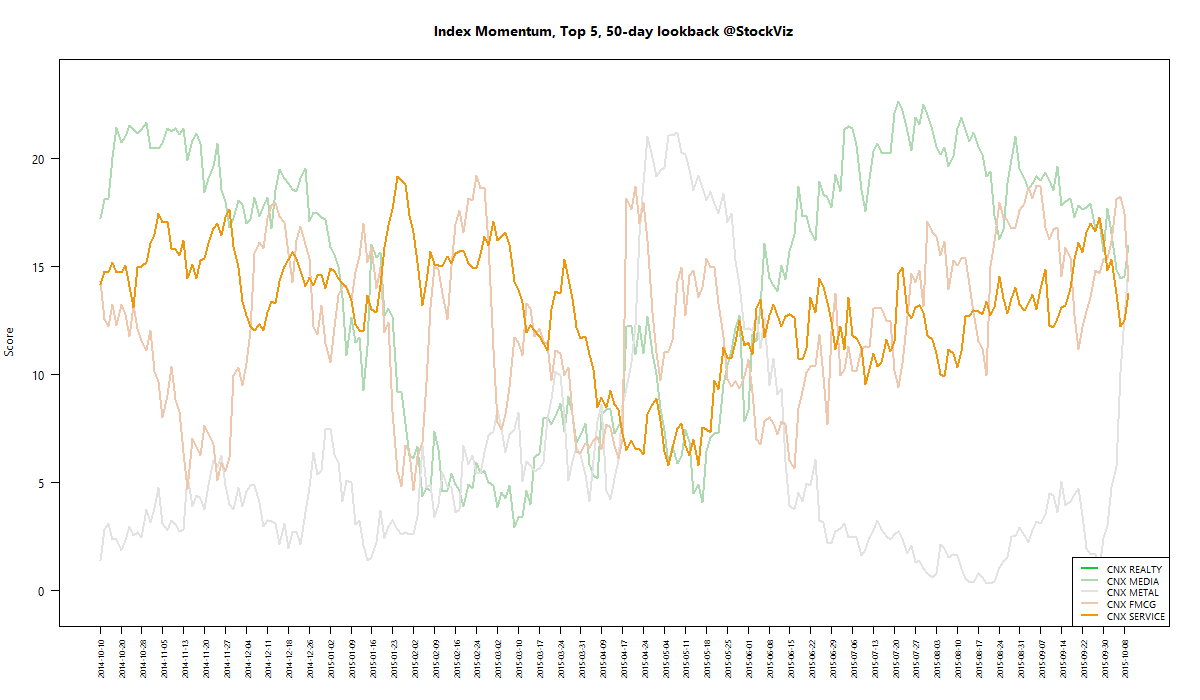
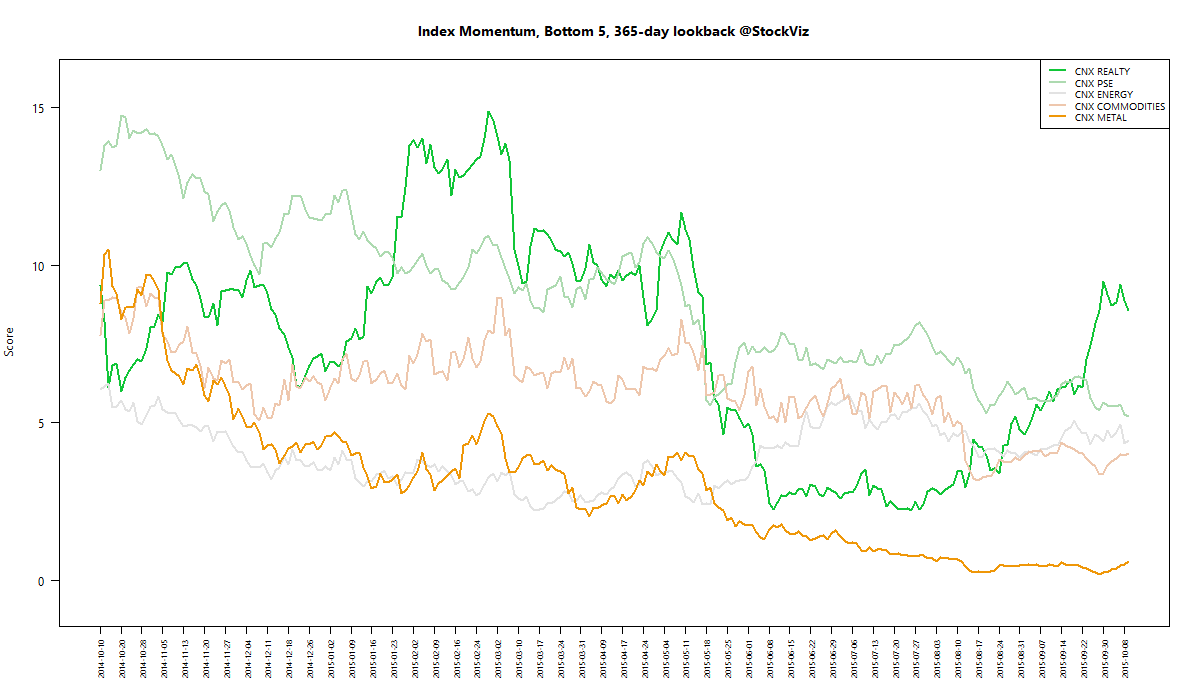
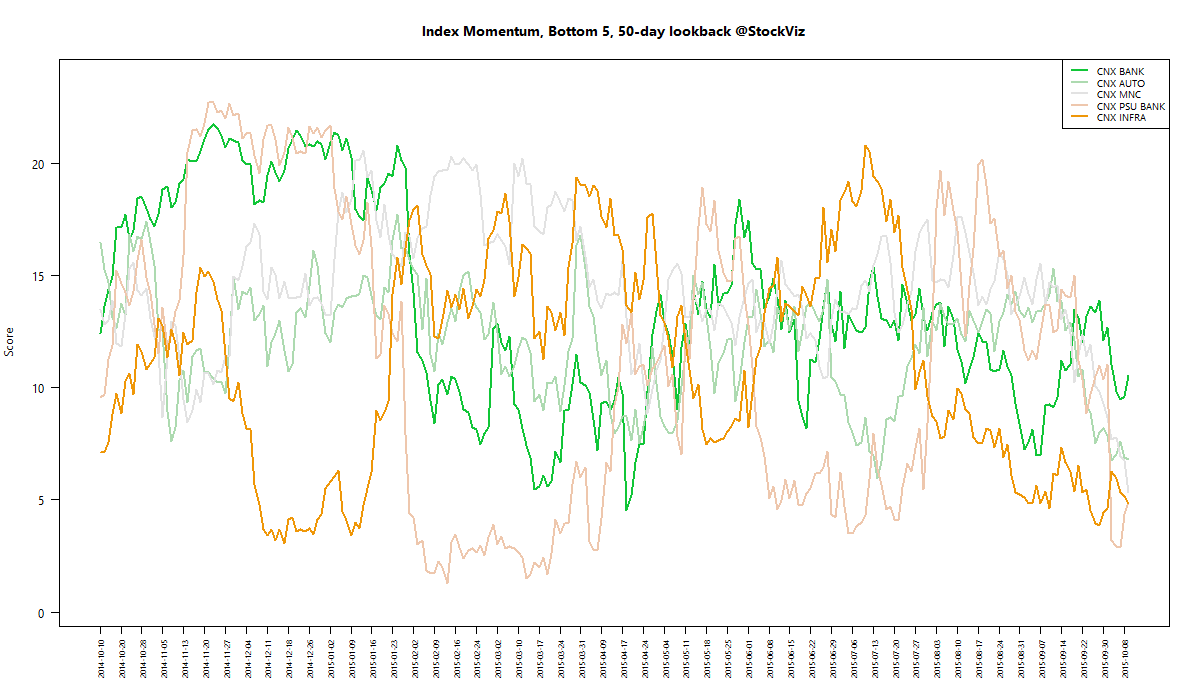
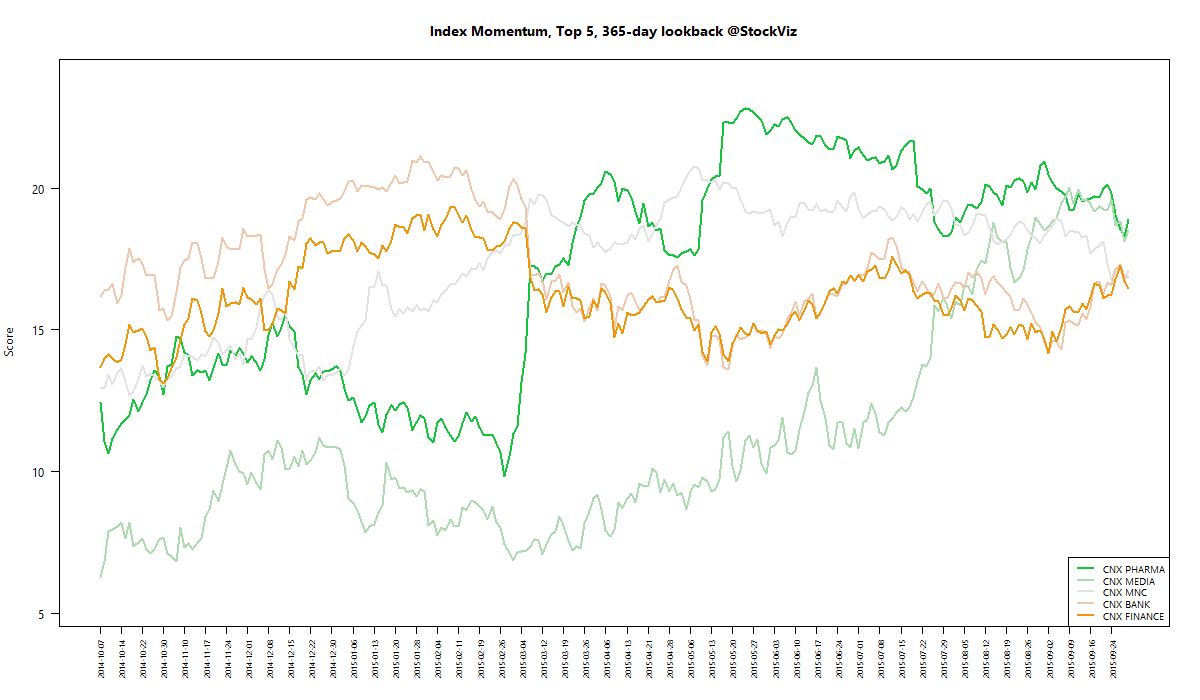
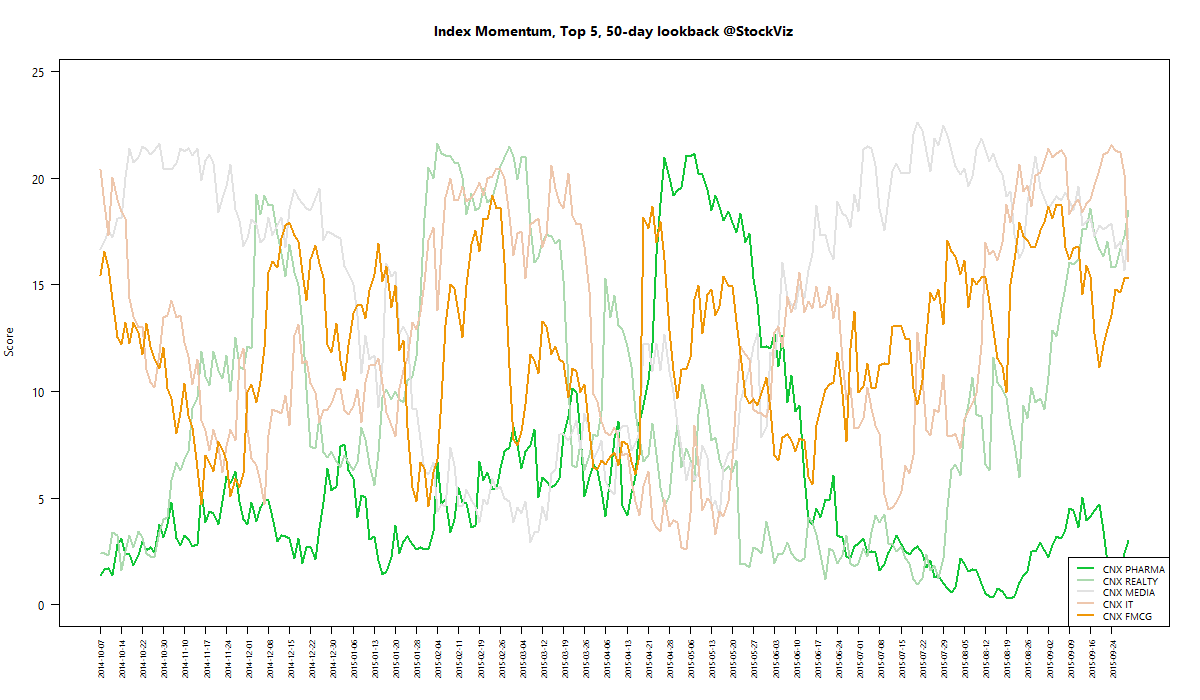
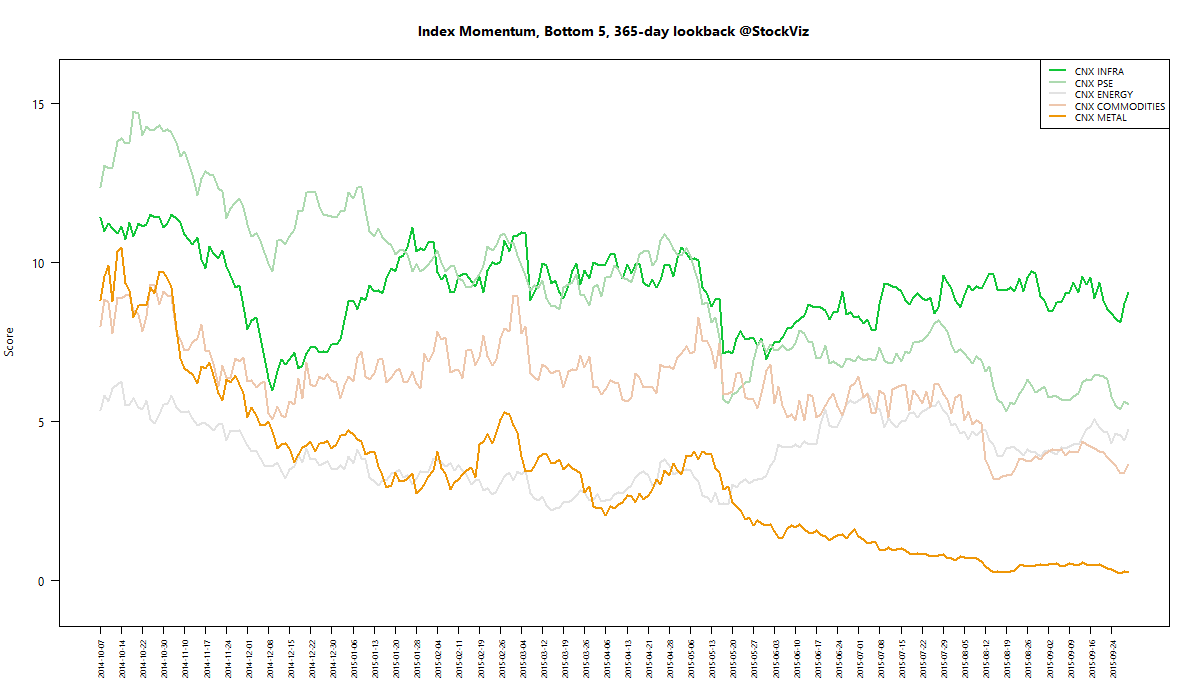
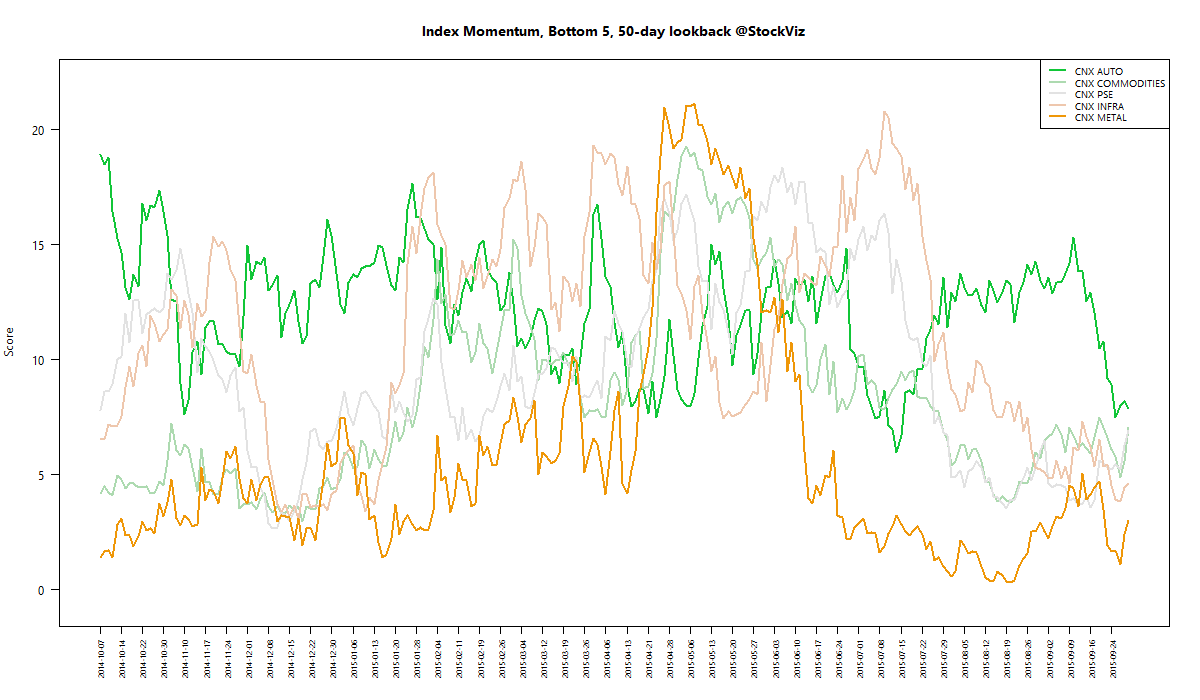
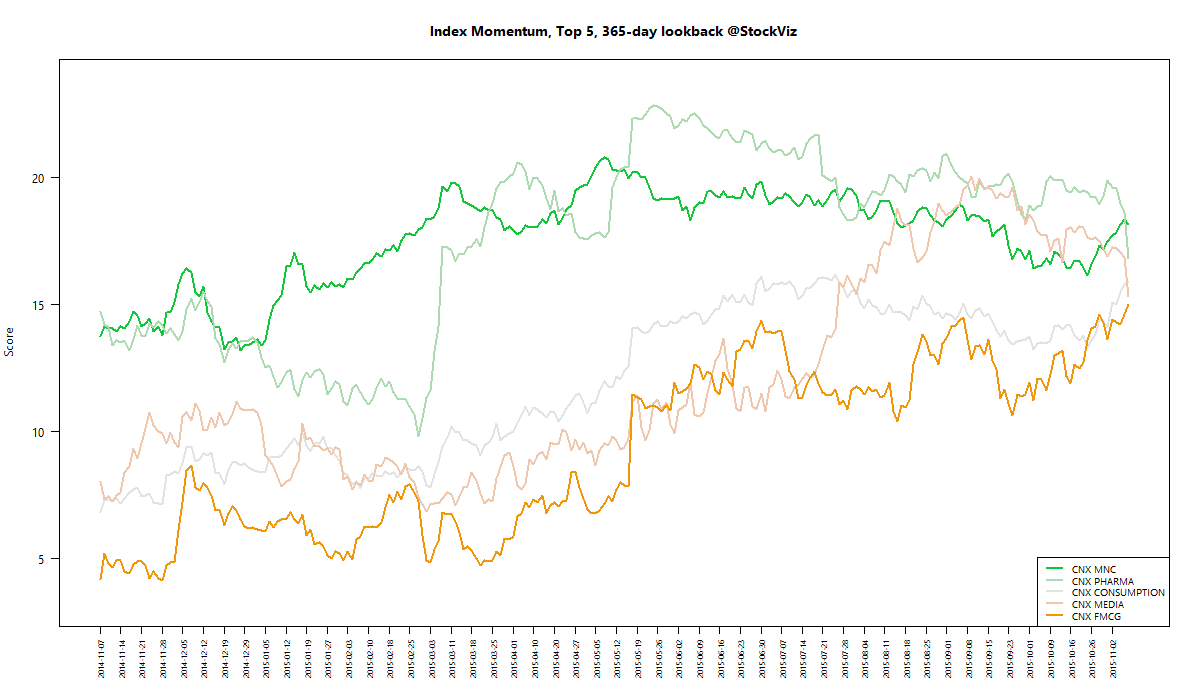
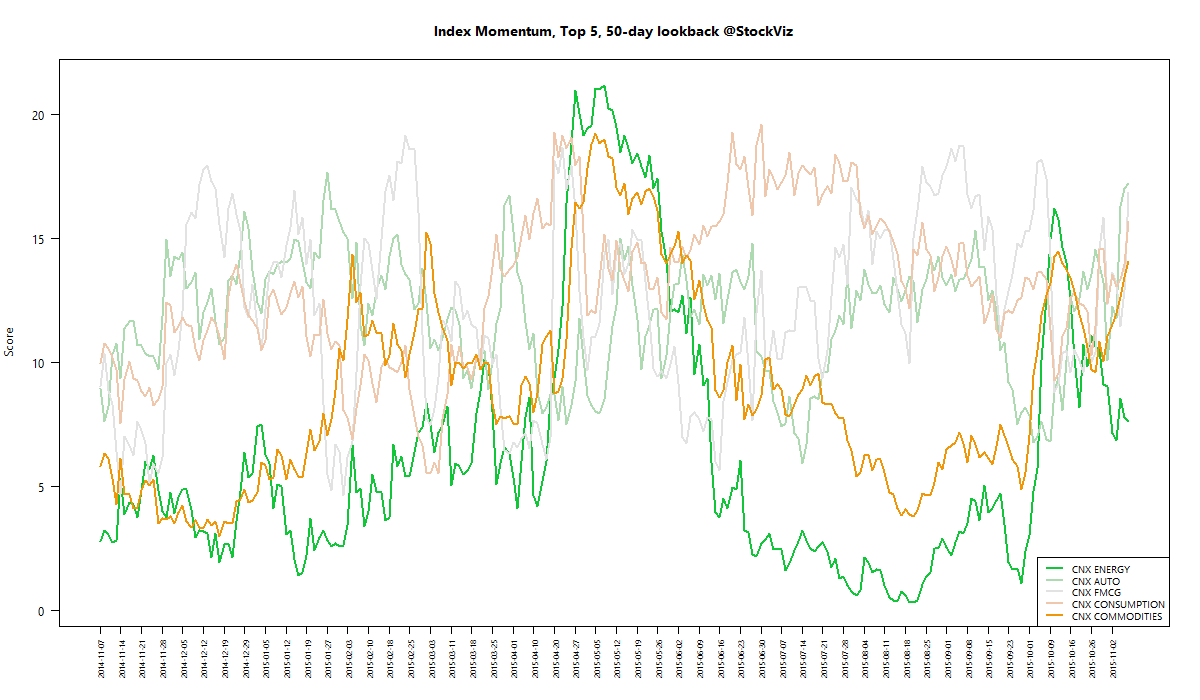
We run our proprietary momentum scoring algorithm on indices just like we do on stocks. You can use the momentum scores of sub-indices to get a sense for which sectors have the wind on their backs and those that are facing headwinds.
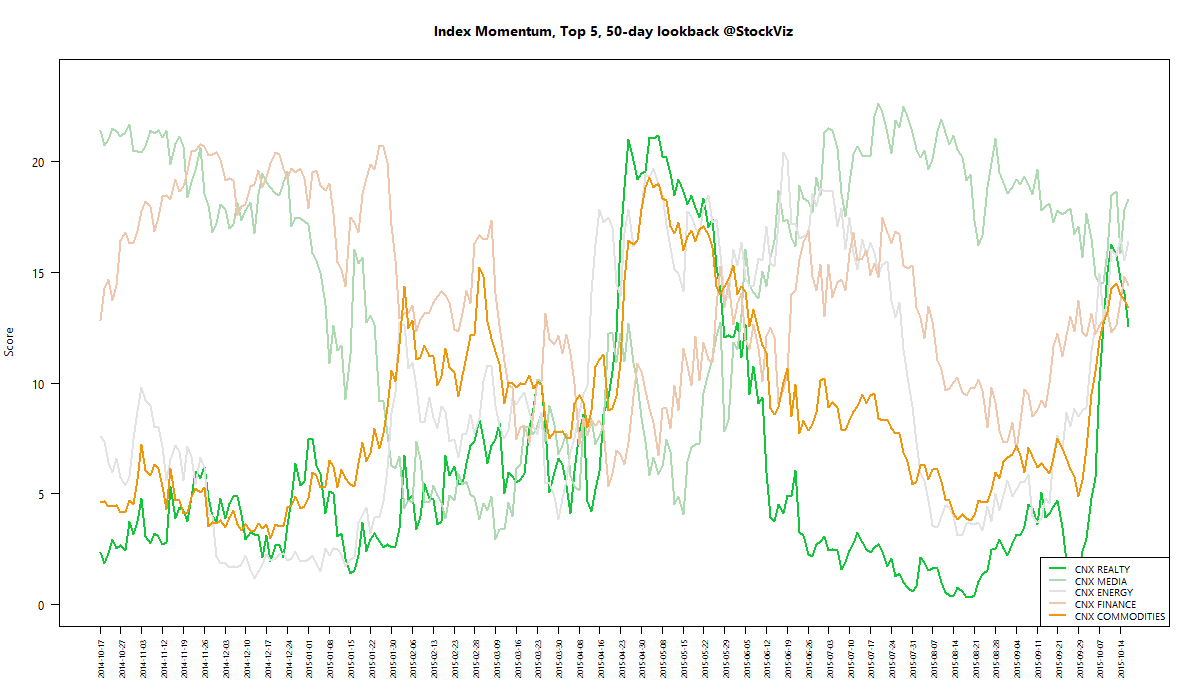
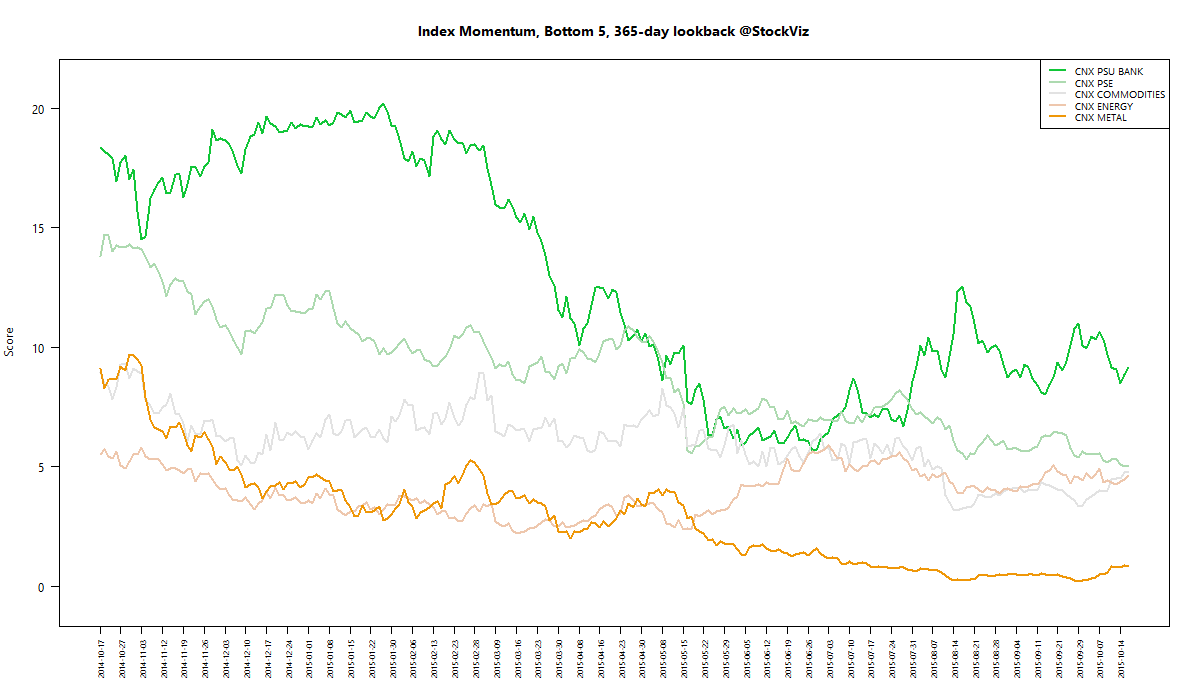
Traders can pick their longs in sectors with high short-term momentum and their shorts in sectors with low momentum. Investors can use the longer lookback scores to position themselves using our re-factored index Themes.
You can see how the momentum algorithm has performed on individual stocks here.
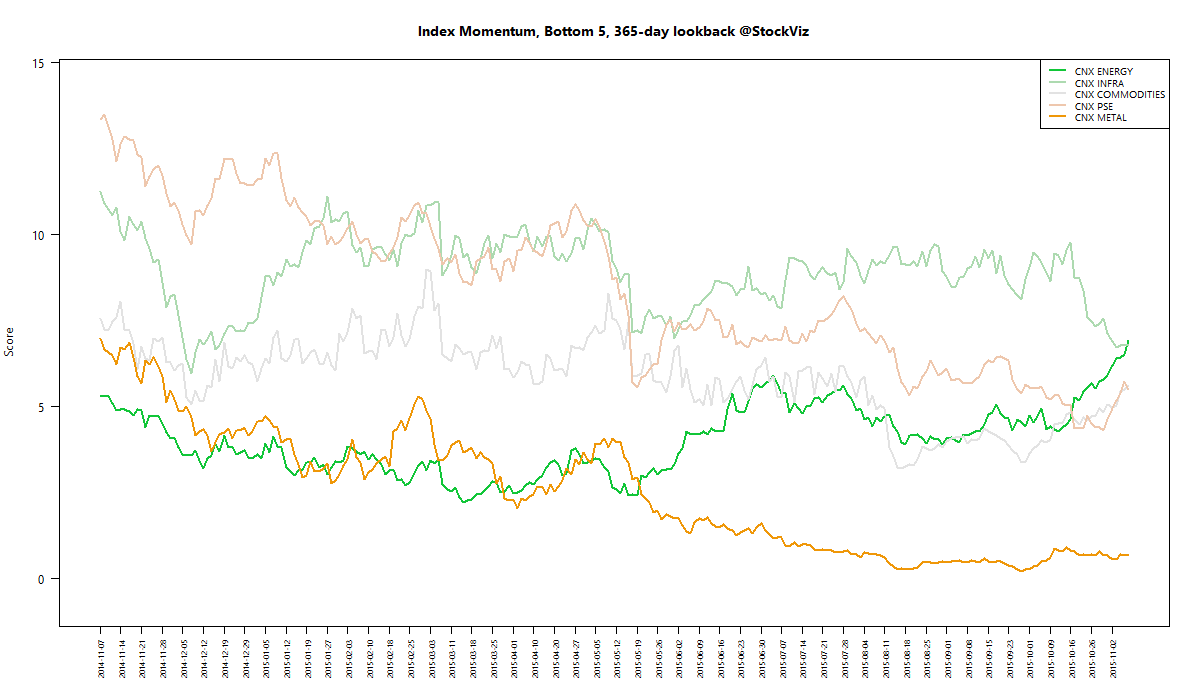
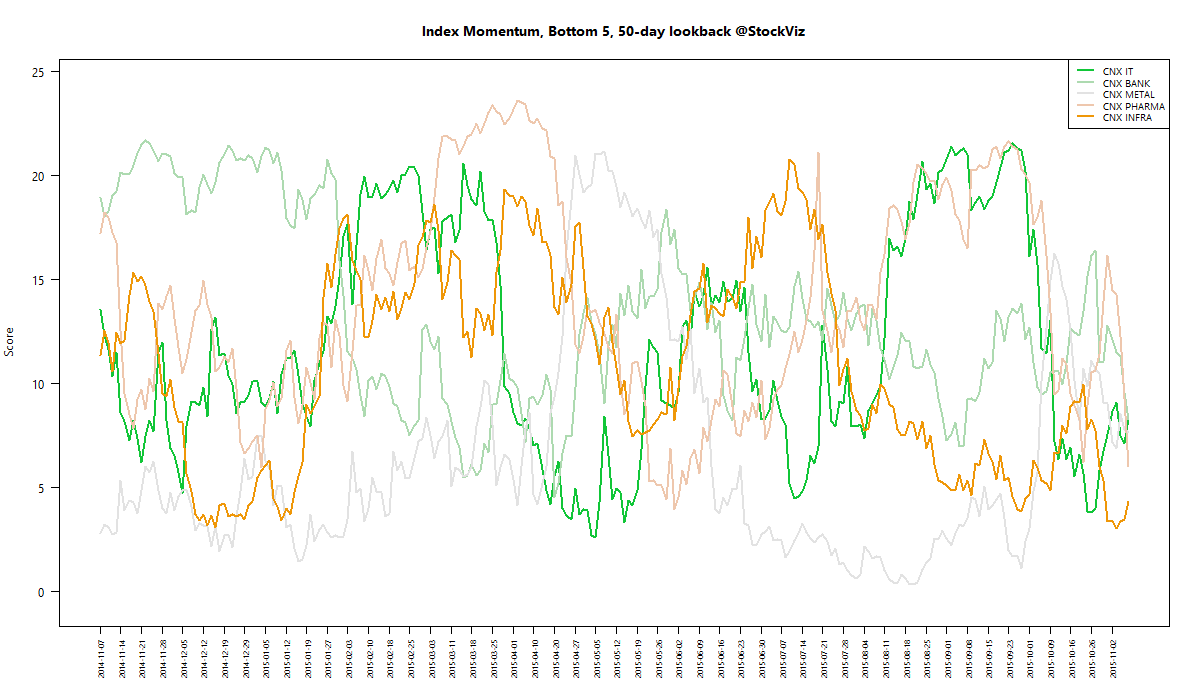
Here are the best and the worst sub-indices:
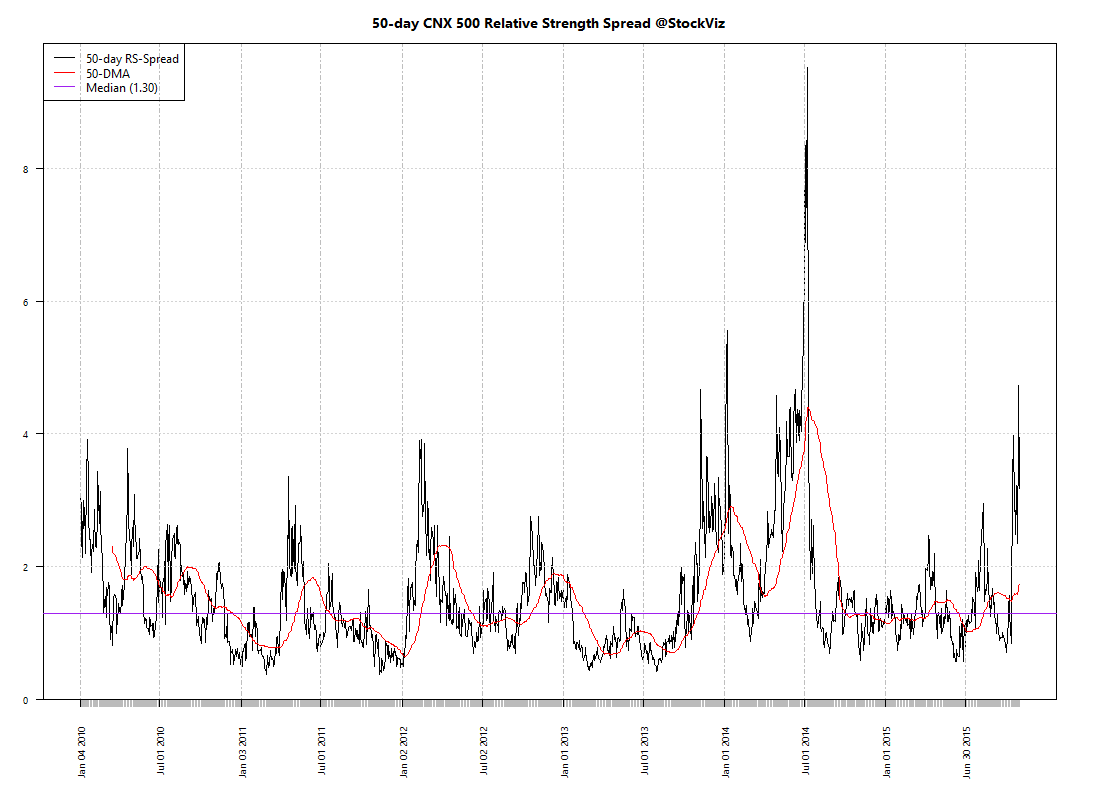
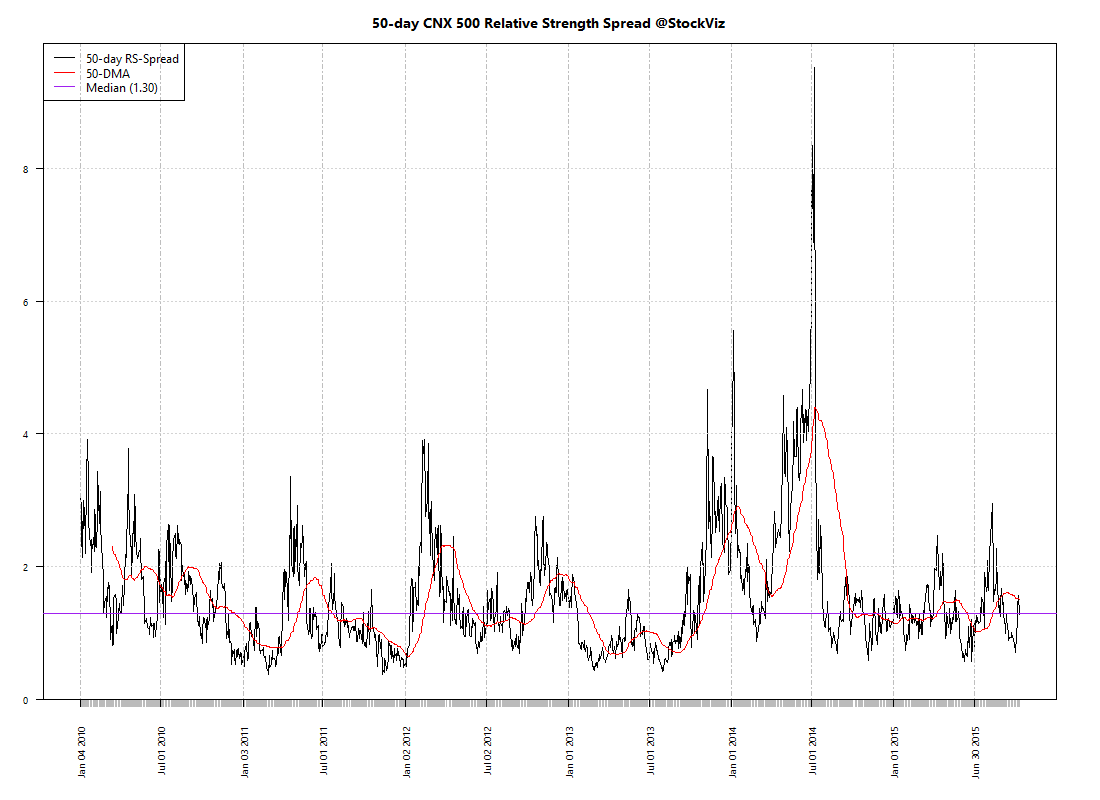
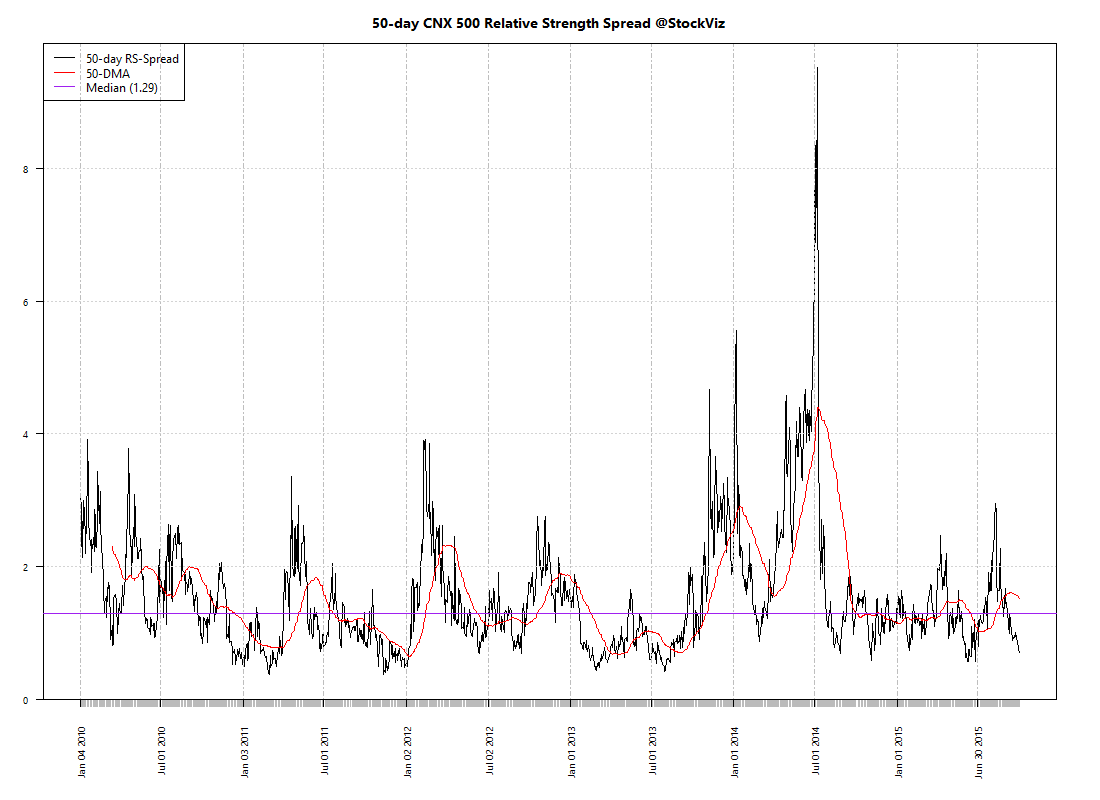
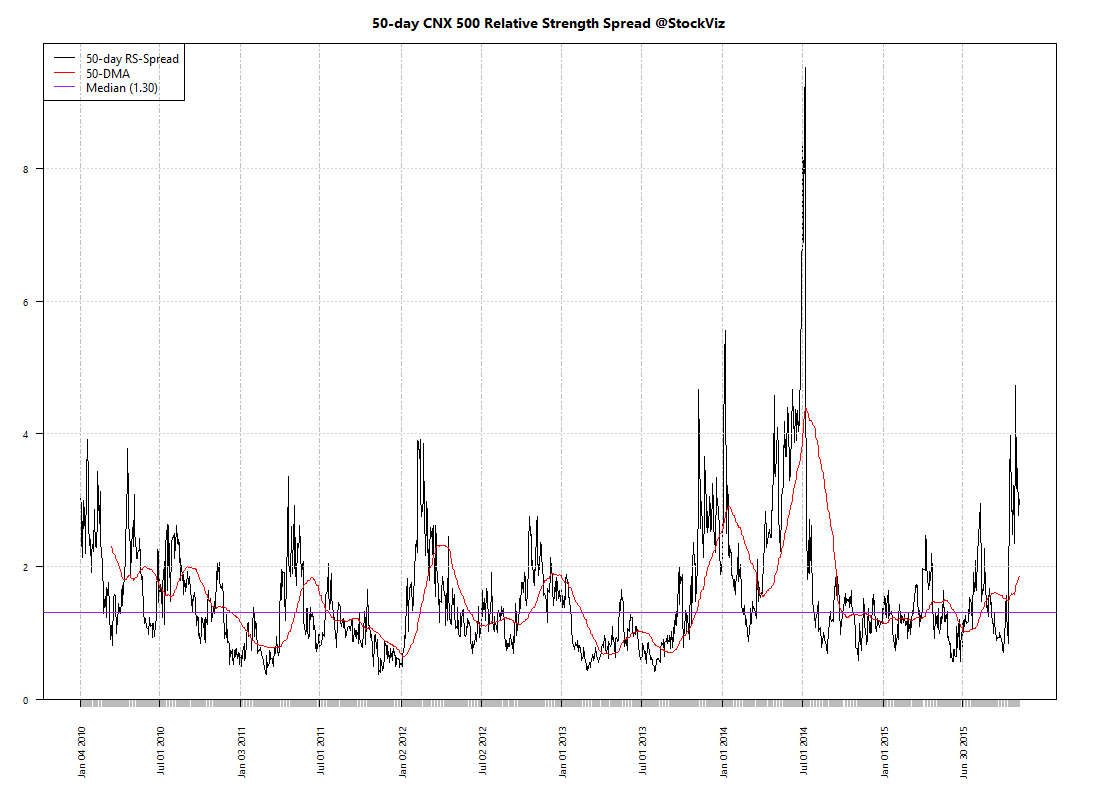
Relative Strength Spread
Refactored Index Performance
50-day performance, from August 25, 2015 through November 06, 2015:
Trend Model Summary
| Index | Signal | % From Peak | Day of Peak |
|---|---|---|---|
| CNX AUTO | SHORT |
10.50
|
2015-Jan-27
|
| CNX BANK | LONG |
16.88
|
2015-Jan-27
|
| CNX COMMODITIES | SHORT |
35.50
|
2008-Jan-04
|
| CNX CONSUMPTION | SHORT |
6.49
|
2015-Aug-05
|
| CNX ENERGY | SHORT |
32.00
|
2008-Jan-14
|
| CNX FMCG | LONG |
9.17
|
2015-Feb-25
|
| CNX INFRA | LONG |
55.66
|
2008-Jan-09
|
| CNX IT | SHORT |
87.97
|
2000-Feb-21
|
| CNX MEDIA | LONG |
20.59
|
2008-Jan-04
|
| CNX METAL | LONG |
68.69
|
2008-Jan-04
|
| CNX MNC | SHORT |
9.63
|
2015-Aug-10
|
| CNX NIFTY | LONG |
11.58
|
2015-Mar-03
|
| CNX PHARMA | LONG |
11.60
|
2015-Apr-08
|
| CNX PSE | LONG |
34.06
|
2008-Jan-04
|
| CNX PSU BANK | LONG |
42.26
|
2010-Nov-05
|
| CNX REALTY | LONG |
90.82
|
2008-Jan-14
|
| CNX SERVICE | LONG |
12.09
|
2015-Mar-03
|
The DRL fiasco dinged the last samurai. Will FMCG lead from hear on out?