Brought to you by ViewGenesis
Tag: weekly
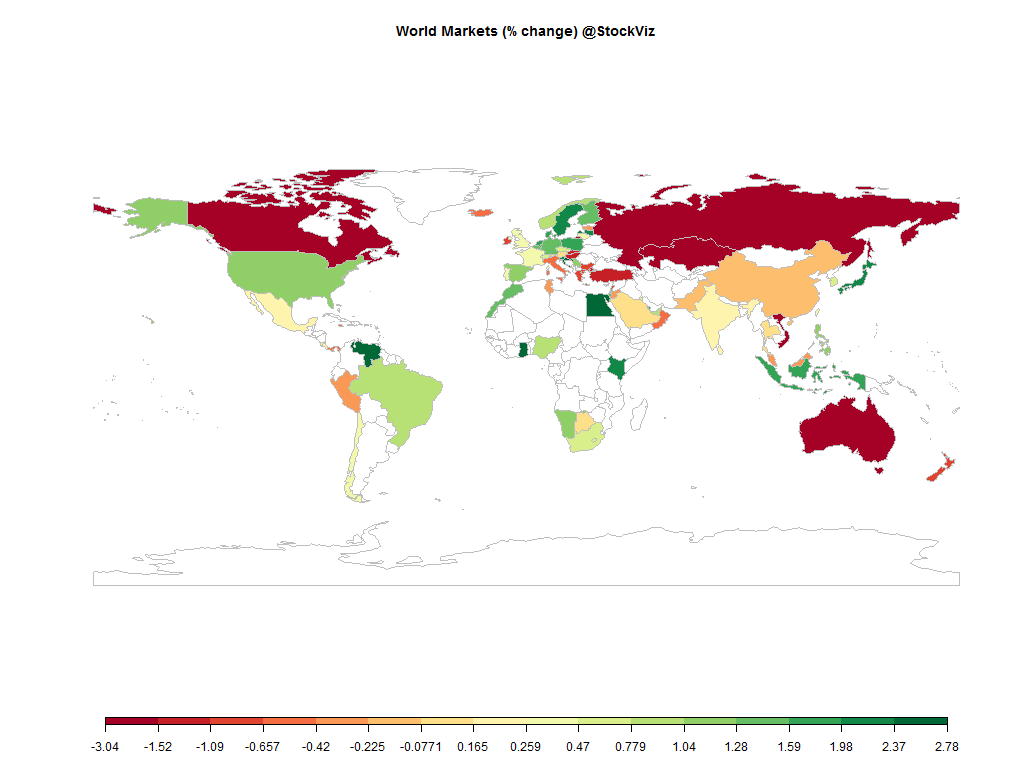
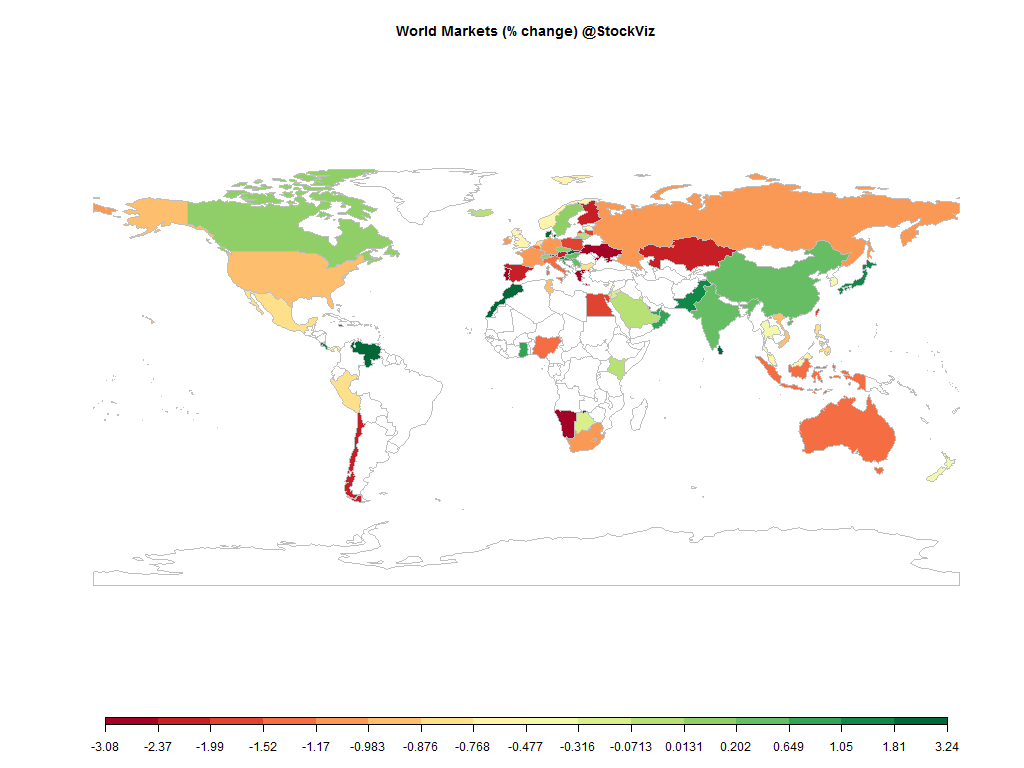
Equities
| MINTs | |
|---|---|
| JCI(IDN) | +1.63% |
| INMEX(MEX) | +0.20% |
| NGSEINDX(NGA) | +0.93% |
| XU030(TUR) | -1.10% |
| BRICS | |
|---|---|
| IBOV(BRA) | +0.90% |
| SHCOMP(CHN) | -0.11% |
| NIFTY(IND) | +0.20% |
| INDEXCF(RUS) | -1.85% |
| TOP40(ZAF) | +0.65% |
Commodities
| Energy | |
|---|---|
| Brent Crude Oil | +1.06% |
| Ethanol | -9.04% |
| Heating Oil | -1.02% |
| Natural Gas | +0.03% |
| RBOB Gasoline | +3.15% |
| WTI Crude Oil | +0.06% |
| Metals | |
|---|---|
| Copper | -0.32% |
| Gold 100oz | -0.71% |
| Palladium | -2.65% |
| Platinum | -2.27% |
| Silver 5000oz | -4.30% |
Currencies
| MINTs | |
|---|---|
| USDIDR(IDN) | +1.25% |
| USDMXN(MEX) | -0.29% |
| USDNGN(NGA) | +0.20% |
| USDTRY(TUR) | +1.01% |
| BRICS | |
|---|---|
| USDBRL(BRA) | +1.09% |
| USDCNY(CHN) | +0.09% |
| USDINR(IND) | +0.28% |
| USDRUB(RUS) | +1.79% |
| USDZAR(ZAF) | +0.69% |
| Agricultural | |
|---|---|
| Cattle | -0.59% |
| Cocoa | +2.78% |
| Coffee (Arabica) | +0.17% |
| Coffee (Robusta) | -2.17% |
| Corn | -0.38% |
| Cotton | -7.18% |
| Feeder Cattle | +0.40% |
| Lean Hogs | +0.09% |
| Lumber | -5.73% |
| Orange Juice | -2.53% |
| Soybean Meal | -25.03% |
| Soybeans | -12.21% |
| Sugar #11 | -2.24% |
| Wheat | -4.43% |
| White Sugar | +4.07% |
Credit Indices
| Index | Change |
|---|---|
| Markit CDX EM | -0.28% |
| Markit CDX NA HY | -0.08% |
| Markit CDX NA IG | -0.35% |
| Markit CDX NA IG HVOL | +0.88% |
| Markit iTraxx Asia ex-Japan IG | +2.32% |
| Markit iTraxx Australia | +1.30% |
| Markit iTraxx Europe | -0.32% |
| Markit iTraxx Europe Crossover | -0.36% |
| Markit iTraxx Japan | -0.21% |
| Markit iTraxx SovX Western Europe | +0.68% |
| Markit LCDX (Loan CDS) | -0.06% |
| Markit MCDX (Municipal CDS) | +3.00% |
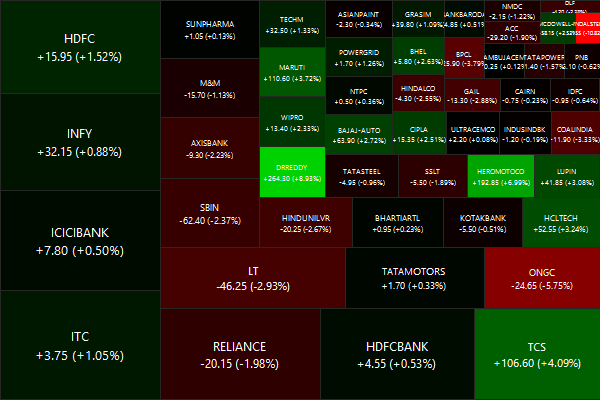
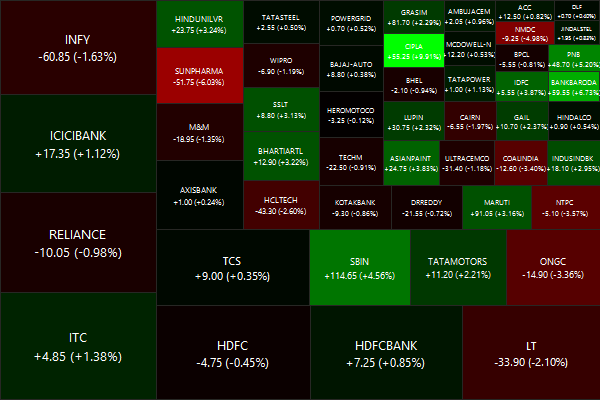
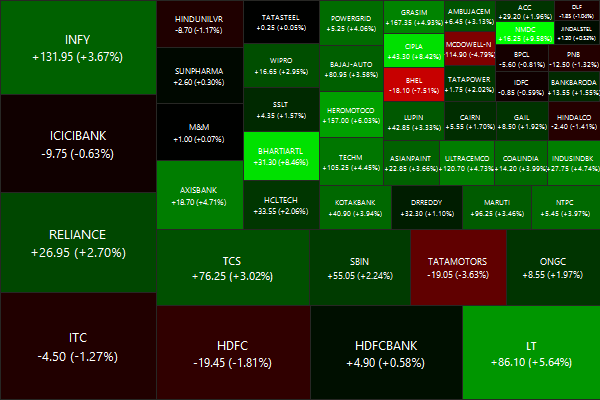
Nifty Heatmap
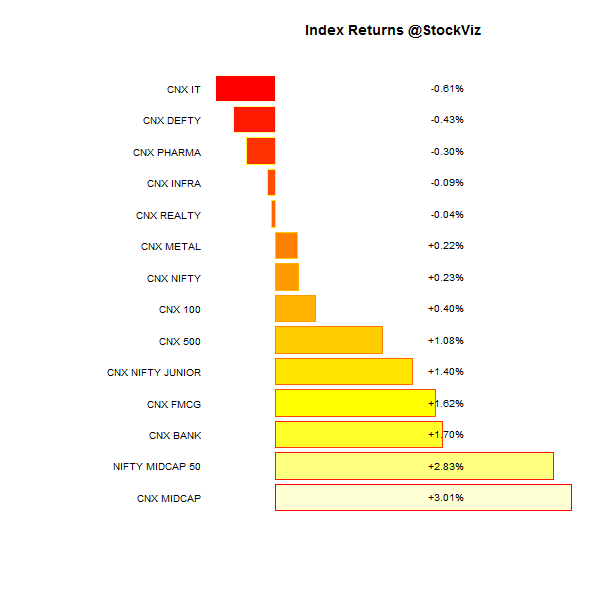
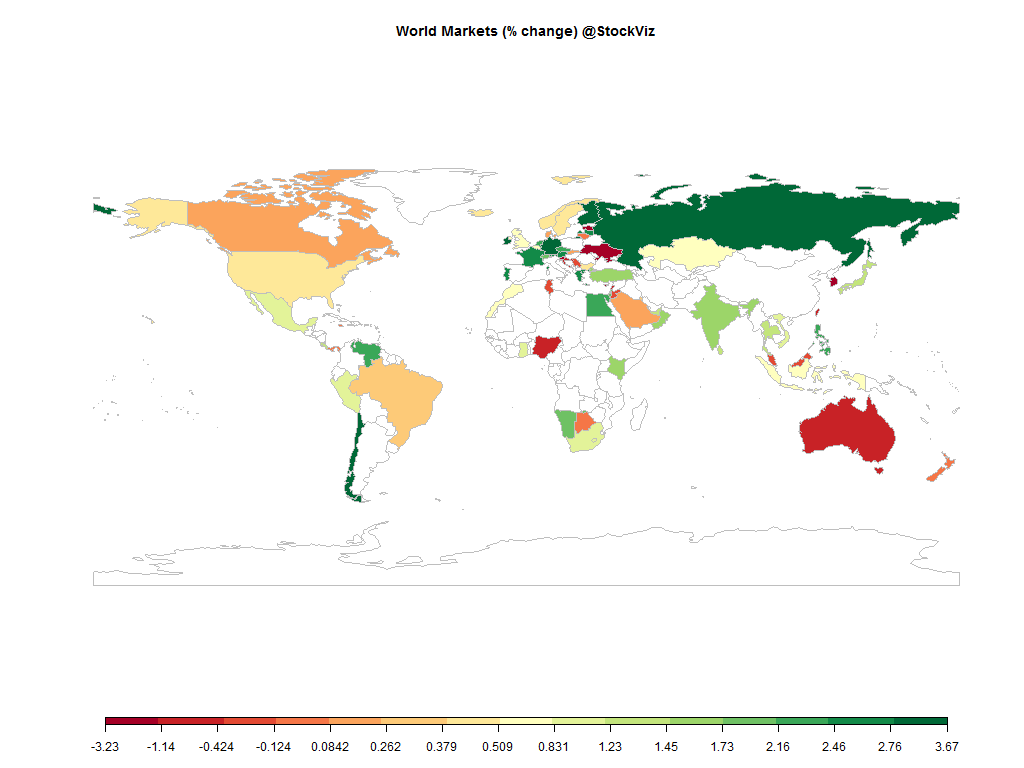
Index Returns
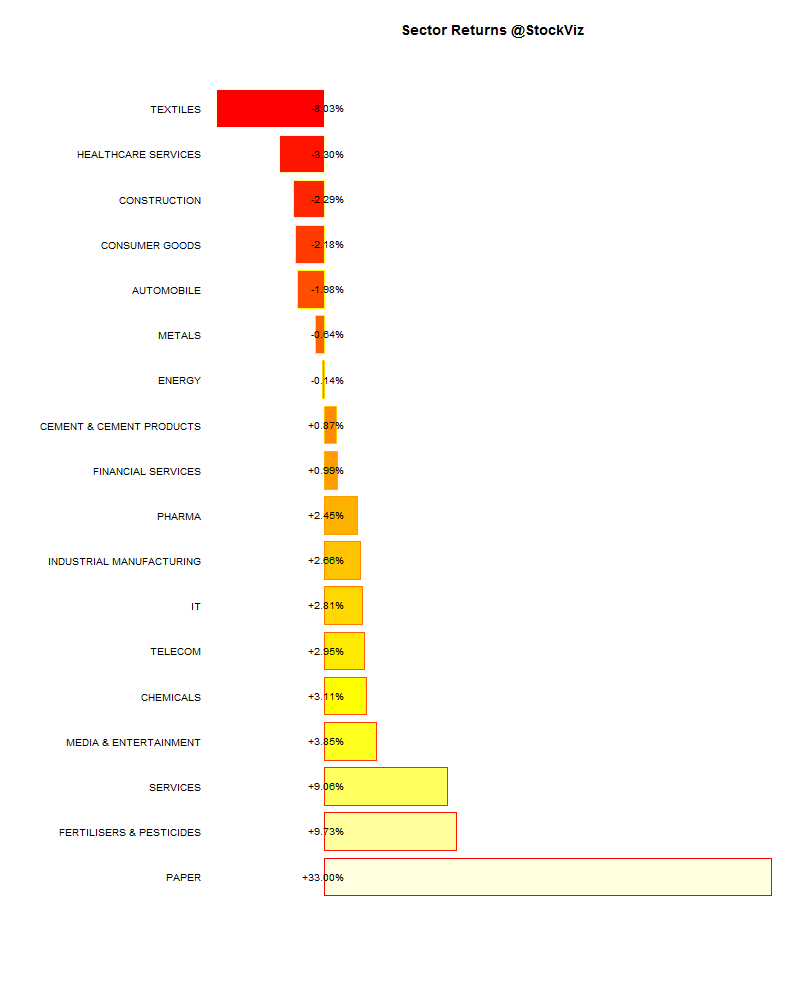
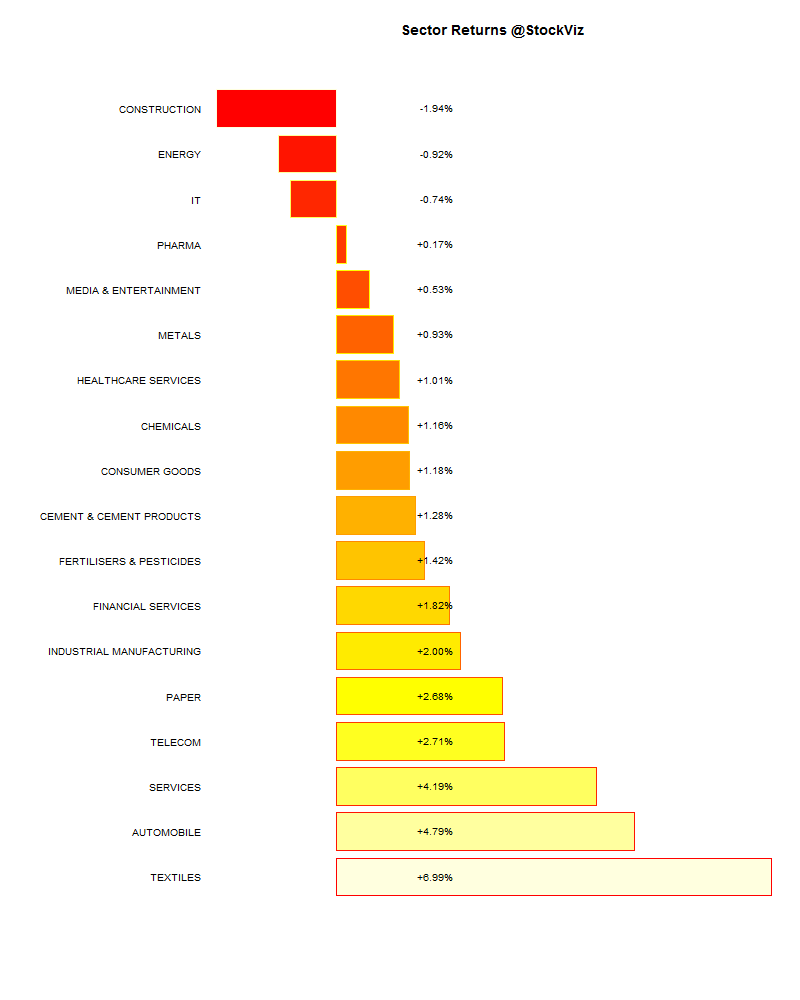
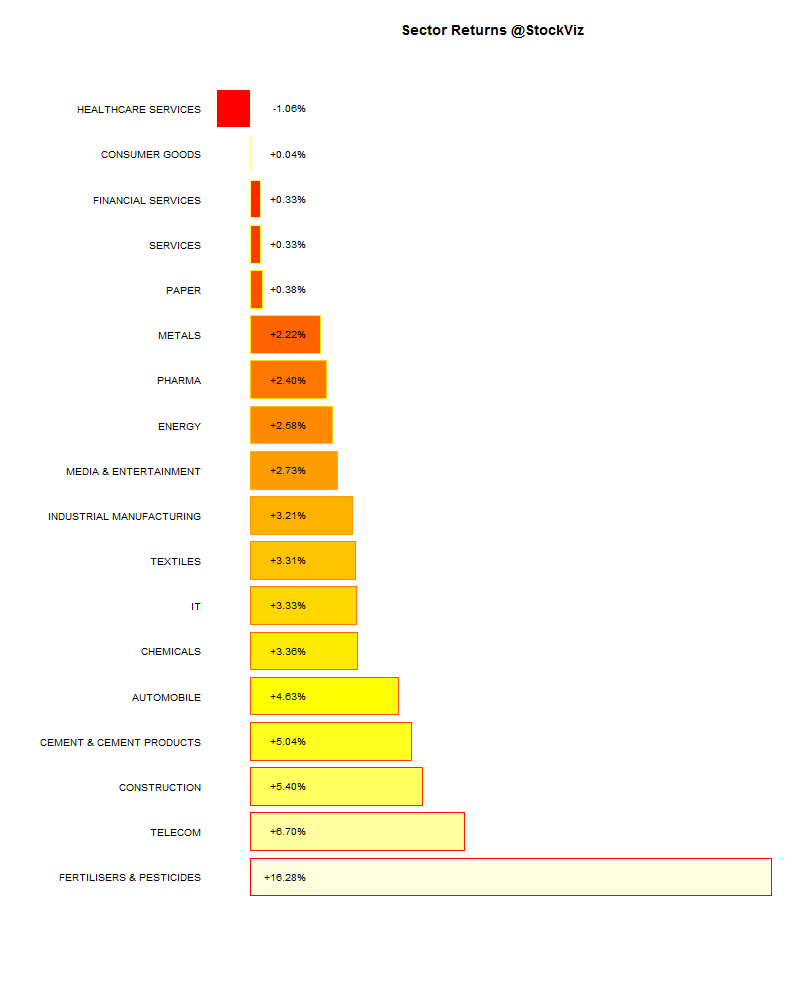
Sector Performance
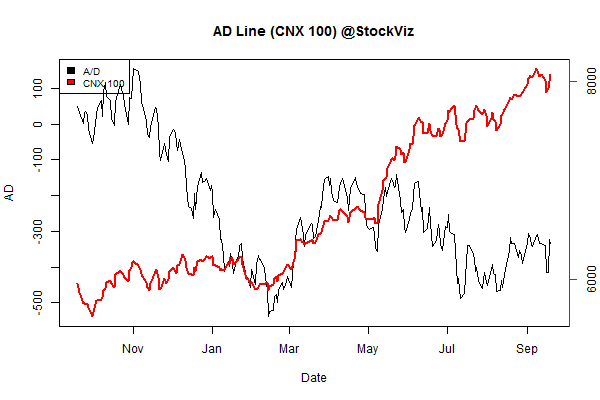
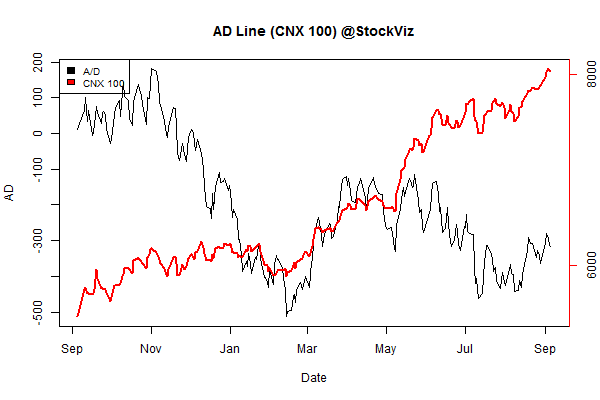
Advance Decline
Market Cap Decile Performance
| Decile | Mkt. Cap. | Adv/Decl |
|---|---|---|
| 1 (micro) | -1.51% | 74/71 |
| 2 | -2.23% | 72/72 |
| 3 | -1.08% | 67/77 |
| 4 | -0.32% | 69/75 |
| 5 | -1.86% | 67/77 |
| 6 | -1.24% | 70/75 |
| 7 | +0.60% | 70/74 |
| 8 | -0.34% | 76/68 |
| 9 | -0.32% | 74/70 |
| 10 (mega) | -0.16% | 67/78 |
Top Winners and Losers
ETFs
| NIFTYBEES | +0.30% |
| INFRABEES | +0.27% |
| JUNIORBEES | -0.80% |
| GOLDBEES | -0.82% |
| BANKBEES | -0.88% |
| CPSEETF | -3.84% |
| PSUBNKBEES | -3.92% |
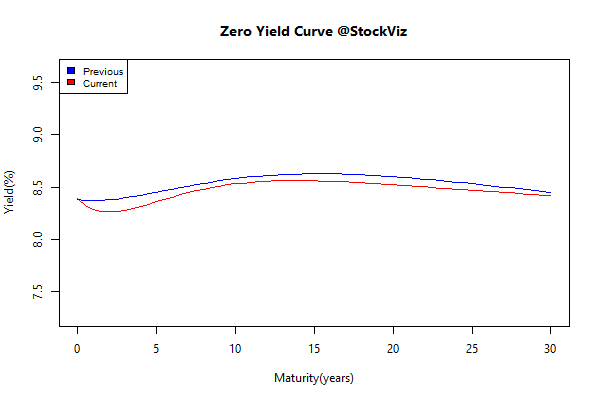
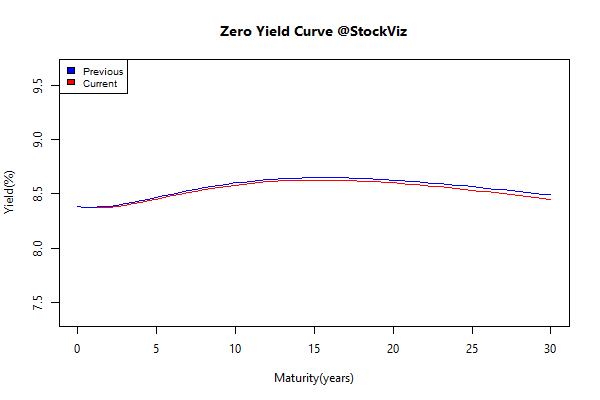
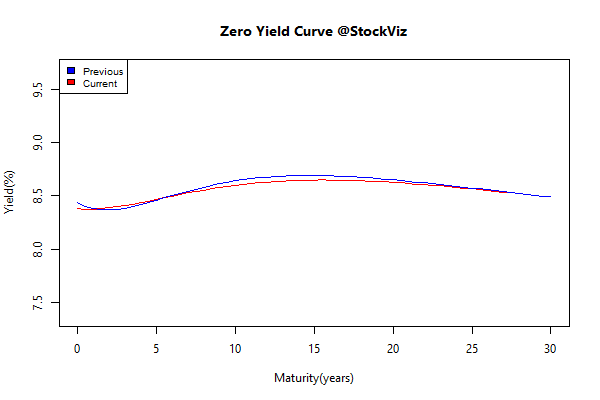
Yield Curve
Bond Indices
| Sub Index | Change in YTM | Total Return(%) |
|---|---|---|
| GSEC TB | +0.36 | +0.06% |
| GSEC SUB 1-3 | +0.31 | -0.28% |
| GSEC SUB 3-8 | +0.08 | -0.01% |
| GSEC SUB 8 | -0.06 | +0.78% |
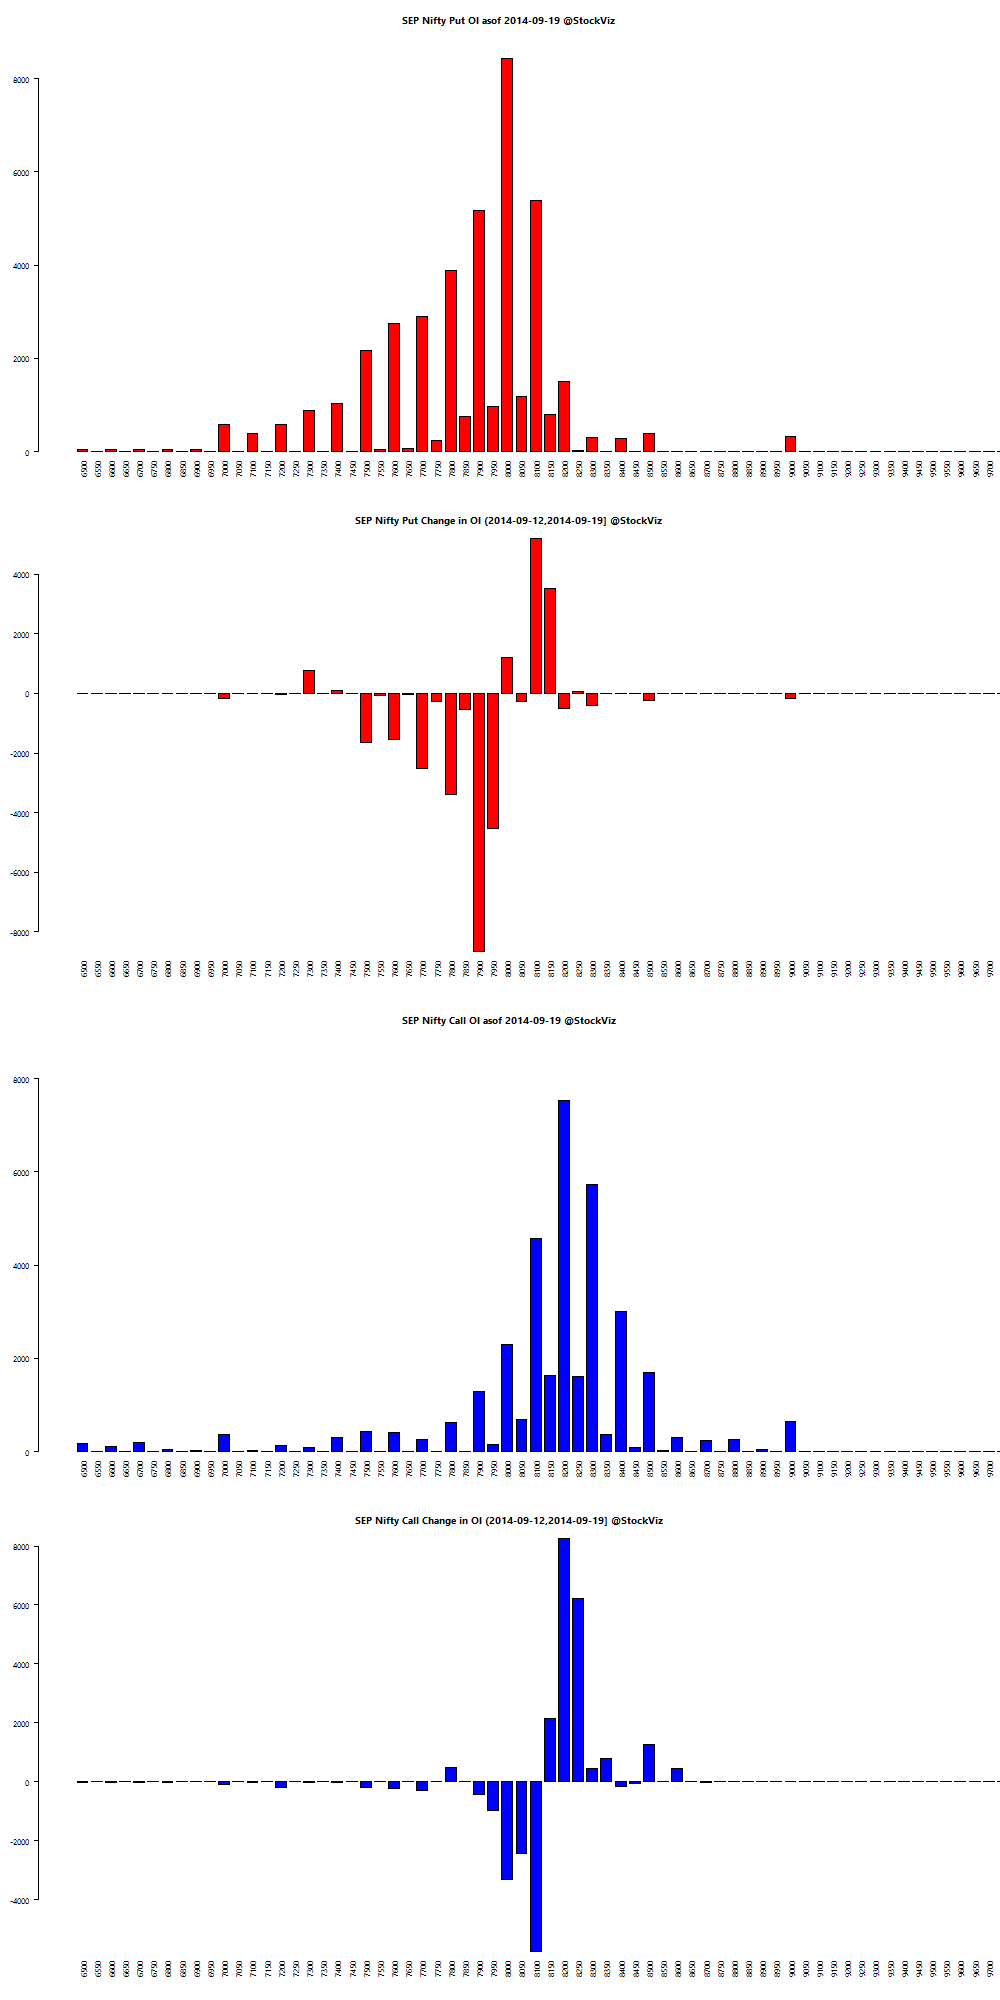
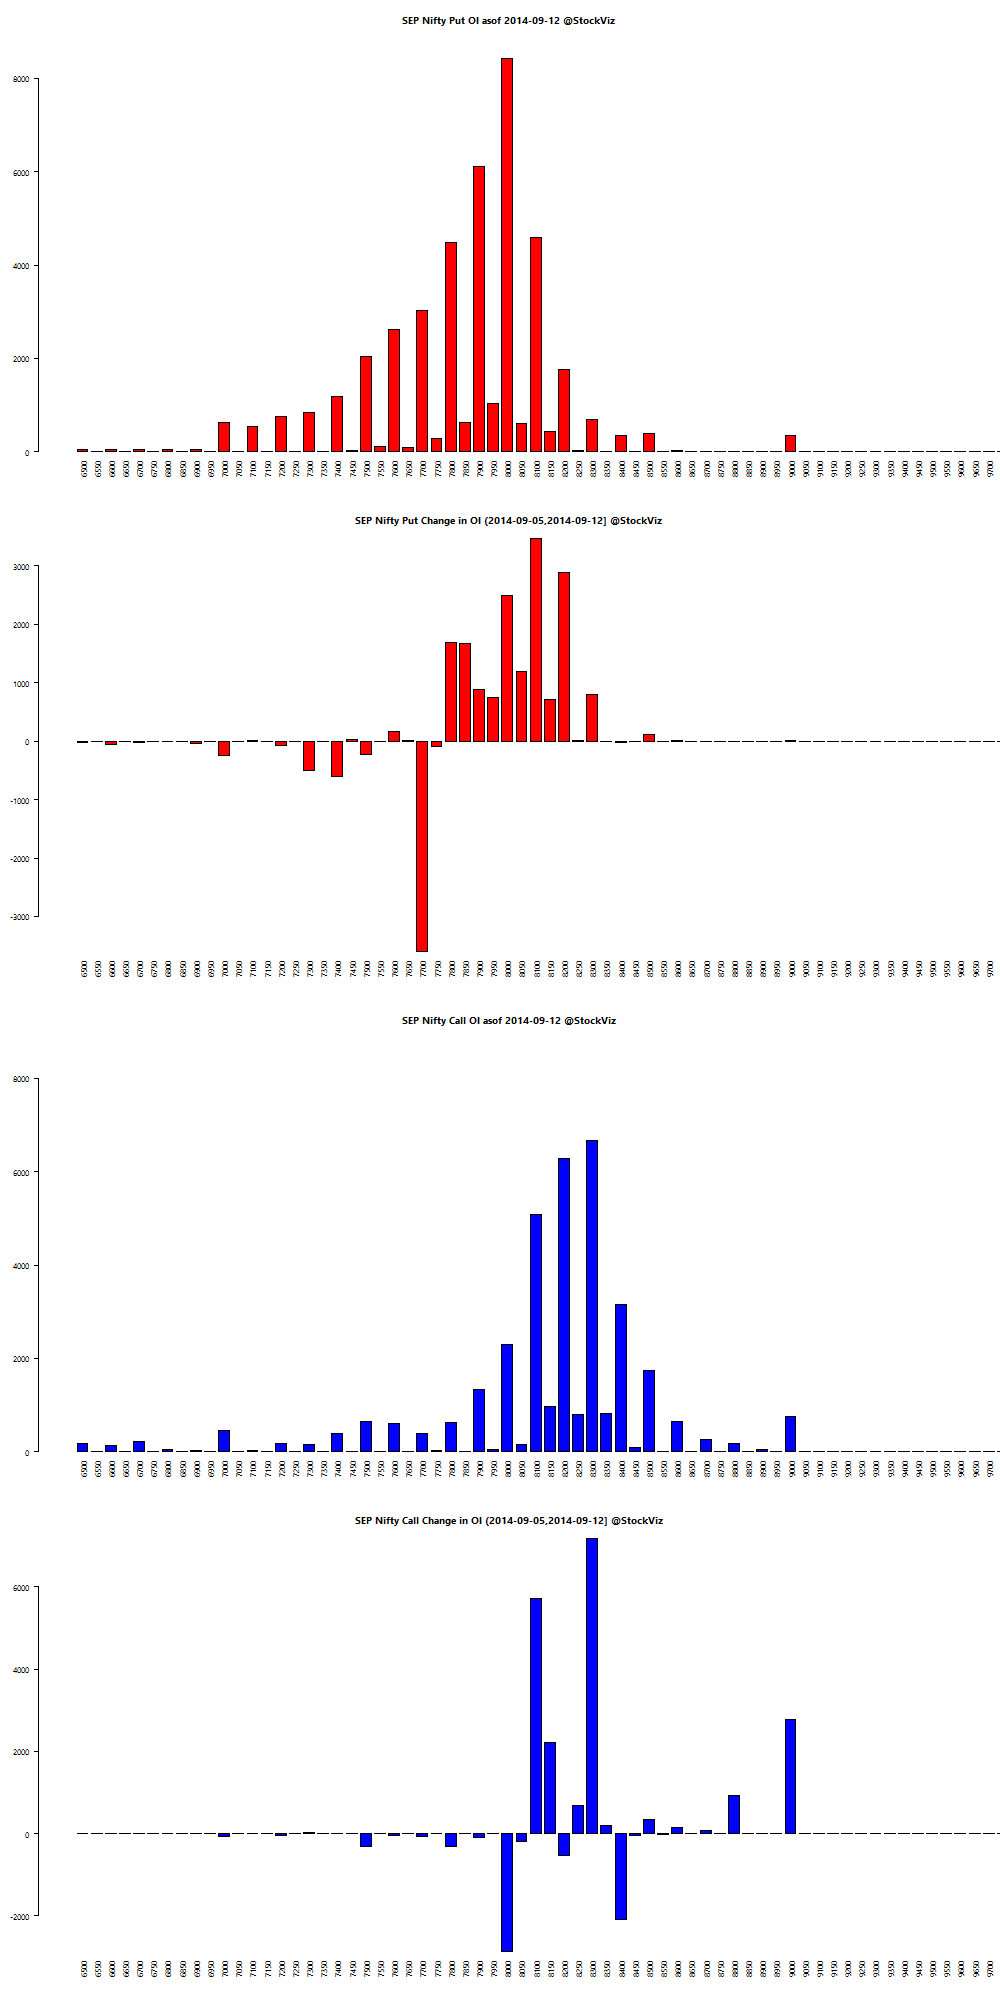
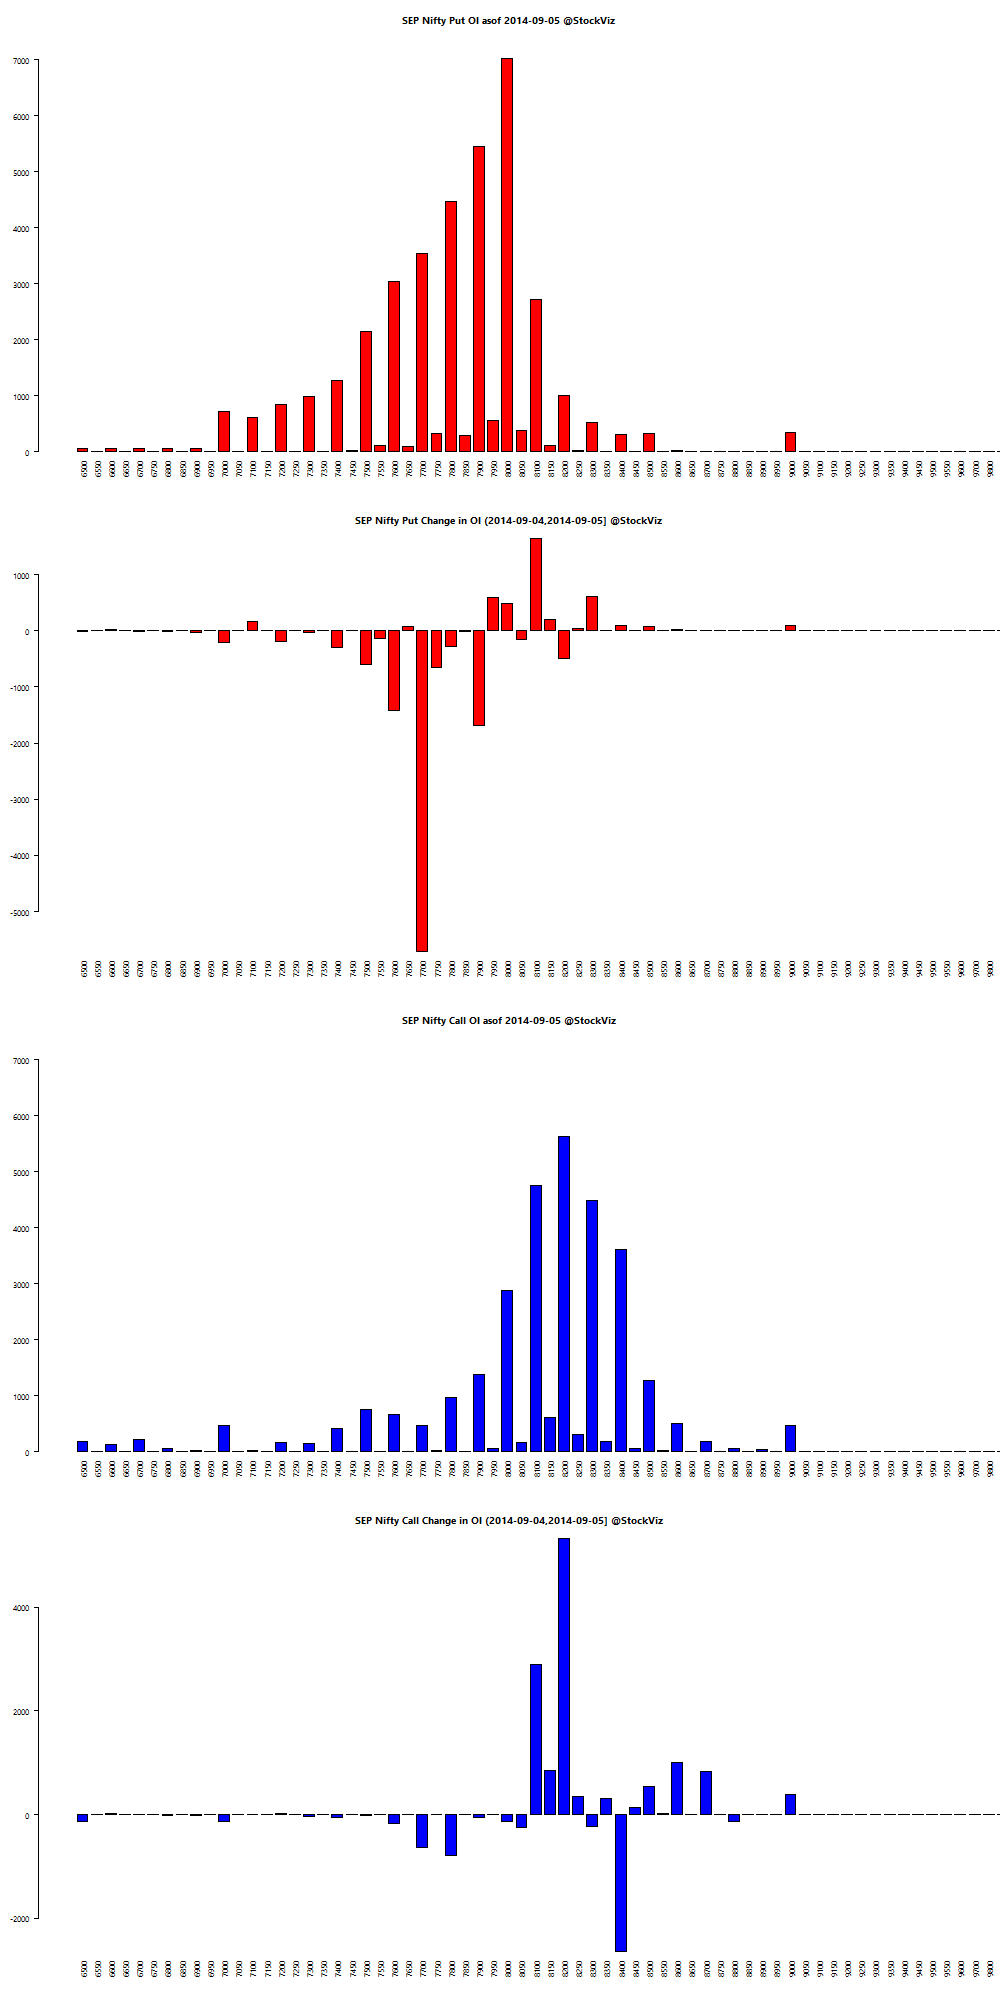
Nifty OI
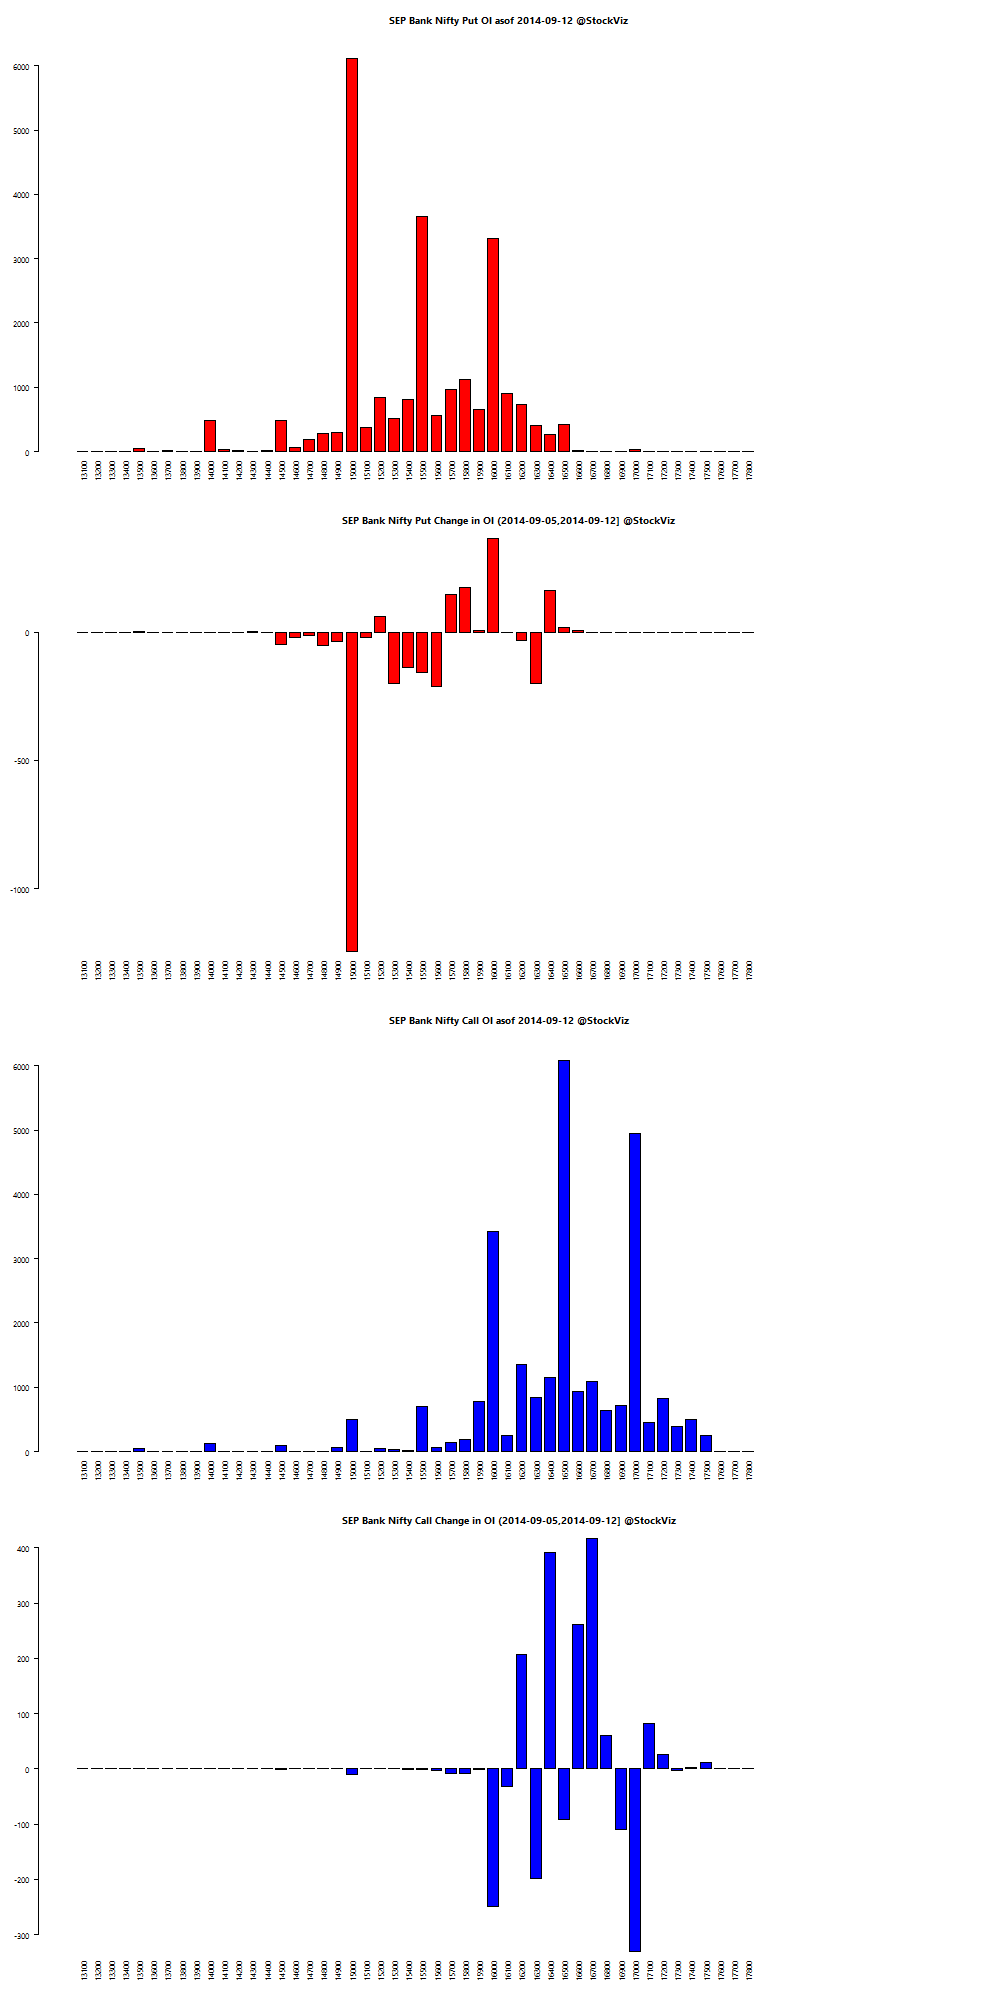
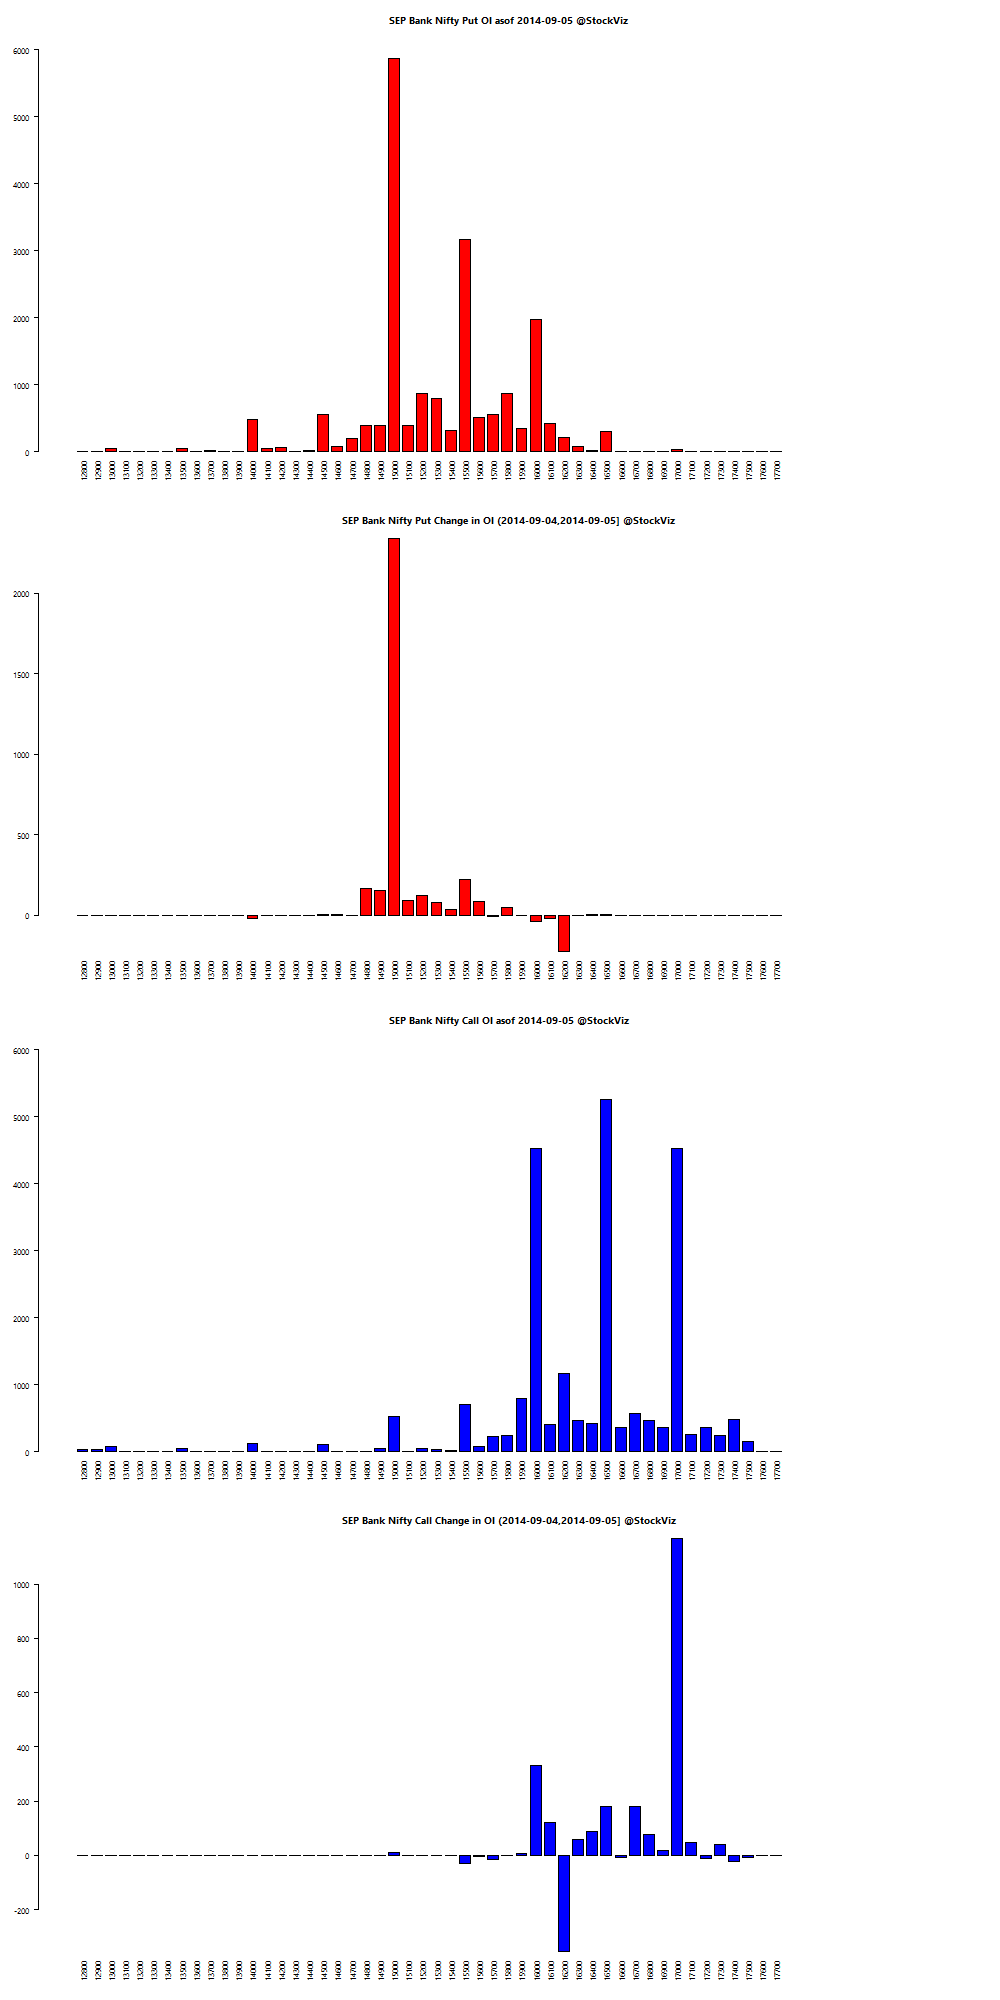
Bank Nifty OI
Theme Performance
| IT 3rd Benchers | +2.54% |
| Quality to Price | +2.51% |
| Market Elephants | +2.51% |
| Enterprise Yield | +1.70% |
| Efficient Growth | +1.13% |
| Magic Formula Investing | +0.31% |
| Financial Strength Value | -0.08% |
| Momentum 200 | -0.15% |
| CNX 100 50-Day Tactical | -0.26% |
| Refract: PPFAS Long Term Value Fund | -0.30% |
| Balance-sheet Strength | -0.57% |
| Piotroski ROC Small Caps | -0.80% |
| Growth with Moat | -1.00% |
| Market Fliers | -1.94% |
| Industrial Value | -3.63% |
| ADAG Mania | -4.60% |
Thought for the weekend
The real challenge to Adam Smith’s invisible hand is rooted in the very logic of the competitive process itself.
Charles Darwin was one of the first to perceive the underlying problem clearly. One of his central insights was that natural selection favors traits and behaviors primarily according to their effect on individual organisms, not larger groups. Sometimes individual and group interests coincide and in such cases we often get invisible hand-like results.
In other cases, however, mutations that help the individual prove quite harmful to the larger group. This is in fact the expected result for mutations that confer advantage in head-to-head competition among members of the same species. This conflict pervades human interactions when individual rewards depend on relative performance.
Source: The Darwin Economy – Why Smith’s Invisible Hand Breaks Down
Equities
| MINTs | |
|---|---|
| JCI(IDN) | -1.41% |
| INMEX(MEX) | -0.80% |
| NGSEINDX(NGA) | -1.18% |
| XU030(TUR) | -5.87% |
| BRICS | |
|---|---|
| IBOV(BRA) | -6.00% |
| SHCOMP(CHN) | +0.24% |
| NIFTY(IND) | +0.23% |
| INDEXCF(RUS) | -1.01% |
| TOP40(ZAF) | -1.13% |
Commodities
| Energy | |
|---|---|
| Brent Crude Oil | -3.51% |
| Ethanol | -9.71% |
| Heating Oil | -2.48% |
| Natural Gas | +1.21% |
| RBOB Gasoline | -2.27% |
| WTI Crude Oil | -1.06% |
| Metals | |
|---|---|
| Copper | -1.90% |
| Gold 100oz | -3.04% |
| Palladium | -5.69% |
| Platinum | -2.89% |
| Silver 5000oz | -2.62% |
Currencies
| MINTs | |
|---|---|
| USDIDR(IDN) | +0.54% |
| USDMXN(MEX) | +1.54% |
| USDNGN(NGA) | +0.29% |
| USDTRY(TUR) | +2.98% |
| BRICS | |
|---|---|
| USDBRL(BRA) | +4.28% |
| USDCNY(CHN) | -0.10% |
| USDINR(IND) | +0.42% |
| USDRUB(RUS) | +1.91% |
| USDZAR(ZAF) | +3.06% |
| Agricultural | |
|---|---|
| Cattle | -2.17% |
| Cocoa | +2.55% |
| Coffee (Arabica) | -9.16% |
| Coffee (Robusta) | -4.17% |
| Corn | -4.10% |
| Cotton | +8.16% |
| Feeder Cattle | +1.57% |
| Lean Hogs | +0.14% |
| Lumber | +1.34% |
| Orange Juice | -2.86% |
| Soybean Meal | -1.17% |
| Soybeans | +0.55% |
| Sugar #11 | -8.18% |
| Wheat | -6.71% |
| White Sugar | -5.41% |
Credit Indices
| Index | Change |
|---|---|
| Markit CDX EM | -0.87% |
| Markit CDX NA HY | -0.45% |
| Markit CDX NA IG | +1.45% |
| Markit CDX NA IG HVOL | +5.31% |
| Markit iTraxx Asia ex-Japan IG | -0.61% |
| Markit iTraxx Australia | -0.03% |
| Markit iTraxx Europe | +2.98% |
| Markit iTraxx Europe Crossover | +18.20% |
| Markit iTraxx Japan | -1.67% |
| Markit iTraxx SovX Western Europe | -1.04% |
| Markit LCDX (Loan CDS) | +0.00% |
| Markit MCDX (Municipal CDS) | +0.50% |
Nifty Heatmap
Index Returns
Sector Performance
Advance Decline
Market Cap Decile Performance
| Decile | Mkt. Cap. | Adv/Decl |
|---|---|---|
| 1 (micro) | +11.06% | 81/60 |
| 2 | +12.97% | 91/49 |
| 3 | +11.06% | 90/50 |
| 4 | +7.52% | 80/61 |
| 5 | +10.47% | 87/53 |
| 6 | +6.29% | 84/56 |
| 7 | +5.64% | 83/58 |
| 8 | +4.40% | 78/62 |
| 9 | +3.14% | 74/66 |
| 10 (mega) | +0.79% | 70/71 |
Top winners and losers
ETFs
| PSUBNKBEES | +8.22% |
| BANKBEES | +1.94% |
| JUNIORBEES | +1.31% |
| NIFTYBEES | +0.21% |
| INFRABEES | +0.18% |
| CPSEETF | -0.43% |
| GOLDBEES | -1.10% |
Yield Curve
Bond Indices
| Sub Index | Change in YTM | Total Return(%) |
|---|---|---|
| GSEC TB | -0.40 | +0.27% |
| GSEC SUB 1-3 | -0.24 | +0.81% |
| GSEC SUB 3-8 | -0.17 | +1.08% |
| GSEC SUB 8 | -0.10 | +0.88% |
Nifty OI
Bank Nifty OI
Theme Performance
| Quality to Price | +9.52% |
| Momentum 200 | +6.99% |
| Magic Formula Investing | +5.60% |
| Market Fliers | +3.82% |
| Refract: PPFAS Long Term Value Fund | +3.35% |
| Financial Strength Value | +3.31% |
| Industrial Value | +3.13% |
| Balance-sheet Strength | +2.69% |
| IT 3rd Benchers | +2.00% |
| Piotroski ROC Small Caps | +1.94% |
| Growth with Moat | +1.73% |
| Market Elephants | +1.69% |
| Efficient Growth | +1.62% |
| Enterprise Yield | +1.43% |
| CNX 100 50-Day Tactical | +0.76% |
| ADAG Mania | -0.37% |
Thought for the weekend
Sentiment data is inconclusive and sometimes contradictory. There is no signal within the noisy data. Besides, no one has the ability to consistently forecast any of the inevitable market corrections. Its probably best to ignore the short-term action and concentrate on being on the right side of the long-term trend.
Equities
| MINTs | |
|---|---|
| JCI(IDN) | +0.63% |
| INMEX(MEX) | +1.14% |
| NGSEINDX(NGA) | -0.48% |
| XU030(TUR) | +1.71% |
| BRICS | |
|---|---|
| IBOV(BRA) | +0.31% |
| SHCOMP(CHN) | +5.95% |
| NIFTY(IND) | +1.67% |
| INDEXCF(RUS) | +3.67% |
| TOP40(ZAF) | +1.20% |
Commodities
| Energy | |
|---|---|
| Brent Crude Oil | -1.73% |
| Ethanol | -8.18% |
| Heating Oil | -0.90% |
| Natural Gas | -5.58% |
| RBOB Gasoline | -6.24% |
| WTI Crude Oil | -1.13% |
| Metals | |
|---|---|
| Copper | +0.96% |
| Gold 100oz | -1.59% |
| Palladium | -0.87% |
| Platinum | -1.15% |
| Silver 5000oz | -2.05% |
Currencies
| MINTs | |
|---|---|
| USDIDR(IDN) | +0.50% |
| USDMXN(MEX) | -0.35% |
| USDNGN(NGA) | +0.12% |
| USDTRY(TUR) | -0.17% |
| BRICS | |
|---|---|
| USDBRL(BRA) | -0.00% |
| USDCNY(CHN) | -0.04% |
| USDINR(IND) | -0.18% |
| USDRUB(RUS) | +0.87% |
| USDZAR(ZAF) | +0.59% |
| Agricultural | |
|---|---|
| Cattle | +3.42% |
| Cocoa | -3.62% |
| Coffee (Arabica) | +1.24% |
| Coffee (Robusta) | +1.28% |
| Corn | -4.01% |
| Cotton | -1.55% |
| Feeder Cattle | +3.42% |
| Lean Hogs | +10.34% |
| Lumber | -0.83% |
| Orange Juice | -0.73% |
| Soybean Meal | +1.53% |
| Soybeans | +0.98% |
| Sugar #11 | -3.65% |
| Wheat | -4.14% |
| White Sugar | -2.32% |
Credit Indices
| Index | Change |
|---|---|
| Markit CDX EM | -0.35% |
| Markit CDX NA HY | -0.23% |
| Markit CDX NA IG | +0.85% |
| Markit CDX NA IG HVOL | +0.36% |
| Markit iTraxx Asia ex-Japan IG | -4.93% |
| Markit iTraxx Australia | -1.97% |
| Markit iTraxx Europe | +0.18% |
| Markit iTraxx Europe Crossover | -0.53% |
| Markit iTraxx Japan | -3.44% |
| Markit iTraxx SovX Western Europe | +0.00% |
| Markit LCDX (Loan CDS) | +0.00% |
| Markit MCDX (Municipal CDS) | +0.00% |
Nifty Heatmap
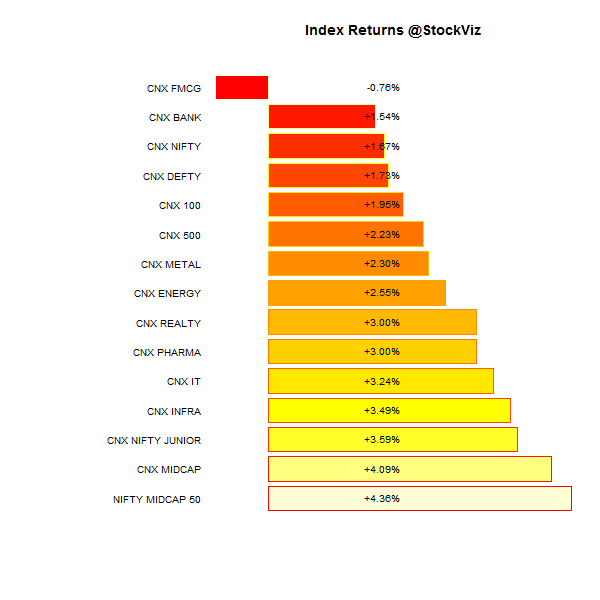
Index Returns
Sector Performance
Advance Decline
Market Decile Performance
| Decile | Mkt. Cap. | Adv/Decl |
|---|---|---|
| 1 (micro) | +1.33% | 67/71 |
| 2 | +4.14% | 73/64 |
| 3 | +3.09% | 75/62 |
| 4 | +4.68% | 72/65 |
| 5 | +4.56% | 72/64 |
| 6 | +4.59% | 79/59 |
| 7 | +3.92% | 77/60 |
| 8 | +3.25% | 70/67 |
| 9 | +3.46% | 67/70 |
| 10 (mega) | +2.07% | 70/68 |
Top winners and losers
| TATACHEM | +9.88% |
| CROMPGREAV | +11.91% |
| UPL | +19.68% |
| BHEL | -7.51% |
| MCDOWELL-N | -4.79% |
| CONCOR | -4.41% |
ETFs
| JUNIORBEES | +2.89% |
| CPSEETF | +2.74% |
| INFRABEES | +2.59% |
| NIFTYBEES | +1.37% |
| BANKBEES | +1.30% |
| PSUBNKBEES | +0.18% |
| GOLDBEES | -1.66% |
Yield Curve
Bond Indices
| Sub Index | Change in YTM | Total Return(%) |
|---|---|---|
| GSEC TB | +0.01 | +0.18% |
| GSEC SUB 1-3 | -0.10 | -0.15% |
| GSEC SUB 3-8 | +0.35 | -1.15% |
| GSEC SUB 8 | +0.23 | -1.42% |
Nifty OI
Bank Nifty OI
Thought for the weekend
Most investment policies today are Big Bets on world peace. The history of the 20th Century has shown that previously dominant empires can fall. In 1899, which was 15 years before the start of World War I, the Major Powers were:
- Britain
- Germany
- France
- Austro-Hungary
- Russia
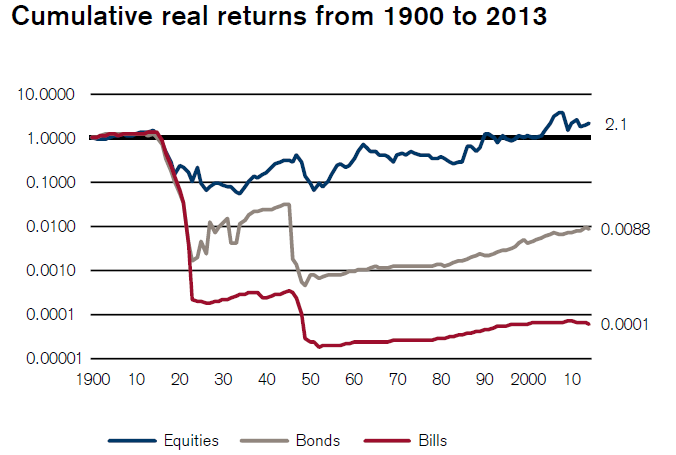
Here’s the cumulative return of a dollar invested in Austro-Hungarian market:
Britain was a dominant global power at the dawn of the 20th Century. The real return on $1 invested in British equities in 1899 is $372. France returned $36 in the same period. The US? $1,248. And the US was still a promising emerging market country at that time (as was Argentina.)
If you wanted to project equity risk and return expectations, what figure would you use? The US 1,248 real return, the British 372 or the French 36 real return figure?
Source: The One Big Bet made by most buy-and-hold portfolios


