Tag: weekly

Weekly Recap: Is Risk Cheap?

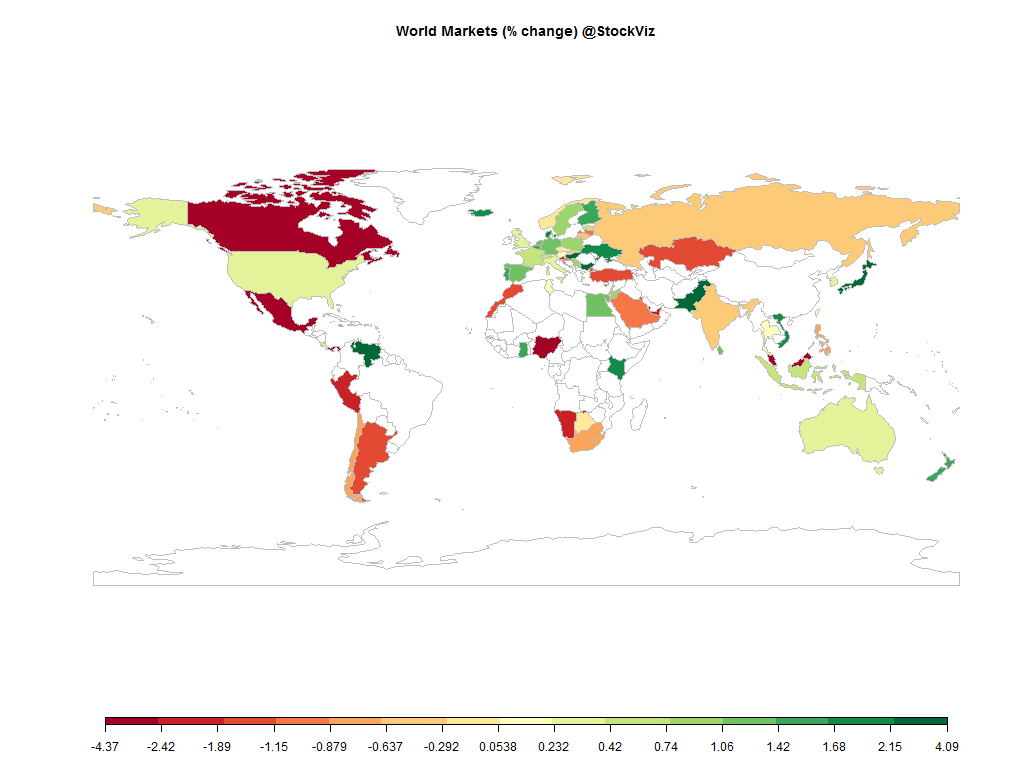
world.2014-11-28.2014-12-05

Equities

Major
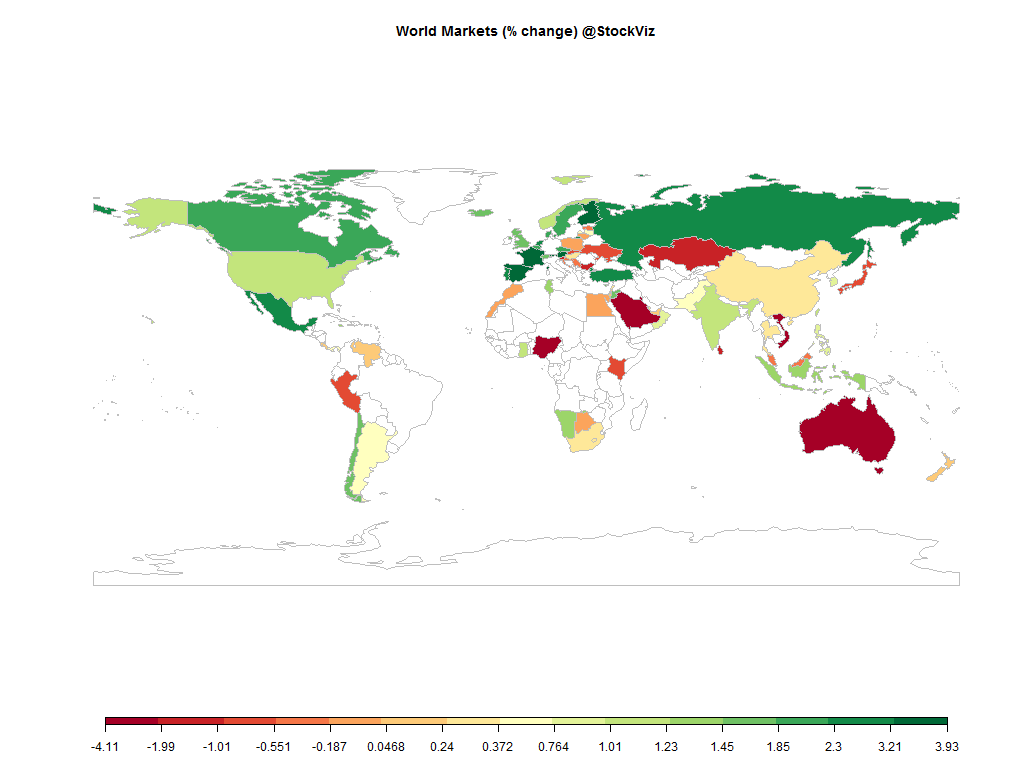
DAX(DEU) +1.06%
CAC(FRA) +0.67%
UKX(GBR) +0.30%
NKY(JPN) +2.64%
SPX(USA) +0.38%
MINTs
JCI(IDN) +0.74%
INMEX(MEX) -2.55%
NGSEINDX(NGA) -3.81%
XU030(TUR) -1.38%
BRICS
IBOV(BRA) -5.46%
SHCOMP(CHN) +9.50%
NIFTY(IND) -0.58%
INDEXCF(RUS) -0.29%
TOP40(ZAF) -0.75%

Commodities

Energy
Brent Crude Oil -2.76%
Ethanol -17.62%
Heating Oil -6.10%
Natural Gas -7.90%
RBOB Gasoline -7.91%
WTI Crude Oil -2.38%
Metals
Copper +1.74%
Gold 100oz +2.04%
Palladium -0.44%
Platinum +1.89%
Silver 5000oz +5.19%

Currencies

USDEUR:+1.24% USDJPY:+2.36%

MINTs
USDIDR(IDN) +0.77%
USDMXN(MEX) +3.26%
USDNGN(NGA) +0.89%
USDTRY(TUR) +1.82%
BRICS
USDBRL(BRA) +0.81%
USDCNY(CHN) +0.12%
USDINR(IND) -0.40%
USDRUB(RUS) +6.92%
USDZAR(ZAF) +2.52%
Agricultural
Cattle -2.85%
Coffee (Robusta) -2.81%
White Sugar -2.95%
Corn +1.46%
Sugar #11 -2.89%
Cocoa +3.07%
Lean Hogs -3.27%
Lumber +2.64%
Soybean Meal +1.38%
Wheat +5.19%
Coffee (Arabica) -4.20%
Cotton -0.96%
Feeder Cattle +1.23%
Orange Juice -2.05%
Soybeans +2.17%

Credit Indices

Index Change
Markit CDX EM -0.96%
Markit CDX NA HY -0.21%
Markit CDX NA IG +1.16%
Markit iTraxx Asia ex-Japan IG +0.70%
Markit iTraxx Australia +0.11%
Markit iTraxx Europe -1.46%
Markit iTraxx Europe Crossover -2.94%
Markit iTraxx Japan -2.13%
Markit iTraxx SovX Western Europe -0.97%
Markit LCDX (Loan CDS) +0.08%
Markit MCDX (Municipal CDS) +1.07%
The ECB did not announce the sovereign QE that everybody hoped for. Oil continued to tumble. Credit spreads seem to be sending out warning signals. The dollar rally continued, especially against oil producing currencies. Metals caught a breather.

Oil

oil

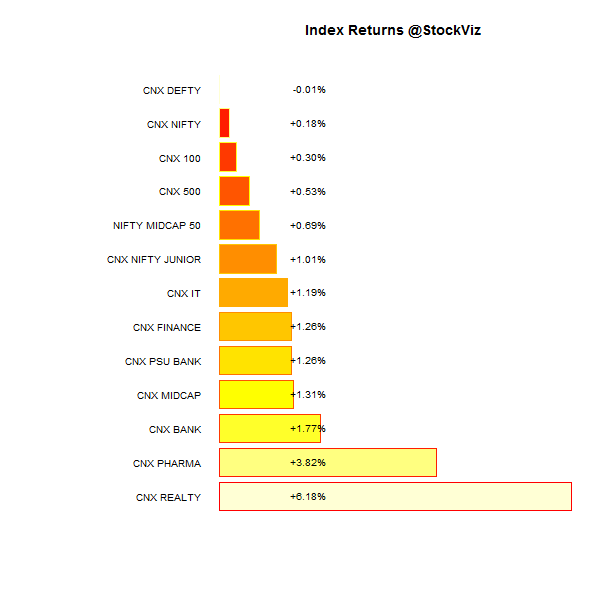
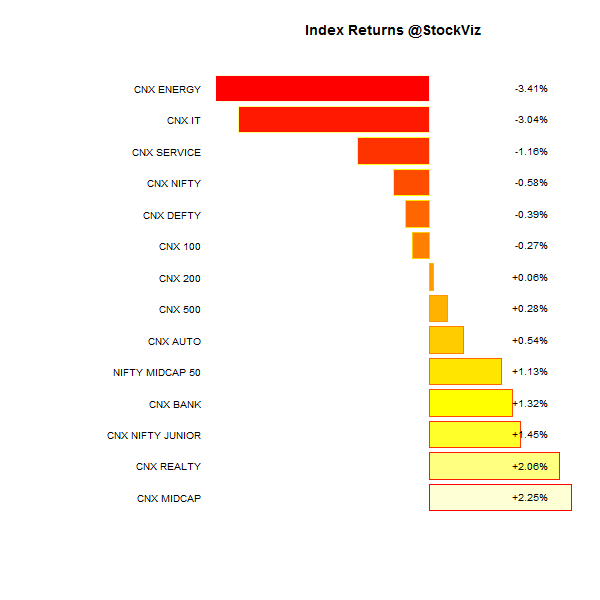
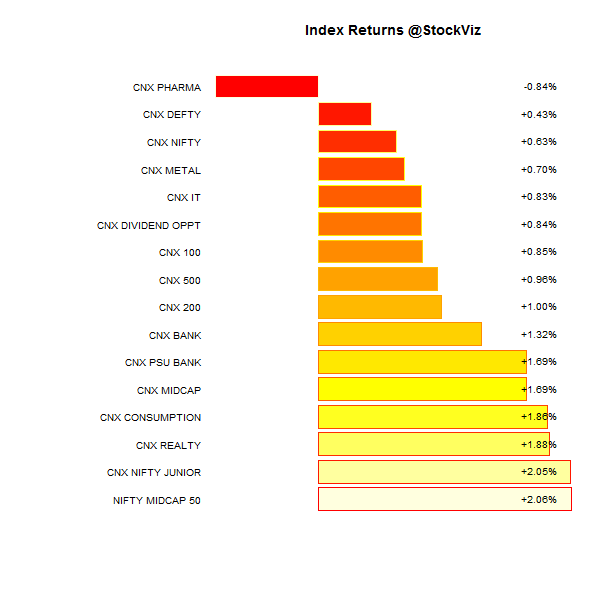
Index Returns

index performance.2014-11-28.2014-12-05

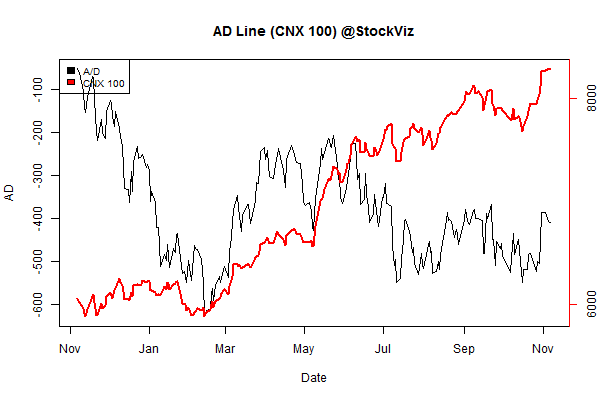
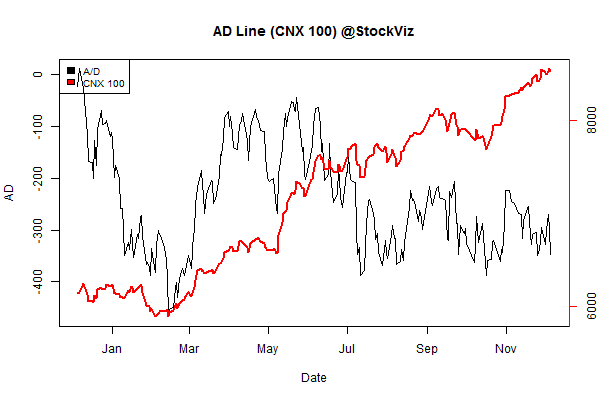
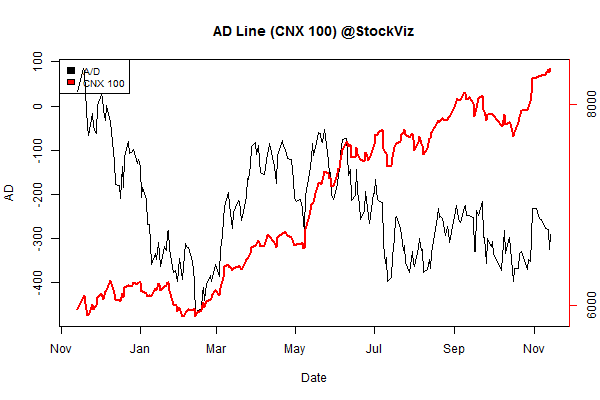
Advance Decline

advance.decline.line2.2014-11-28.2014-12-05

Market Cap Decile Performance

Decile Mkt. Cap. Adv/Decl
1 (micro) -0.09% 72/68
2 +1.65% 68/72
3 +2.01% 69/71
4 +1.81% 69/70
5 +1.60% 69/71
6 +1.34% 74/66
7 +2.57% 72/68
8 +2.78% 79/61
9 +2.26% 76/64
10 (mega) +0.03% 75/65
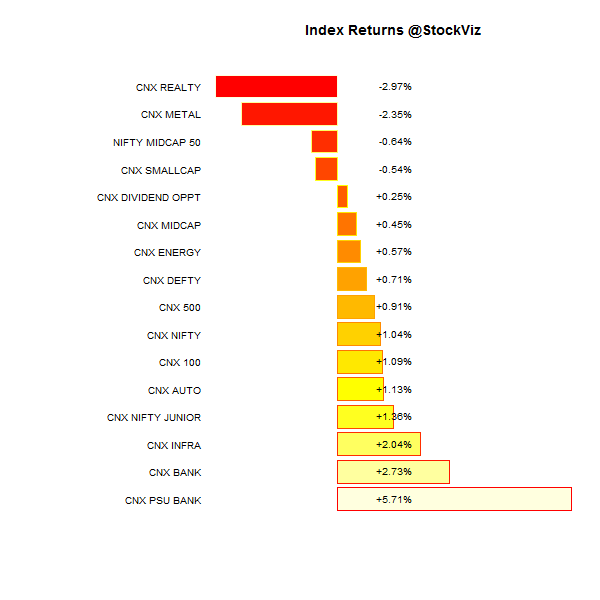
Midcaps outperformed large caps…

Top Winners and Losers

GLAXO +8.87%
SRTRANSFIN +9.10%
BAJAJFINSV +10.38%
SAIL -6.91%
HINDALCO -6.23%
DRREDDY -5.84%
SAIL turned out to be a classic value trap – moats eroded and its largest investor axed to get rid of it…

ETF Performance

JUNIORBEES +2.40%
PSUBNKBEES +2.12%
BANKBEES +1.69%
NIFTYBEES -0.21%
GOLDBEES -0.65%
CPSEETF -1.44%
INFRABEES -2.43%
The rally in banking stocks continued, outperforming the Nifty…

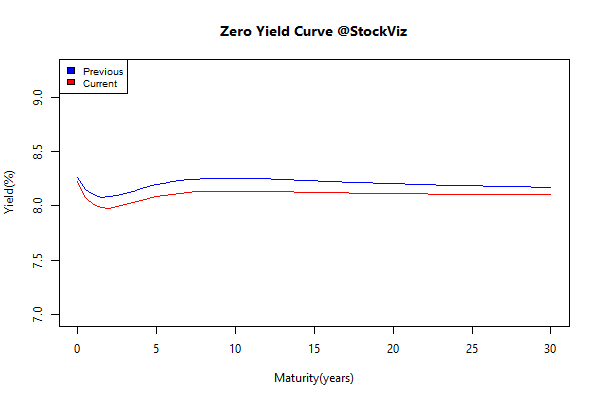
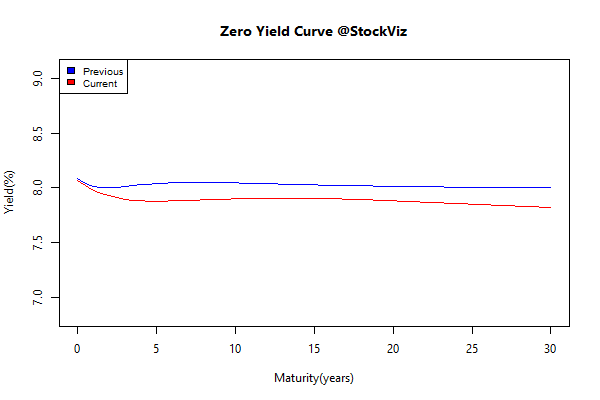
Yield Curve

yield Curve.2014-11-28.2014-12-05

Bond Indices

Sub Index Change in YTM Total Return(%)
GSEC TB -0.15 +0.19%
GSEC SUB 1-3 -0.08 +0.43%
GSEC SUB 3-8 -0.16 +0.67%
GSEC SUB 8 -0.19 +1.48%
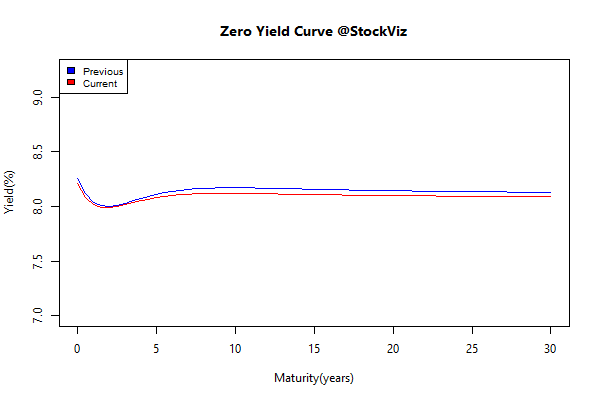
The long bond continued to post gains – falling inflation and rate cuts backed in.

Investment Theme Performance

Value is back after a month long period of under-performance. Momentum 200 now references 20 stocks to reduce volatility.

Thought for the weekend

When people invest in lower-risk strategies, what they are really buying is the perception of lower risk. Risk is like the air in a long balloon, with the result that when anyone tries to squeeze it away in one area they only succeed in redistributing it – and building up extra pressure – elsewhere.

Thus, if investors are seeking to reduce the volatility of earning streams by buying certain businesses then all they are doing is increasing their risk elsewhere – namely in the elevated valuations they are now having to pay.

When one looks at valuations and the fact so many people are so worried about all the different risks they see in the world has led to risk itself being lowly valued. Ironically enough, one of the cheapest things you can find in the market these days and therefore with a reduced level of valuation risk… is risk.

Source: Why investors are wrong to think they can eliminate risk completely

Related: Risk, Volatility and Returns

Weekly Recap: Constraints make us better

world.2014-11-21.2014-11-28

Equities

Major
DAX(DEU) +2.55%
CAC(FRA) +0.99%
UKX(GBR) -0.42%
NKY(JPN) +0.59%
SPX(USA) +0.37%
MINTs
JCI(IDN) +0.74%
INMEX(MEX) -1.56%
NGSEINDX(NGA) +1.82%
XU030(TUR) +3.78%
BRICS
IBOV(BRA) -1.62%
SHCOMP(CHN) +7.88%
NIFTY(IND) +1.31%
INDEXCF(RUS) -0.34%
TOP40(ZAF) -2.31%

Commodities

Energy
Brent Crude Oil -11.89%
Ethanol +2.24%
Heating Oil -9.33%
Natural Gas -5.18%
RBOB Gasoline -10.86%
WTI Crude Oil -12.88%
Metals
Copper -6.84%
Gold 100oz -2.94%
Palladium +2.13%
Platinum -2.27%
Silver 5000oz -4.35%

Currencies

USDEUR:-0.54% USDJPY:+0.68%

MINTs
USDIDR(IDN) +0.49%
USDMXN(MEX) +2.12%
USDNGN(NGA) +0.85%
USDTRY(TUR) -0.07%
BRICS
USDBRL(BRA) +2.15%
USDCNY(CHN) +0.33%
USDINR(IND) +0.42%
USDRUB(RUS) +7.93%
USDZAR(ZAF) +0.91%
Agricultural
Coffee (Arabica) -1.68%
Soybeans -1.86%
Wheat +5.37%
White Sugar -3.37%
Cattle -1.01%
Coffee (Robusta) +1.30%
Corn +0.13%
Lumber -1.11%
Soybean Meal +4.13%
Cocoa +1.48%
Cotton +3.50%
Lean Hogs -0.91%
Feeder Cattle -2.09%
Orange Juice +3.69%
Sugar #11 -3.23%

Credit Indices

Index Change
Markit CDX EM +0.29%
Markit CDX NA HY +1.06%
Markit CDX NA IG -5.64%
Markit iTraxx Asia ex-Japan IG -5.64%
Markit iTraxx Australia -3.11%
Markit iTraxx Europe -4.96%
Markit iTraxx Europe Crossover -34.92%
Markit iTraxx Japan -0.26%
Markit iTraxx SovX Western Europe -1.73%
Markit LCDX (Loan CDS) -0.02%
Markit MCDX (Municipal CDS) -0.97%
The biggest news this week was OPEC’s non-cut and the subsequent collapse in oil prices. The US dollar continued to rally, precious metals weakened and Nigeria devalued their currency…

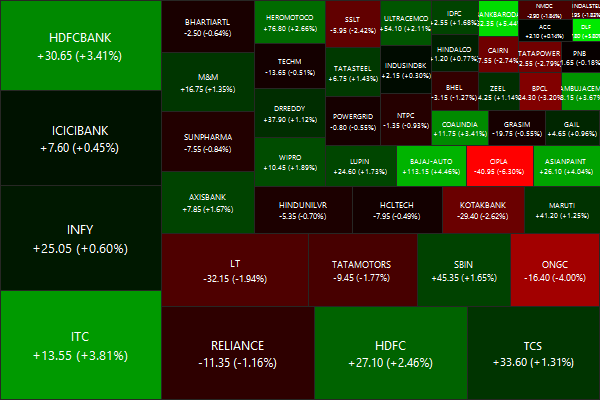
Nifty Heatmap

CNX NIFTY.2014-11-21.2014-11-28

Index Returns

index performance.2014-11-21.2014-11-28

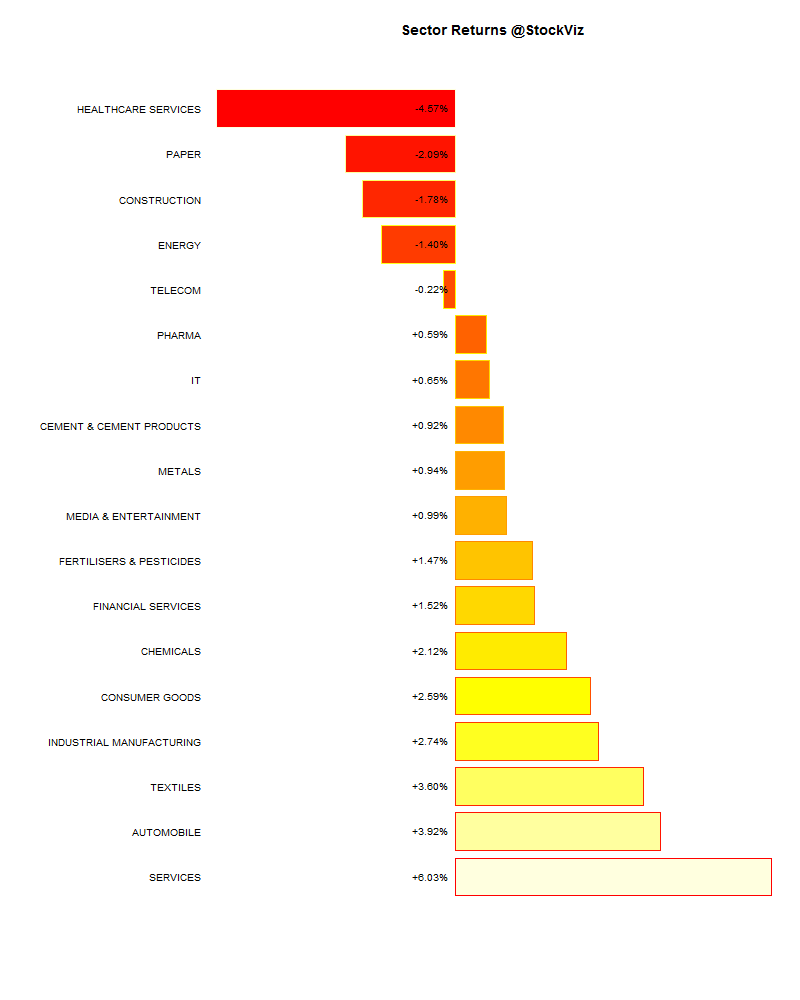
Sector Performance

sector performance.2014-11-21.2014-11-28

Market Cap Decile Performance

Decile Mkt. Cap. Adv/Decl
1 (micro) -4.81% 65/75
2 -0.79% 67/72
3 -1.80% 63/76
4 -0.72% 62/77
5 -1.35% 66/73
6 -1.30% 67/72
7 -0.84% 70/69
8 -0.55% 66/73
9 +0.95% 72/67
10 (mega) +1.09% 70/70
Large cap outperformed small caps this week…

Top Winners and Losers

HINDALCO +8.58%
HINDPETRO +11.60%
BHEL +12.51%
IDEA -7.79%
CONCOR -6.44%
RCOM -5.46%
OMC’s put in a good show on the back of the OPEC non-cut. Has the cycle finally turned for BHEL?

ETF Performance

PSUBNKBEES +4.22%
BANKBEES +1.97%
NIFTYBEES +1.66%
CPSEETF +1.18%
GOLDBEES +0.48%
JUNIORBEES +0.25%
INFRABEES -0.64%
The financial sector put in a good show in the back of RBI’s new regulations on small and payment banks…

Yield Curve

yield Curve.2014-11-21.2014-11-28

Bond Indices

Sub Index Change in YTM Total Return(%)
GSEC TB +0.07 +0.14%
GSEC SUB 1-3 +0.11 +0.12%
GSEC SUB 3-8 -0.08 +0.31%
GSEC SUB 8 -0.08 +0.87%
Next rate cut is more than priced in at this point. Falling inflation, wavering growth..

Investment Theme Performance

Thought for the weekend

When we create new constraints, we force ourselves to adapt. This, in turn, exercises skills that otherwise might never be tapped. Constraints foster creativity. We have to perform in new ways to adapt to challenging constraints.

Source: Expanding Our Trading by Imposing Constraints

Weekly Recap: Emotions are life’s “beta”

world.2014-11-14.2014-11-21

Equities

Major
DAX(DEU) +5.18%
CAC(FRA) +3.44%
UKX(GBR) +1.45%
NKY(JPN) -0.76%
SPX(USA) +1.23%
MINTs
JCI(IDN) +1.24%
INMEX(MEX) +2.96%
NGSEINDX(NGA) -4.11%
XU030(TUR) +2.72%
BRICS
IBOV(BRA) +8.65%
SHCOMP(CHN) +0.32%
NIFTY(IND) +1.04%
INDEXCF(RUS) +2.54%
TOP40(ZAF) +0.26%

Commodities

Energy
Brent Crude Oil +1.43%
Ethanol +2.70%
Heating Oil -0.44%
Natural Gas +4.52%
RBOB Gasoline +1.21%
WTI Crude Oil +1.54%
Metals
Copper -0.33%
Gold 100oz +1.09%
Palladium +2.78%
Platinum +1.12%
Silver 5000oz +3.21%

Currencies

USDEUR:+1.09% USDJPY:+1.32%

MINTs
USDIDR(IDN) -0.55%
USDMXN(MEX) +0.77%
USDNGN(NGA) +3.17%
USDTRY(TUR) -0.45%
BRICS
USDBRL(BRA) -3.02%
USDCNY(CHN) -0.08%
USDINR(IND) +0.09%
USDRUB(RUS) -3.12%
USDZAR(ZAF) -1.54%
Agricultural
Cattle +0.68%
Cocoa +0.64%
Coffee (Arabica) -1.43%
Coffee (Robusta) -0.29%
Corn -3.32%
Cotton -0.47%
Feeder Cattle -1.49%
Lean Hogs -2.37%
Lumber +4.66%
Orange Juice +9.06%
Soybean Meal -1.38%
Soybeans +0.80%
Sugar #11 +1.58%
Wheat -2.14%
White Sugar -0.43%

Credit Indices

Index Change
Markit CDX EM +0.15%
Markit CDX NA HY -0.52%
Markit CDX NA IG +1.57%
Markit CDX NA IG HVOL +3.01%
Markit iTraxx Asia ex-Japan IG +0.10%
Markit iTraxx Australia +1.12%
Markit iTraxx Europe +1.12%
Markit iTraxx Europe Crossover +8.18%
Markit iTraxx Japan +3.92%
Markit iTraxx SovX Western Europe -0.58%
Markit LCDX (Loan CDS) +0.00%
Markit MCDX (Municipal CDS) +0.59%
A good week for the markets, with the Chinese central bank getting into the easing game. Credit spreads moved the other way – liquidity maybe driving up stocks, but the credit markets seem to be saying something else.

The SPX continued to make fresh highs but the best performing market was Brazil.

And, the dollar rally paused for the cause…

Index Returns

index performance.2014-11-14.2014-11-21

Market Cap Decile Performance

Decile Mkt. Cap. Adv/Decl
1 (micro) -1.34% 66/73
2 -0.29% 75/64
3 -0.58% 68/72
4 -0.16% 67/71
5 -0.40% 67/72
6 +0.23% 80/59
7 +0.57% 71/69
8 +0.45% 72/66
9 +0.90% 74/65
10 (mega) +1.16% 73/67
Large caps out-performed small caps, primarily driven by banks.

Top Winners and Losers

UBL +10.27%
BOSCHLTD +10.90%
RECLTD +11.71%
JINDALSTEL -9.84%
NMDC -5.65%
RANBAXY -5.51%
In one week, Bosch went from being a value stock to full priced…

ETF Performance

PSUBNKBEES +5.99%
BANKBEES +3.04%
INFRABEES +1.80%
GOLDBEES +1.70%
NIFTYBEES +0.71%
JUNIORBEES +0.64%
CPSEETF -0.24%
Banks stole the show. Will this carry through to next week?

Yield Curve

yield Curve.2014-11-14.2014-11-21

Bond Indices

Bond Indices

Bond Indices

Bond Indices

Sub Index Change in YTM Total Return(%)
GSEC TB -0.09 +0.18%
GSEC SUB 1-3 +0.04 +0.26%
GSEC SUB 3-8 +0.03 +0.21%
GSEC SUB 8 +0.01 +0.19%
The yield curve is beginning to invert. Next rate-cut is fully priced in to the long-end of the curve.

Investment Theme Performance

Thought for the weekend

Emotions are life’s “beta”.

The concept that a stock moves with either more or less volatility than the market seems a neat analog for life. Sometimes you are the windshield, sometimes you’re the bug. We’ve all had beta 3 days, both for good or for bad. But no one except a finance person would try to quantify that with a number.

“How was your day, honey?”
Answer: “Oh, a gap up open when I got a new customer to trade with me, but a lousy close when the market went nuts after the Fed meeting. Definitely a beta 2 day. Hopefully tomorrow will be calmer.”

Source: Nick Colas: Ten Signs You’ve Been on Wall Street Too Long

Weekly Recap: Oranges, lemons and forex

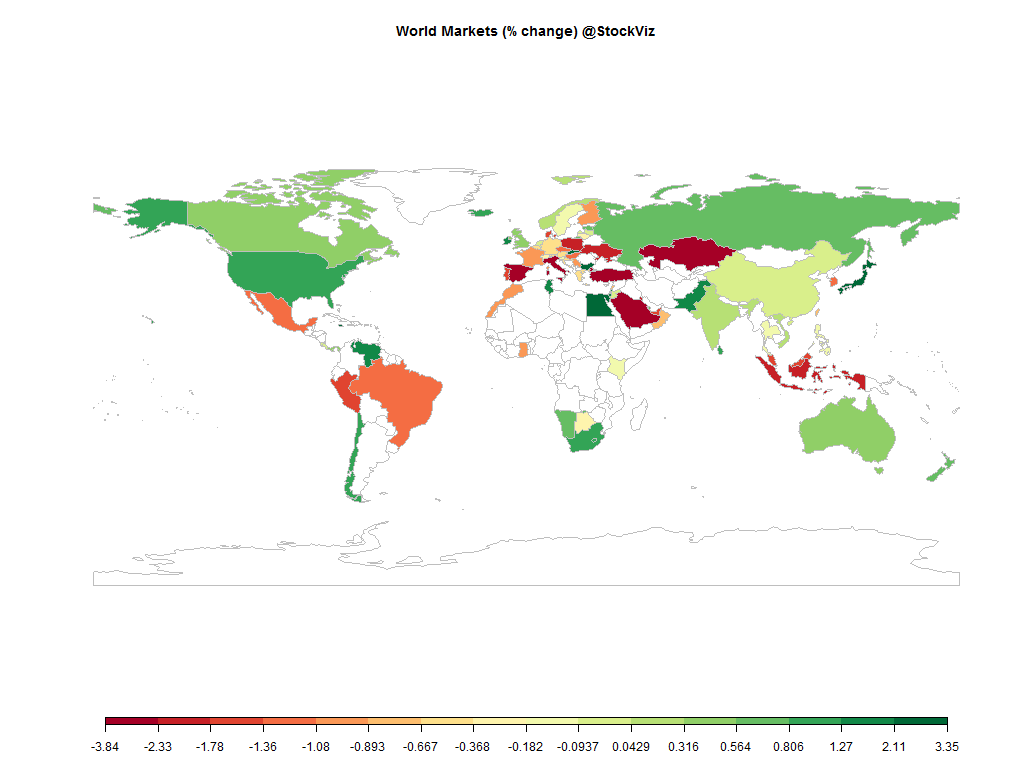
world.2014-11-7.2014-11-14

Equities

Major
DAX(DEU) -0.42%
CAC(FRA) +0.30%
UKX(GBR) +1.33%
NKY(JPN) +3.62%
SPX(USA) +0.37%
MINTs
JCI(IDN) +1.24%
INMEX(MEX) -3.10%
NGSEINDX(NGA) +6.49%
XU030(TUR) +4.75%
BRICS
IBOV(BRA) -3.04%
SHCOMP(CHN) +2.51%
NIFTY(IND) +0.63%
INDEXCF(RUS) +0.24%
TOP40(ZAF) +0.71%

Commodities

Energy
Brent Crude Oil -5.20%
Ethanol +5.48%
Heating Oil -3.27%
Natural Gas -8.76%
RBOB Gasoline -4.40%
WTI Crude Oil -4.07%
Metals
Copper -0.33%
Gold 100oz +1.65%
Palladium -0.76%
Platinum +0.35%
Silver 5000oz +8.67%

Currencies

USDEUR:-0.72% USDJPY:+1.50%

MINTs
USDIDR(IDN) +0.29%
USDMXN(MEX) +0.00%
USDNGN(NGA) +3.59%
USDTRY(TUR) -1.26%
BRICS
USDBRL(BRA) +1.40%
USDCNY(CHN) +0.12%
USDINR(IND) +0.14%
USDRUB(RUS) +1.26%
USDZAR(ZAF) -1.62%
Agricultural
Cattle +2.22%
Cocoa -2.34%
Coffee (Arabica) +4.66%
Coffee (Robusta) +2.78%
Corn +3.74%
Cotton -5.11%
Feeder Cattle +0.87%
Lean Hogs +4.26%
Lumber -2.97%
Orange Juice +1.35%
Soybean Meal -2.52%
Soybeans -0.84%
Sugar #11 +1.15%
Wheat +9.15%
White Sugar +1.63%

Credit Indices

Index Change
Markit CDX EM -0.39%
Markit CDX NA HY +0.11%
Markit CDX NA IG -1.05%
Markit CDX NA IG HVOL +0.05%
Markit iTraxx Asia ex-Japan IG -0.64%
Markit iTraxx Australia -1.41%
Markit iTraxx Europe -1.03%
Markit iTraxx Europe Crossover -4.53%
Markit iTraxx Japan -3.54%
Markit iTraxx SovX Western Europe -1.10%
Markit LCDX (Loan CDS) +0.18%
Markit MCDX (Municipal CDS) -0.40%
The US Dollar continued to rally and credit spreads contracted. The NIFTY index ended making fresh highs. Oil continued to tumble.

Nifty Heatmap

CNX NIFTY.2014-11-7.2014-11-14

Index Returns

index performance.2014-11-7.2014-11-14

Sector Performance

sector performance.2014-11-7.2014-11-14

Advance Decline

advance.decline.line2.2014-11-7.2014-11-14

Market Cap Decile Performance

Decile Mkt. Cap. Adv/Decl
1 (micro) +1.36% 65/73
2 +2.57% 72/65
3 +1.58% 70/68
4 -0.78% 72/65
5 +0.66% 58/80
6 +0.64% 76/61
7 +0.95% 69/69
8 +0.37% 64/73
9 +1.24% 69/69
10 (mega) +0.98% 72/66
Midcaps chalked up a decent score. It was an even keeled performance across the market cap spectrum…

Top winners and losers

LICHSGFIN +10.03%
COLPAL +11.42%
INGVYSYABK +13.41%
CIPLA -6.30%
RCOM -5.43%
APOLLOHOSP -4.58%
The results season was not kind to Cipla (overblown expectations) and RCOM (typical ADAG nautanki.)

ETFs

JUNIORBEES +3.32%
PSUBNKBEES +3.25%
BANKBEES +1.87%
NIFTYBEES +0.44%
GOLDBEES +0.01%
INFRABEES -0.98%
CPSEETF -1.01%
The Juniors reflected mid-cap performance. Banks continue to catch a bid and are expected to outperform…

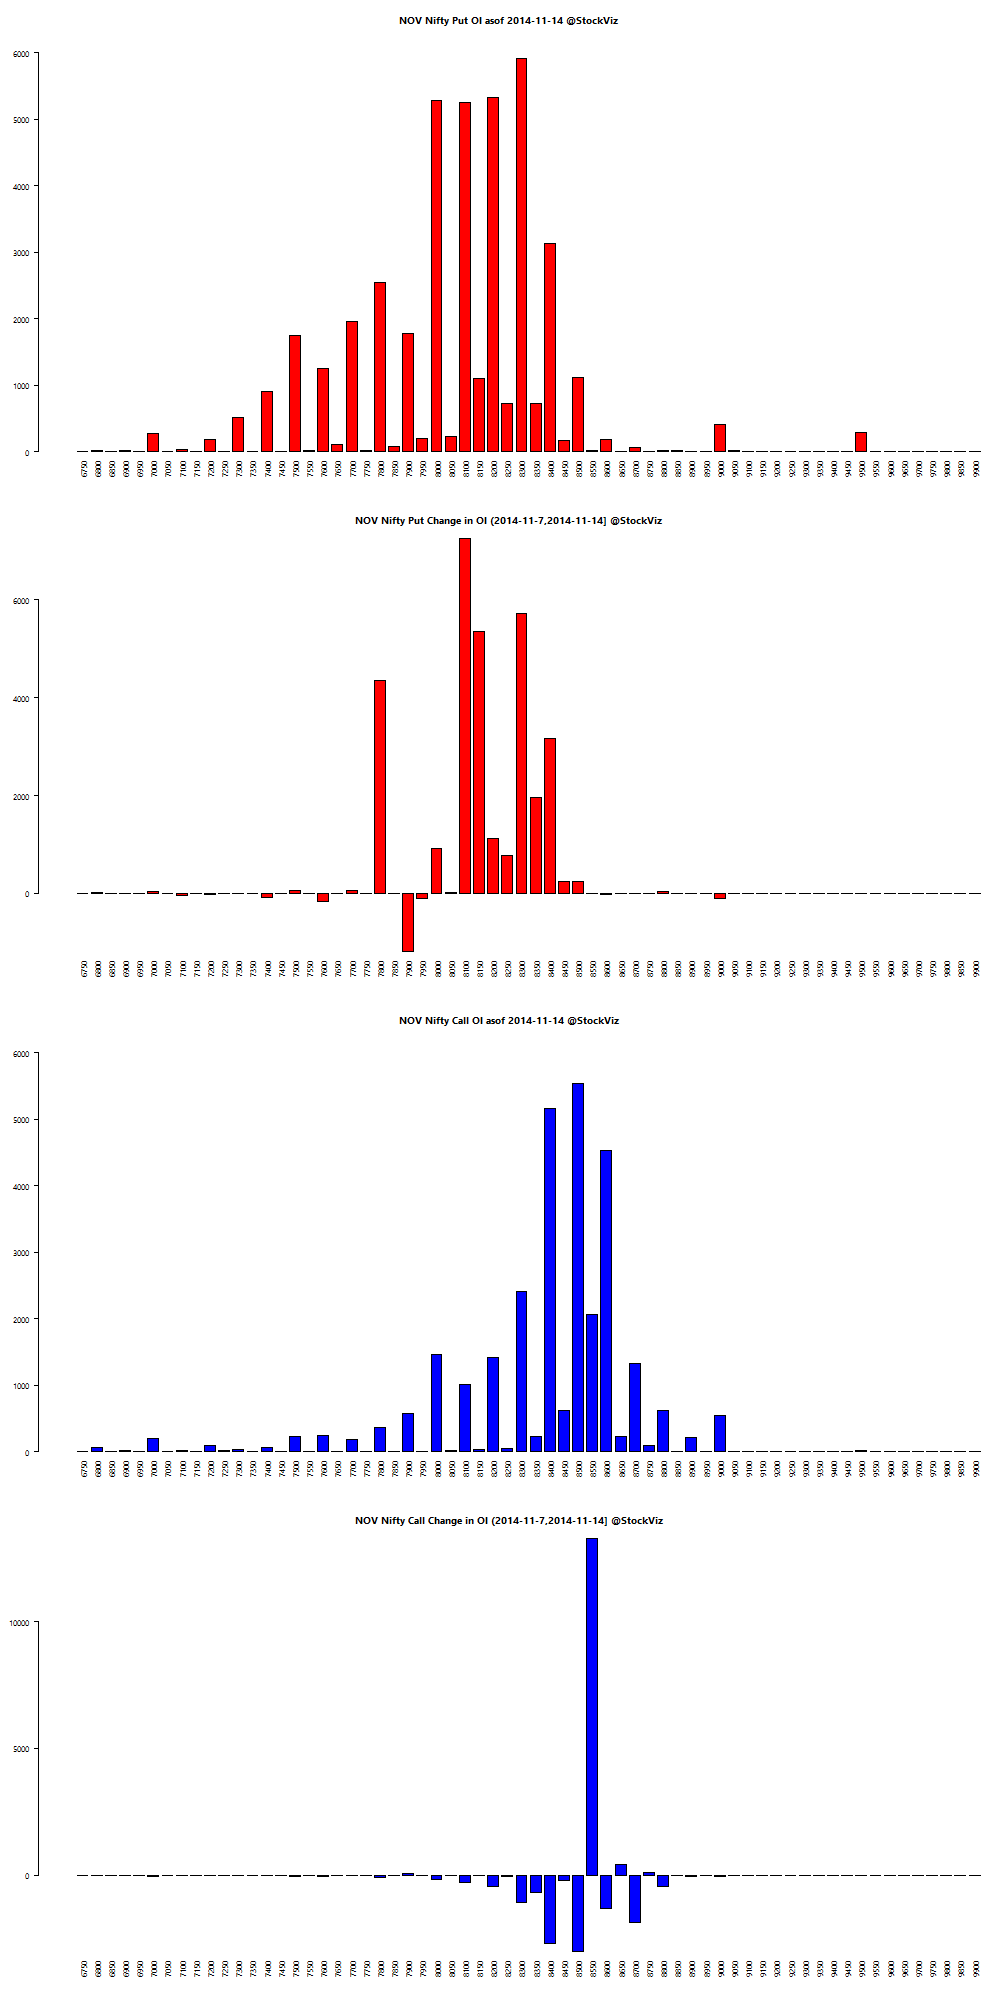
Nifty OI

nifty.puts.calls.NOV.2014-11-7.2014-11-14

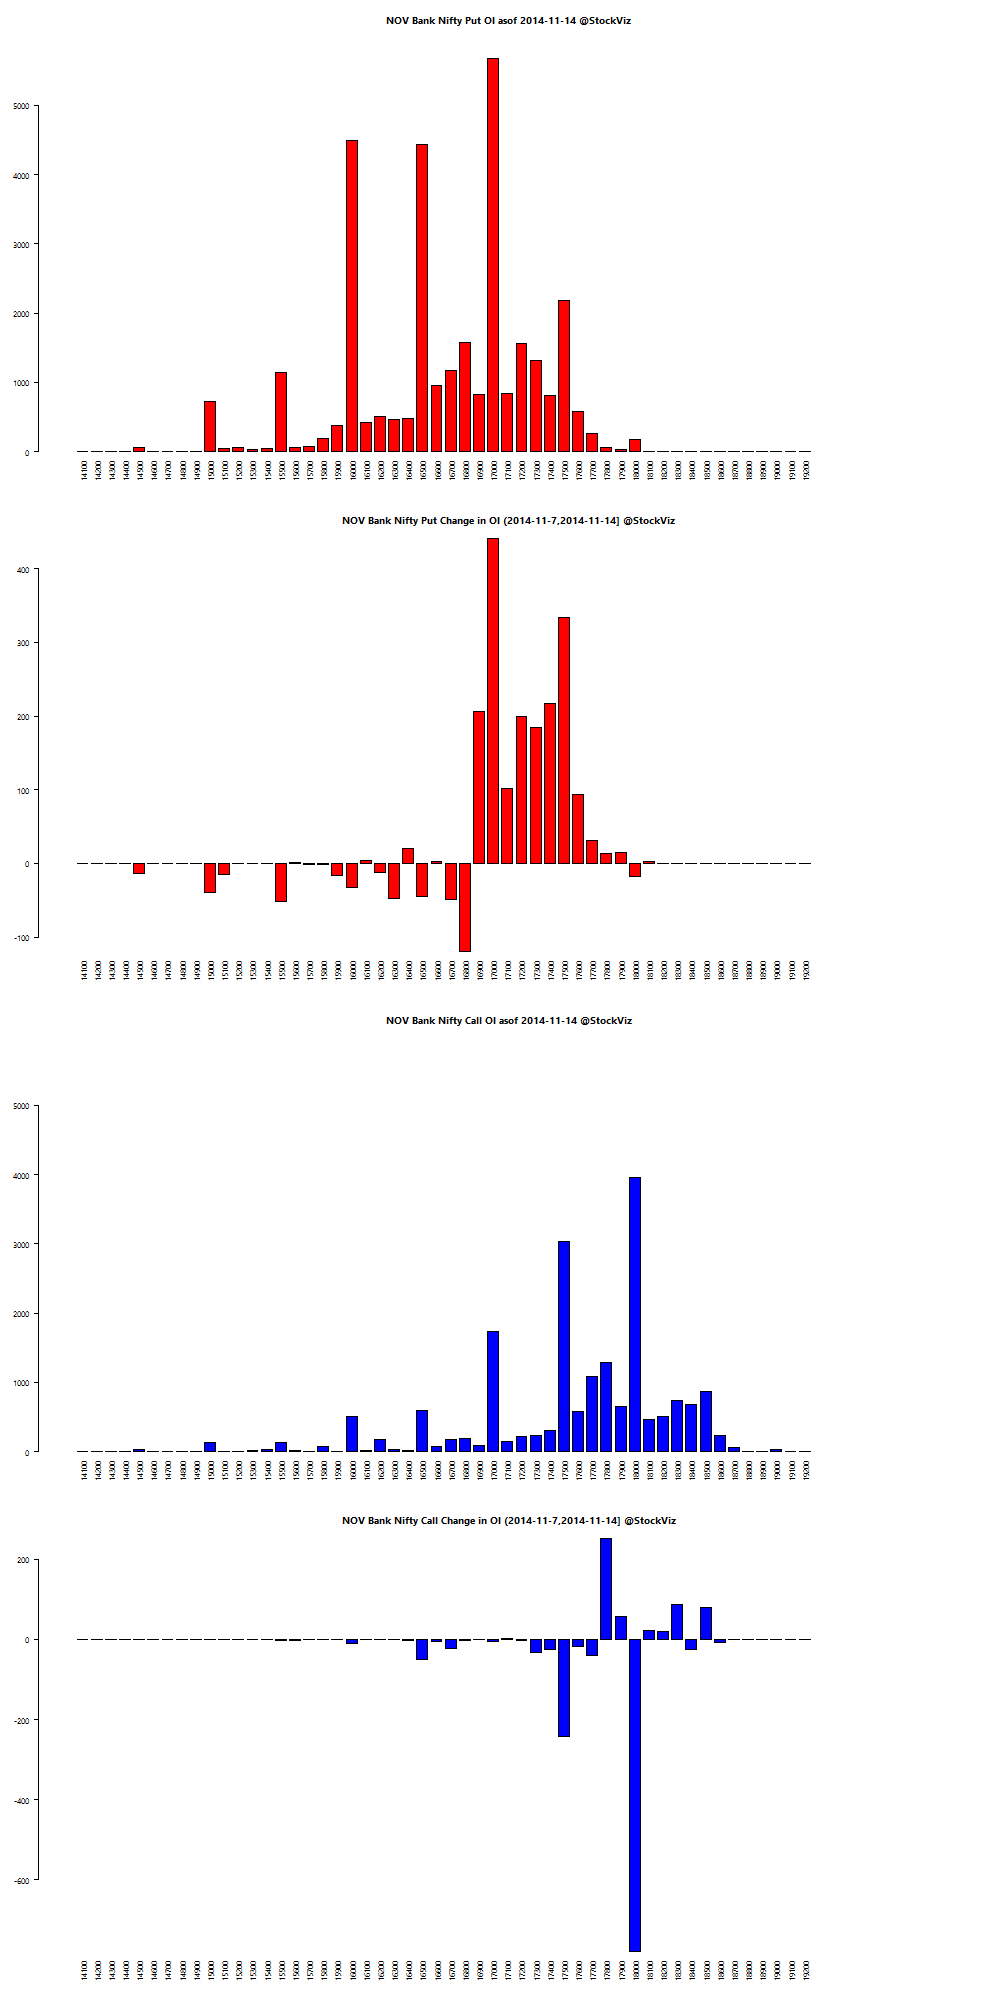
Bank Nifty OI

bank-nifty.puts.calls.NOV.2014-11-7.2014-11-14

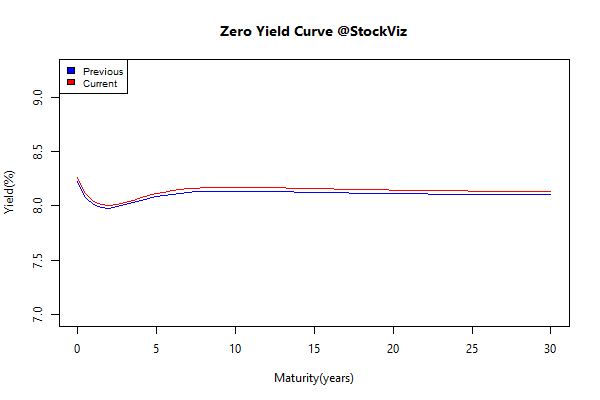
Yield Curve

yield Curve.2014-11-7.2014-11-14

Bond Indices

Sub Index Change in YTM Total Return(%)
GSEC TB +0.17 +0.11%
GSEC SUB 1-3 +0.17 +0.01%
GSEC SUB 3-8 -0.10 -0.01%
GSEC SUB 8 -0.05 +0.37%
The flat yield curve drifted down with lower inflation numbers and rate cut expectations.

Theme Performance

Thought for the weekend

Lessons and observations from the recent FX scandal:

  1. Everyone was much more interested in managing the dealing costs that they could see, not the execution quality which they couldn’t.
  2. Information is currency. But regulators tend to like to work on the assumption of markets in which everyone has exactly the same information set. Paying in information is sometimes cheaper for the client than paying in money.
  3. The client keeps on bidding the visible cost of trades downward, but isn’t prepared to put in any effort at all on his own part to see what consequences this has.

Source: Oranges, lemons and forex

Weekly Recap: Freedom to Win

world.2014-10-31.2014-11-07

Equities

Major
DAX(DEU) -0.38%
CAC(FRA) -1.02%
UKX(GBR) +0.32%
NKY(JPN) +2.84%
SPX(USA) +0.90%
MINTs
JCI(IDN) -2.01%
INMEX(MEX) -1.17%
NGSEINDX(NGA) -11.52%
XU030(TUR) -3.38%
BRICS
IBOV(BRA) -1.09%
SHCOMP(CHN) -0.08%
NIFTY(IND) +0.18%
INDEXCF(RUS) +0.58%
TOP40(ZAF) +0.97%

Commodities

Energy
Brent Crude Oil -2.98%
Ethanol +2.19%
Heating Oil -1.20%
Natural Gas +12.77%
RBOB Gasoline -2.40%
WTI Crude Oil -2.73%
Metals
Copper -0.33%
Gold 100oz -0.03%
Palladium -2.37%
Platinum -1.35%
Silver 5000oz -5.66%

Currencies

USDEUR:+0.65% USDJPY:+2.16%

MINTs
USDIDR(IDN) +0.77%
USDMXN(MEX) +0.60%
USDNGN(NGA) +0.06%
USDTRY(TUR) +1.77%
BRICS
USDBRL(BRA) +3.46%
USDCNY(CHN) +0.15%
USDINR(IND) +0.44%
USDRUB(RUS) +8.63%
USDZAR(ZAF) +2.38%
Agricultural
Cattle -1.60%
Cocoa +0.78%
Coffee (Arabica) -2.94%
Coffee (Robusta) -1.56%
Corn -2.33%
Cotton +0.61%
Feeder Cattle +1.73%
Lean Hogs +0.70%
Lumber +0.43%
Orange Juice -5.07%
Soybean Meal +1.32%
Soybeans -2.50%
Sugar #11 -2.06%
Wheat -3.20%
White Sugar -1.04%

Credit Indices

Index Change
Markit CDX EM +0.14%
Markit CDX NA HY +0.38%
Markit CDX NA IG -1.85%
Markit CDX NA IG HVOL -0.83%
Markit iTraxx Asia ex-Japan IG -4.08%
Markit iTraxx Australia -2.75%
Markit iTraxx Europe -2.67%
Markit iTraxx Europe Crossover -8.85%
Markit iTraxx Japan -4.21%
Markit iTraxx SovX Western Europe -0.66%
Markit LCDX (Loan CDS) +0.04%
Markit MCDX (Municipal CDS) -2.00%
The US Dollar continued to rally with the Ruble and Yen bearing the brunt. Oil continued its slide.

Nifty heatmap
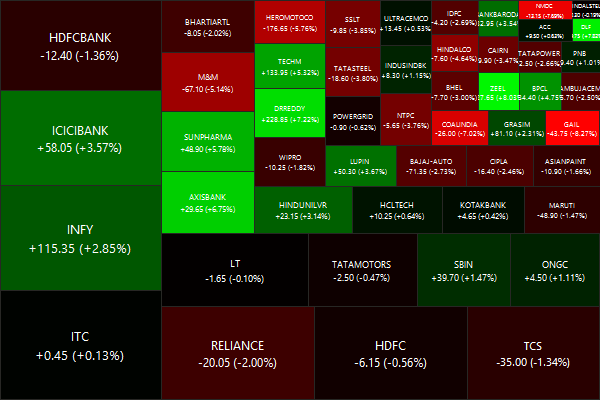
CNX NIFTY.2014-10-31.2014-11-07

Index Returns

index performance.2014-10-31.2014-11-07

Sector Performance

sector performance.2014-10-31.2014-11-07

Advance Decline

advance.decline.line2.2014-10-31.2014-11-07

Market cap decile performance

Decile Mkt. Cap. Adv/Decl
1 (micro) -0.08% 72/68
2 +3.25% 78/61
3 +3.16% 77/62
4 +3.00% 70/69
5 +2.24% 75/65
6 +1.28% 70/69
7 +3.19% 75/65
8 +2.16% 71/68
9 +1.96% 75/65
10 (mega) +0.72% 70/70
Midcaps outperformed the large caps this week…

Top winners and losers

ZEEL +8.03%
CUMMINSIND +9.15%
GLENMARK +11.34%
GAIL -8.27%
NMDC -7.69%
COALINDIA -7.02%
Coal India – soon to be and irrelevant, strike-plagued ex-monopoly.

ETFs

PSUBNKBEES +2.83%
INFRABEES +2.70%
BANKBEES +1.30%
NIFTYBEES +0.50%
JUNIORBEES -0.79%
GOLDBEES -1.52%
CPSEETF -2.36%
Banks continued to outperform the rest of the indices. PSU banks – turning around?

Nifty OI
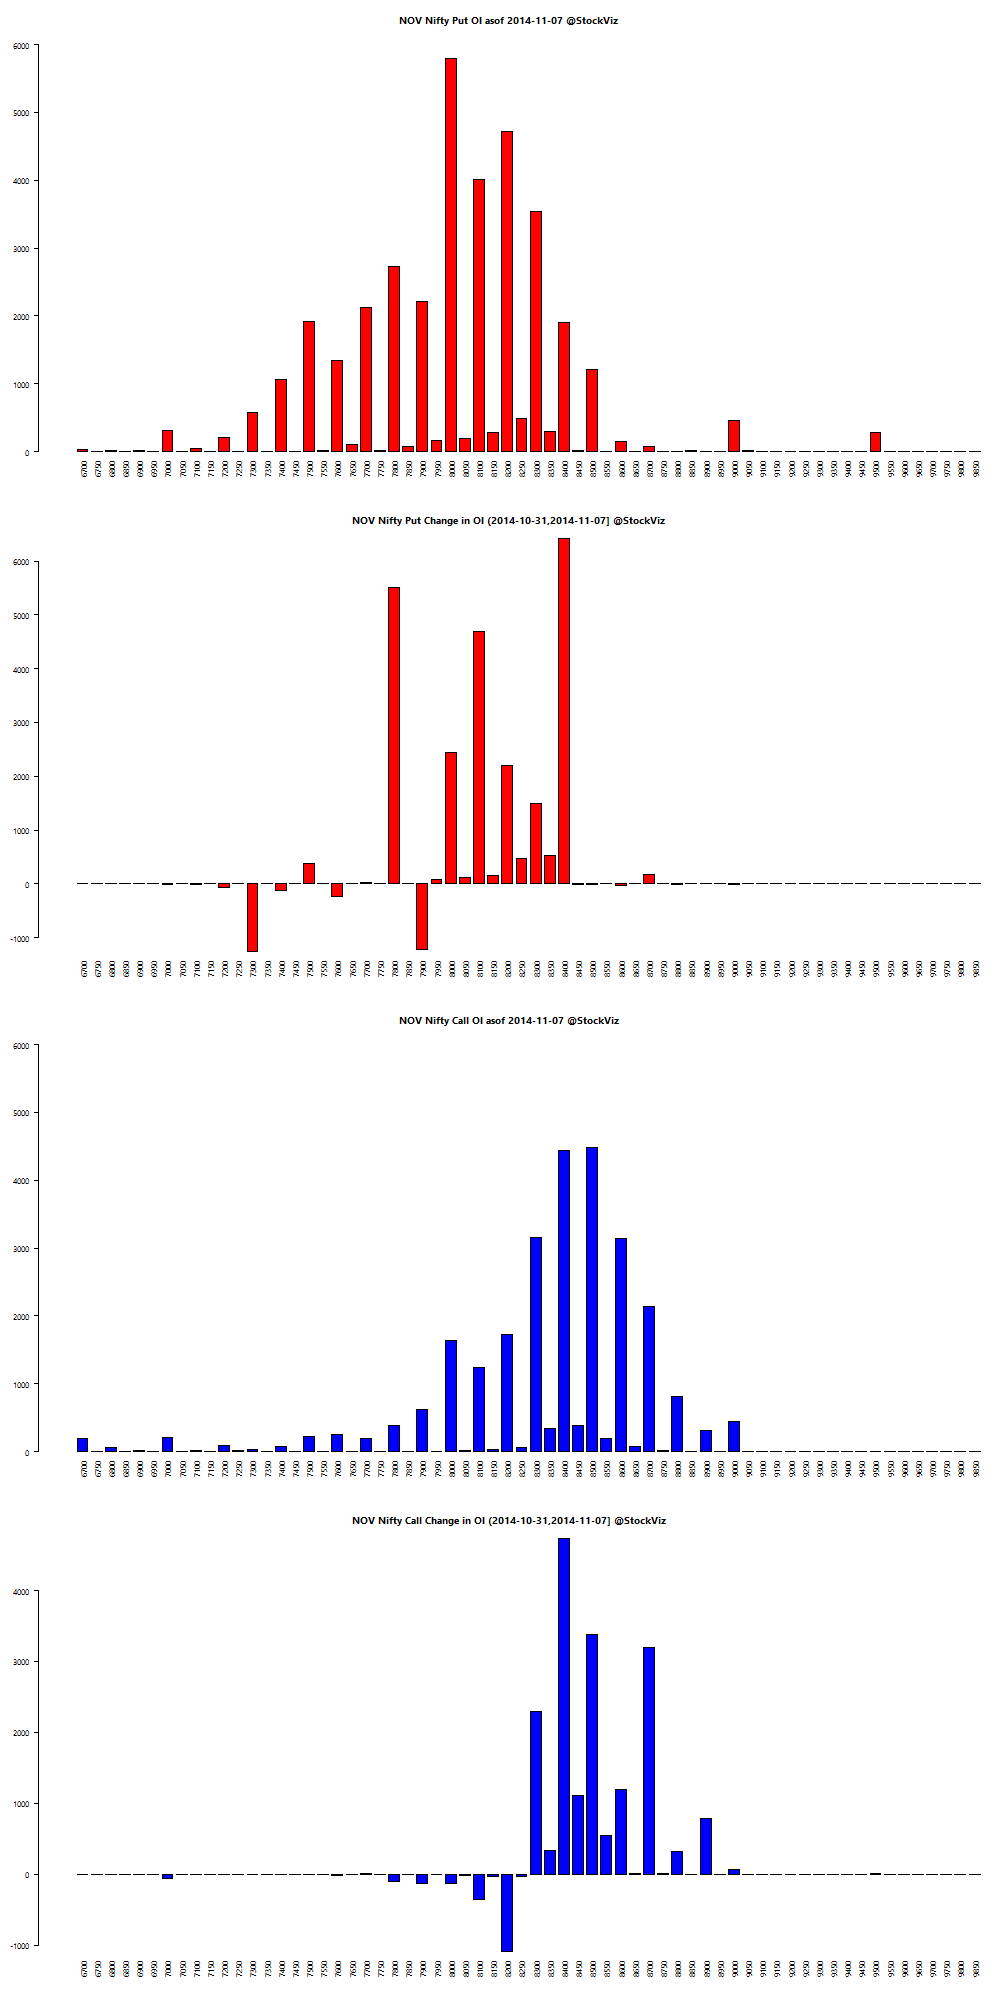
nifty.puts.calls.NOV.2014-10-31.2014-11-07

Yield Curve

yield Curve.2014-10-31.2014-11-07

Bond Indices

Sub Index Change in YTM Total Return(%)
GSEC TB -0.39 +0.27%
GSEC SUB 1-3 -0.21 +0.68%
GSEC SUB 3-8 -0.18 +0.78%
GSEC SUB 8 -0.07 +0.81%
The entire curve shifted down, and its now flat enough to crack some eggs and make an omelette.

Theme Performance

Thought for the weekend

When you’re in freedom to win mode, you’re constantly focused on improving your position, capabilities and odds of winning. You are always evaluating strategies, and making up clever lines of attack or defense. The activity that glues the rest of your activities together is keeping score.

In poker, due to the inherently probabilistic nature of the game, technically perfect game-play can still lead to a loss, so players of those finite games make sure they keep two kinds of score: actual wins/losses, and a separate score that measures whether or not they played correctly, whatever the outcome.

This separation of technical score-keeping and outcome score-keeping leads to a more dangerous place: score-keeping becoming sufficient to sustain finite-game mindsets even when the game is ambiguous or unclear, and there is no agreement among players about what the goal is.

Money is the classic example of a mechanism for keeping score that is divorced from outcomes.

Read the whole thing here: Don’t Surround Yourself With Smarter People