Tag: weekly

Weekly Recap: Wisdom in the Age of Information

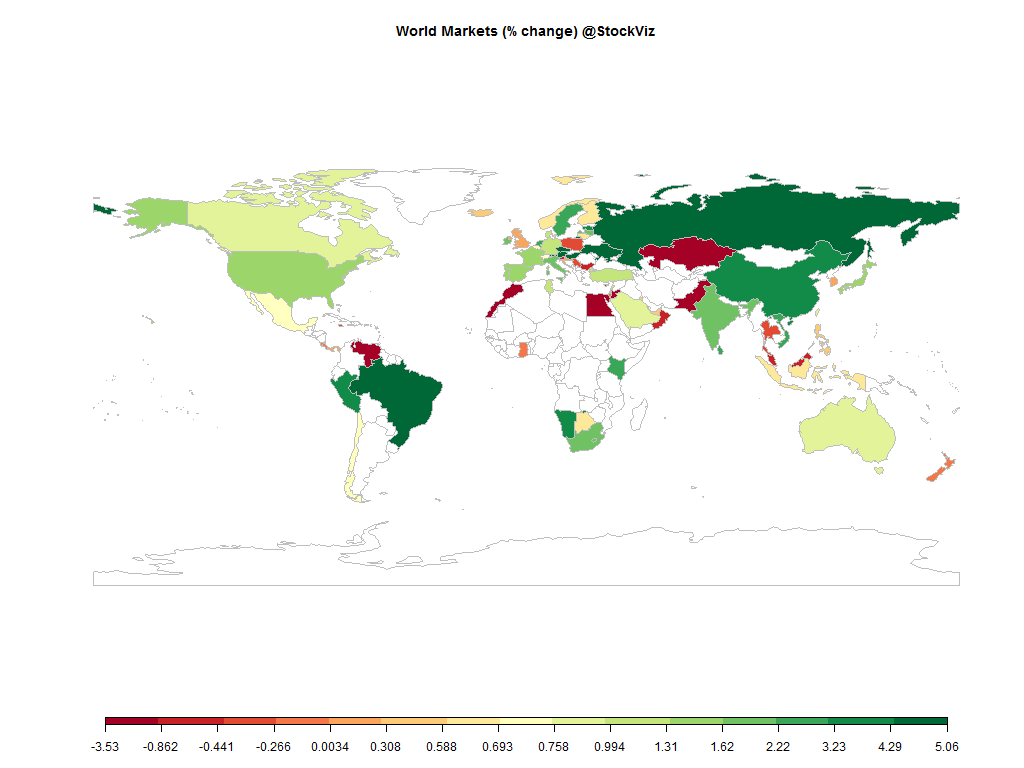
world.2015-02-20.2015-02-28

Equities

Major
DAX(DEU) +3.18%
CAC(FRA) +2.50%
UKX(GBR) +0.45%
NKY(JPN) +2.54%
SPX(USA) +0.18%
MINTs
JCI(IDN) +0.93%
INMEX(MEX) +1.75%
NGSEINDX(NGA) +2.45%
XU030(TUR) -1.91%
BRICS
IBOV(BRA) +0.82%
SHCOMP(CHN) +1.95%
NIFTY(IND) +0.12%
INDEXCF(RUS) -1.88%
TOP40(ZAF) +0.60%

Commodities

Energy
Brent Crude Oil +3.85%
Ethanol +0.42%
Natural Gas -8.20%
WTI Crude Oil -2.02%
Heating Oil -6.88%
RBOB Gasoline +20.39%
Metals
Copper +3.44%
Gold 100oz +0.61%
Palladium +5.14%
Platinum +1.58%
Silver 5000oz +0.61%

Currencies

USDEUR:+2.02% USDJPY:+0.67%

MINTs
USDIDR(IDN) +0.84%
USDMXN(MEX) -0.62%
USDNGN(NGA) +1.64%
USDTRY(TUR) +2.36%
BRICS
USDBRL(BRA) -1.14%
USDCNY(CHN) +0.21%
USDINR(IND) -0.61%
USDRUB(RUS) -0.34%
USDZAR(ZAF) +0.24%
Agricultural
Coffee (Robusta) -3.55%
Cotton -0.71%
Lean Hogs +1.80%
Soybean Meal +1.03%
Wheat +0.49%
Cocoa -0.05%
Corn -0.26%
Feeder Cattle +1.00%
Sugar #11 -4.02%
Cattle -3.31%
Lumber -2.08%
Orange Juice -7.56%
Soybeans +2.85%
Coffee (Arabica) -7.38%
White Sugar -2.34%

Credit Indices

Index Change
Markit CDX EM -0.18%
Markit CDX NA IG -2.78%
Markit iTraxx Asia ex-Japan IG -4.75%
Markit iTraxx Australia -4.66%
Markit iTraxx Europe -4.75%
Markit iTraxx Europe Crossover -29.42%
Markit iTraxx Japan -0.03%
Markit iTraxx SovX Western Europe -3.07%
Markit LCDX (Loan CDS) +0.05%
Markit MCDX (Municipal CDS) -1.28%
After all the hype and hoopla, it turned to be a meh budget.

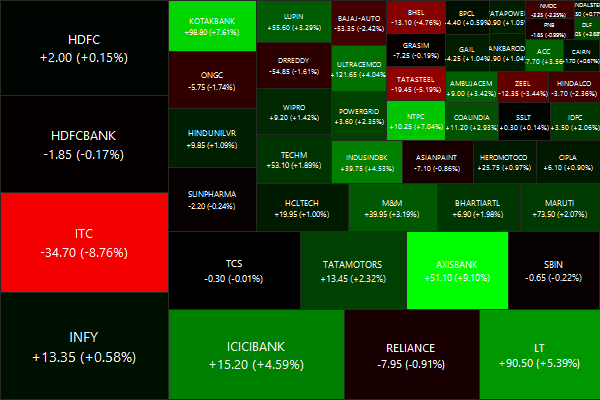
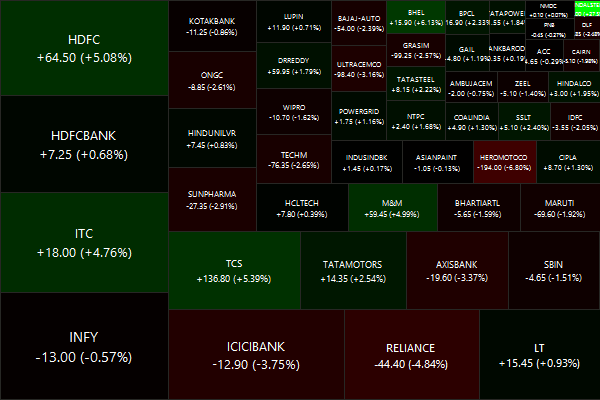
Nifty Heatmap

CNX NIFTY.2015-02-20.2015-02-28

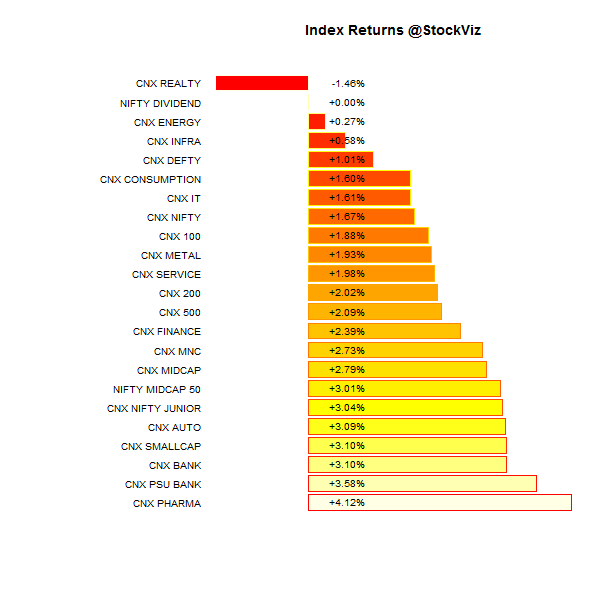
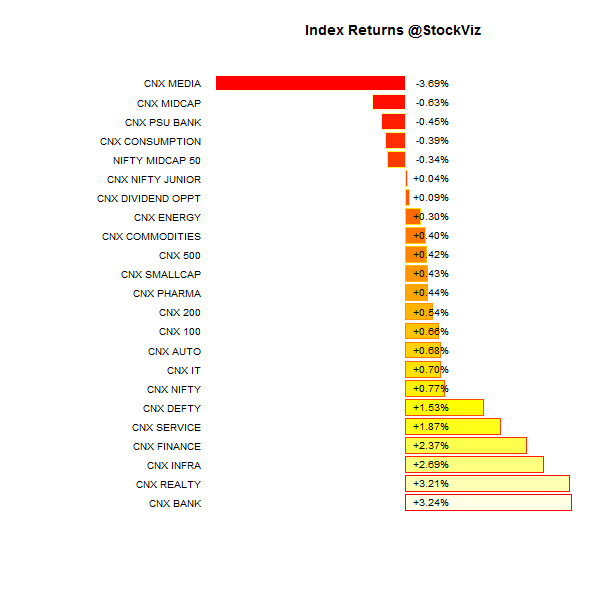
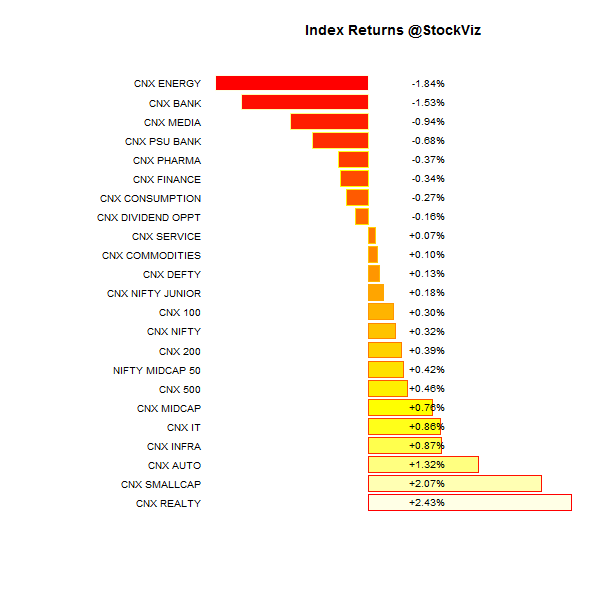
Index Returns

index performance.2015-02-20.2015-02-28

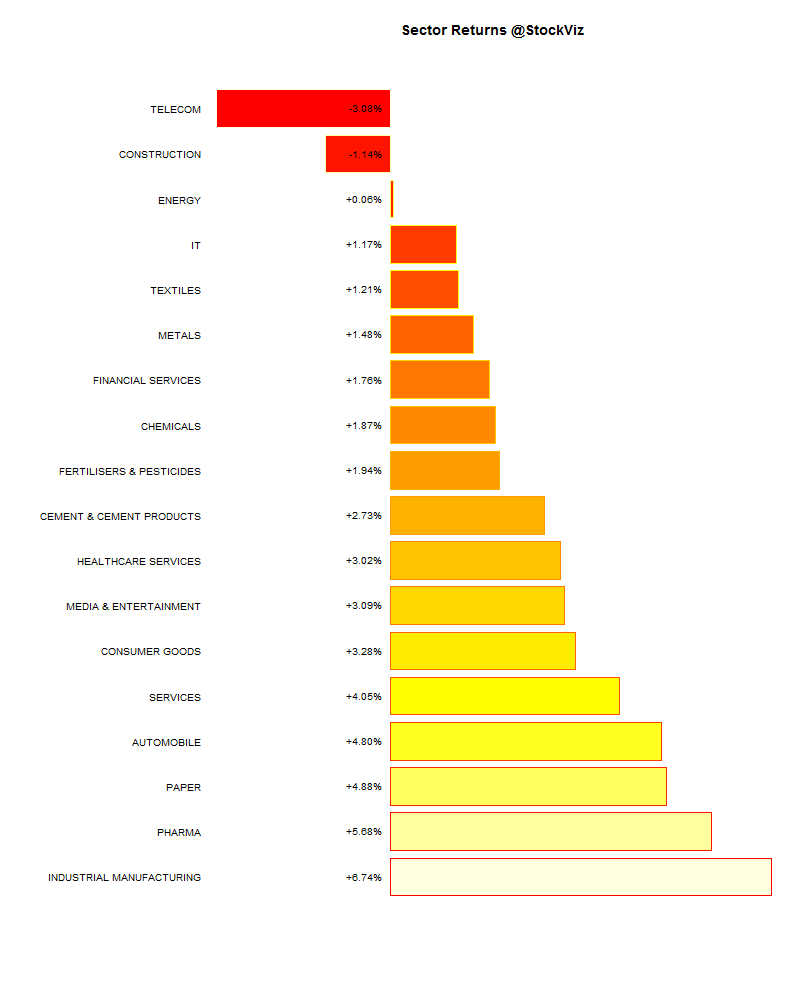
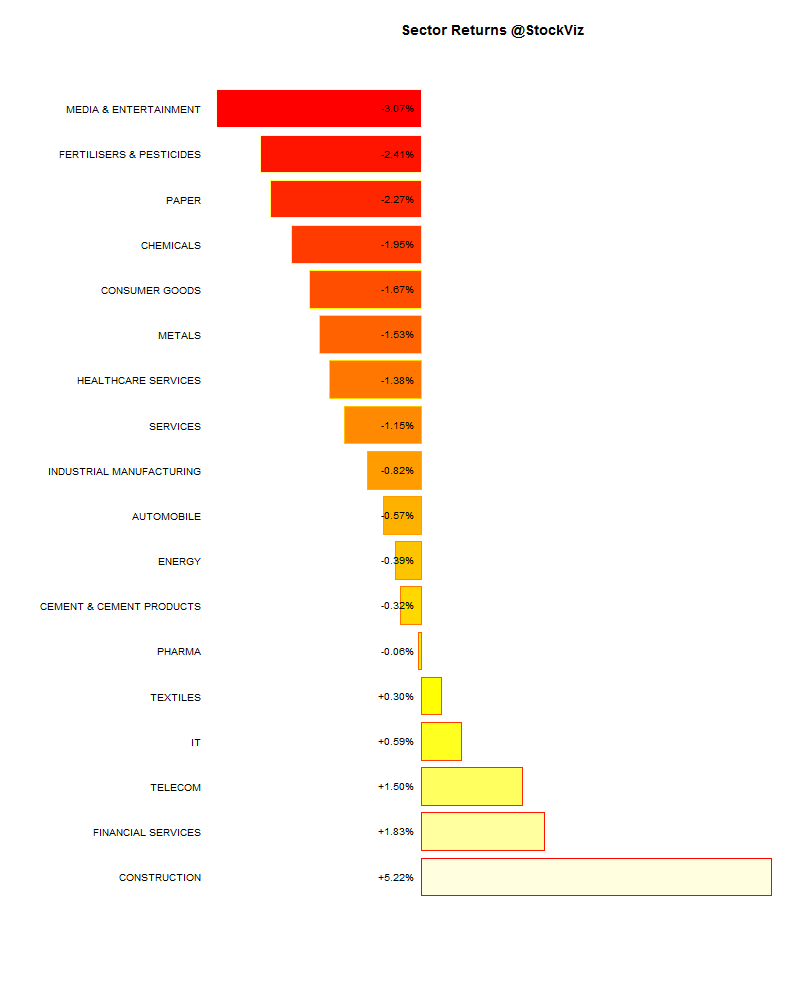
Sector Performance

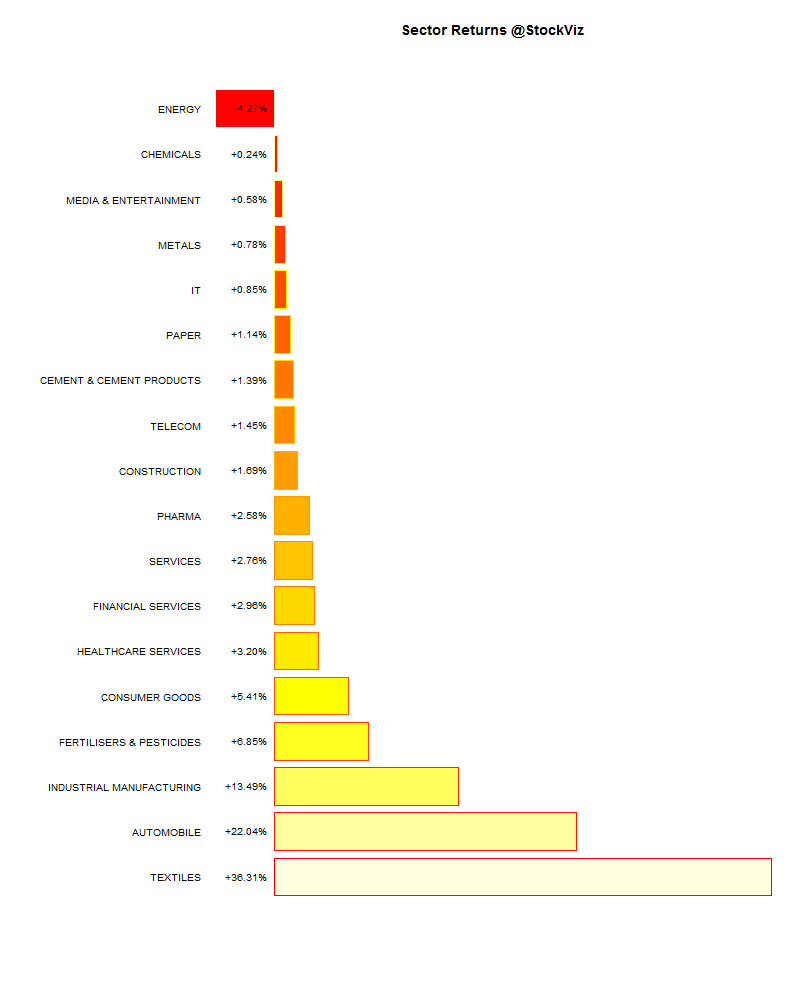
sector performance.2015-02-20.2015-02-28

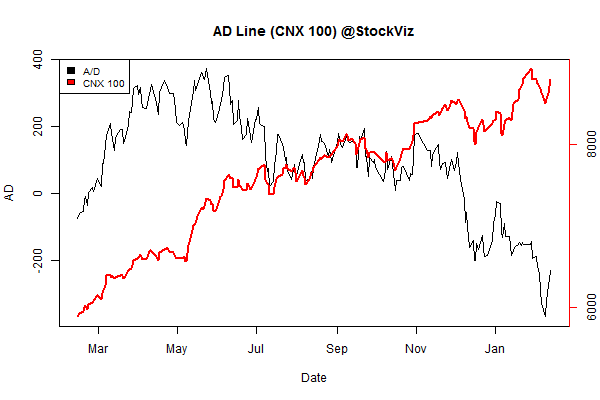
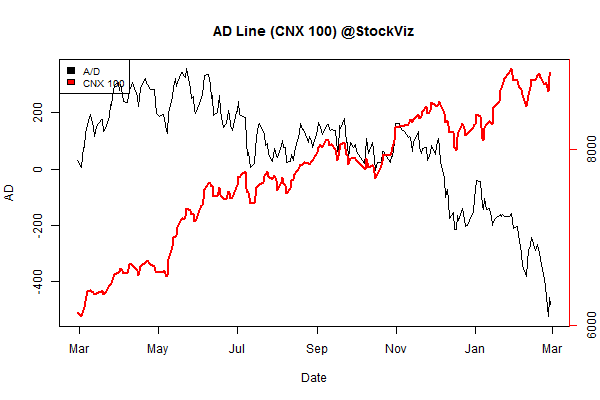
Advance Decline

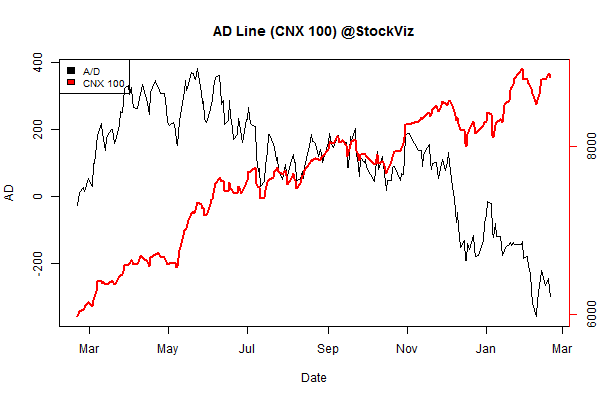
advance.decline.line2.2015-02-20.2015-02-28

Market Cap Decile Performance

Decile Mkt. Cap. Adv/Decl
1 (micro) -0.84% 68/67
2 -0.57% 71/63
3 -0.50% 66/69
4 -1.52% 57/78
5 -0.36% 70/65
6 -0.16% 65/70
7 -0.65% 64/71
8 -0.47% 68/67
9 +0.21% 62/73
10 (mega) -0.50% 66/69
Mal all around…

Top Winners and Losers

NTPC +7.04%
KOTAKBANK +7.61%
AXISBANK +9.10%
ITC -8.76%
SAIL -5.25%
MOTHERSUMI -5.22%
Investors are still trying to figure out what Make in India is all about.
Meanwhile, converging FPI & FDI might allow Axis Bank to be included back again into the MSCI India index.

ETF Performance

BANKBEES +2.94%
NIFTYBEES +0.66%
CPSEETF +0.44%
JUNIORBEES +0.36%
INFRABEES -1.08%
GOLDBEES -1.28%
PSUBNKBEES -2.43%
We still don’t know how PSU banks are going to fund themselves…

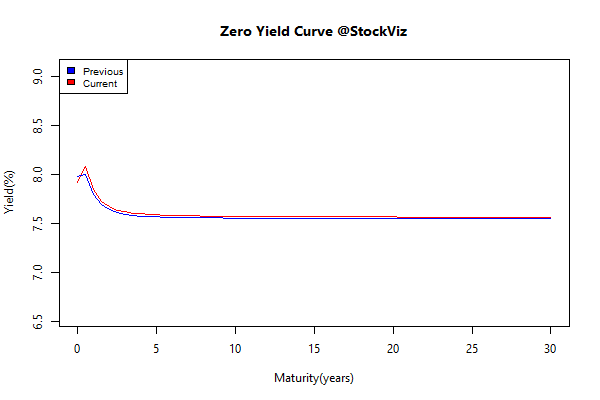
Yield Curve

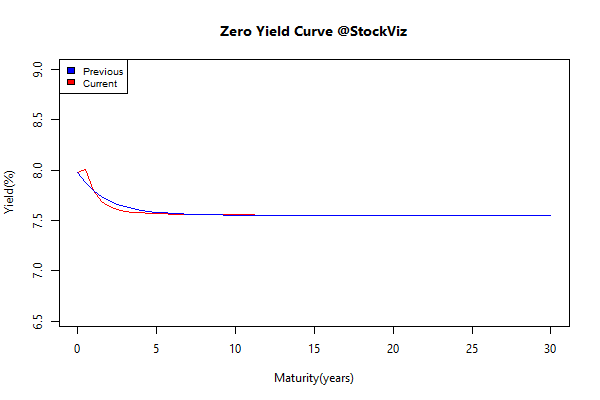
yield Curve.2015-02-20.2015-02-28

Bond Indices

Sub Index Change in YTM Total Return(%)
GSEC TB +0.14 +0.11%
GSEC SUB 1-3 +0.26 -0.12%
GSEC SUB 3-8 +0.17 -0.41%
GSEC SUB 8 +0.06 -0.21%
A flat yield curve, going nowhere in a hurry…

Investment Theme Performance

Equity Mutual Funds

Bond Mutual Funds

Thought for the weekend

We live in a world awash with information, but we seem to face a growing scarcity of wisdom. And what’s worse, we confuse the two. We believe that having access to more information produces more knowledge, which results in more wisdom. But, if anything, the opposite is true — more and more information without the proper context and interpretation only muddles our understanding of the world rather than enriching it.

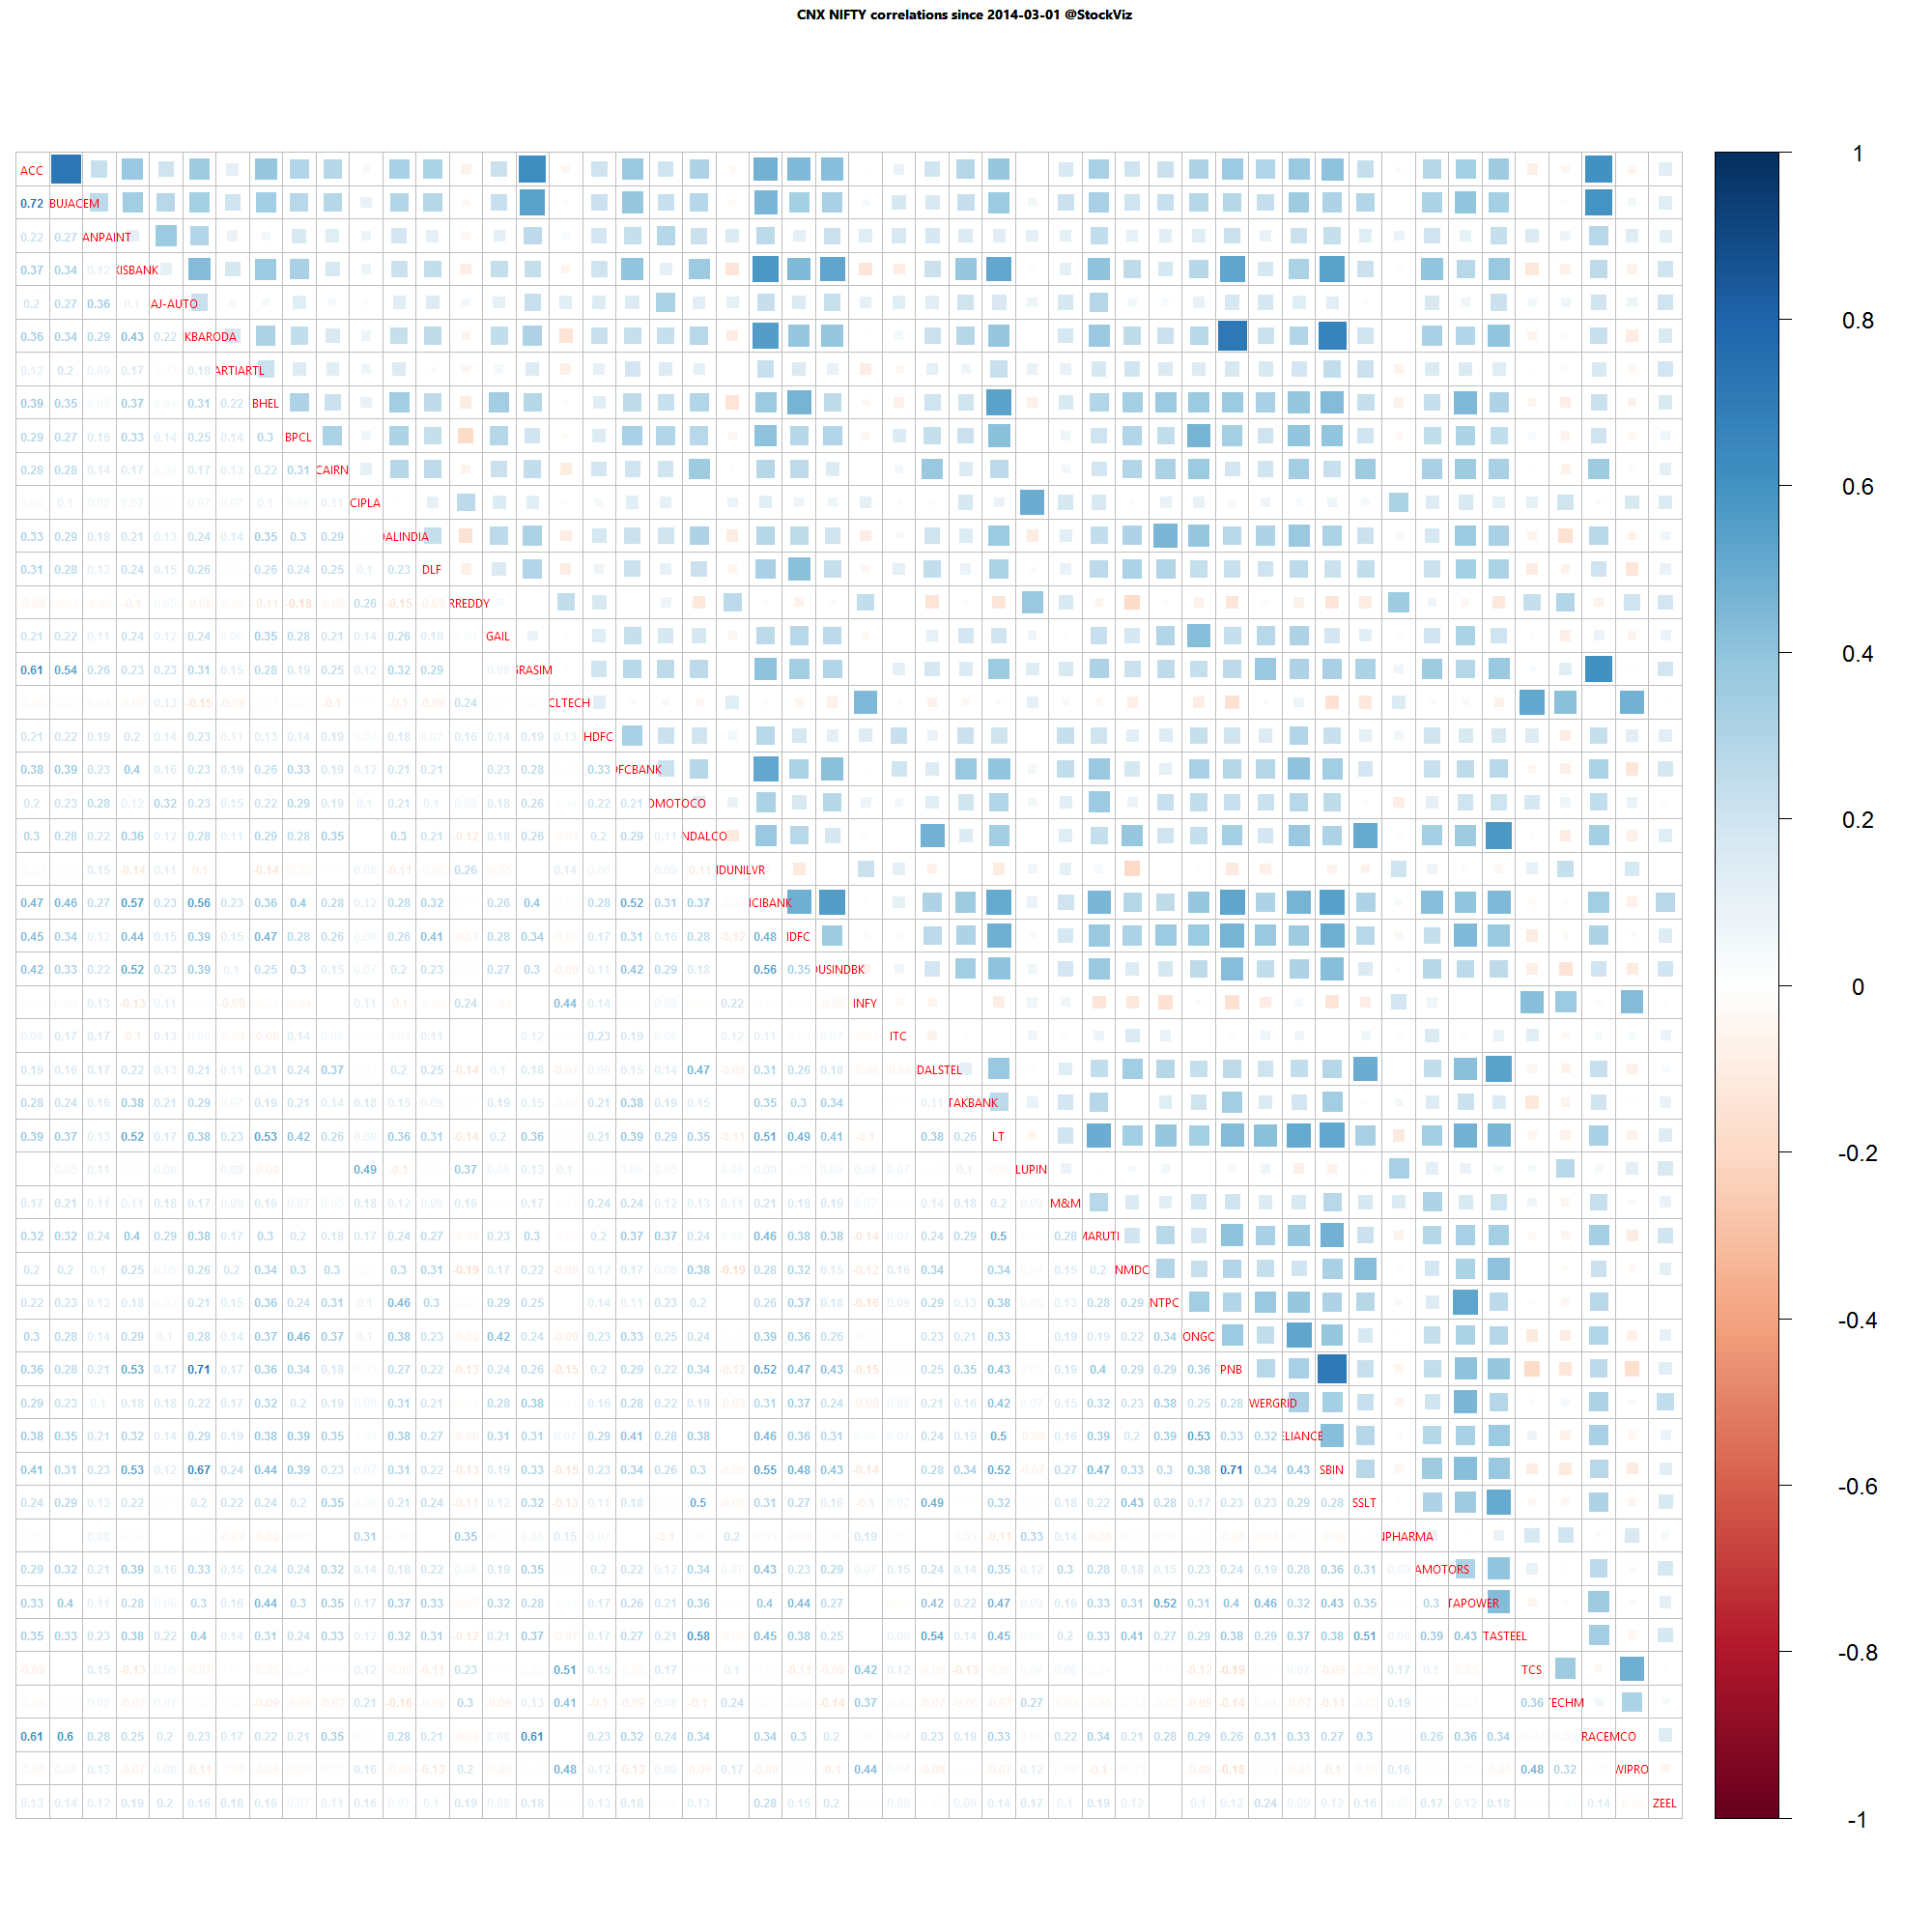
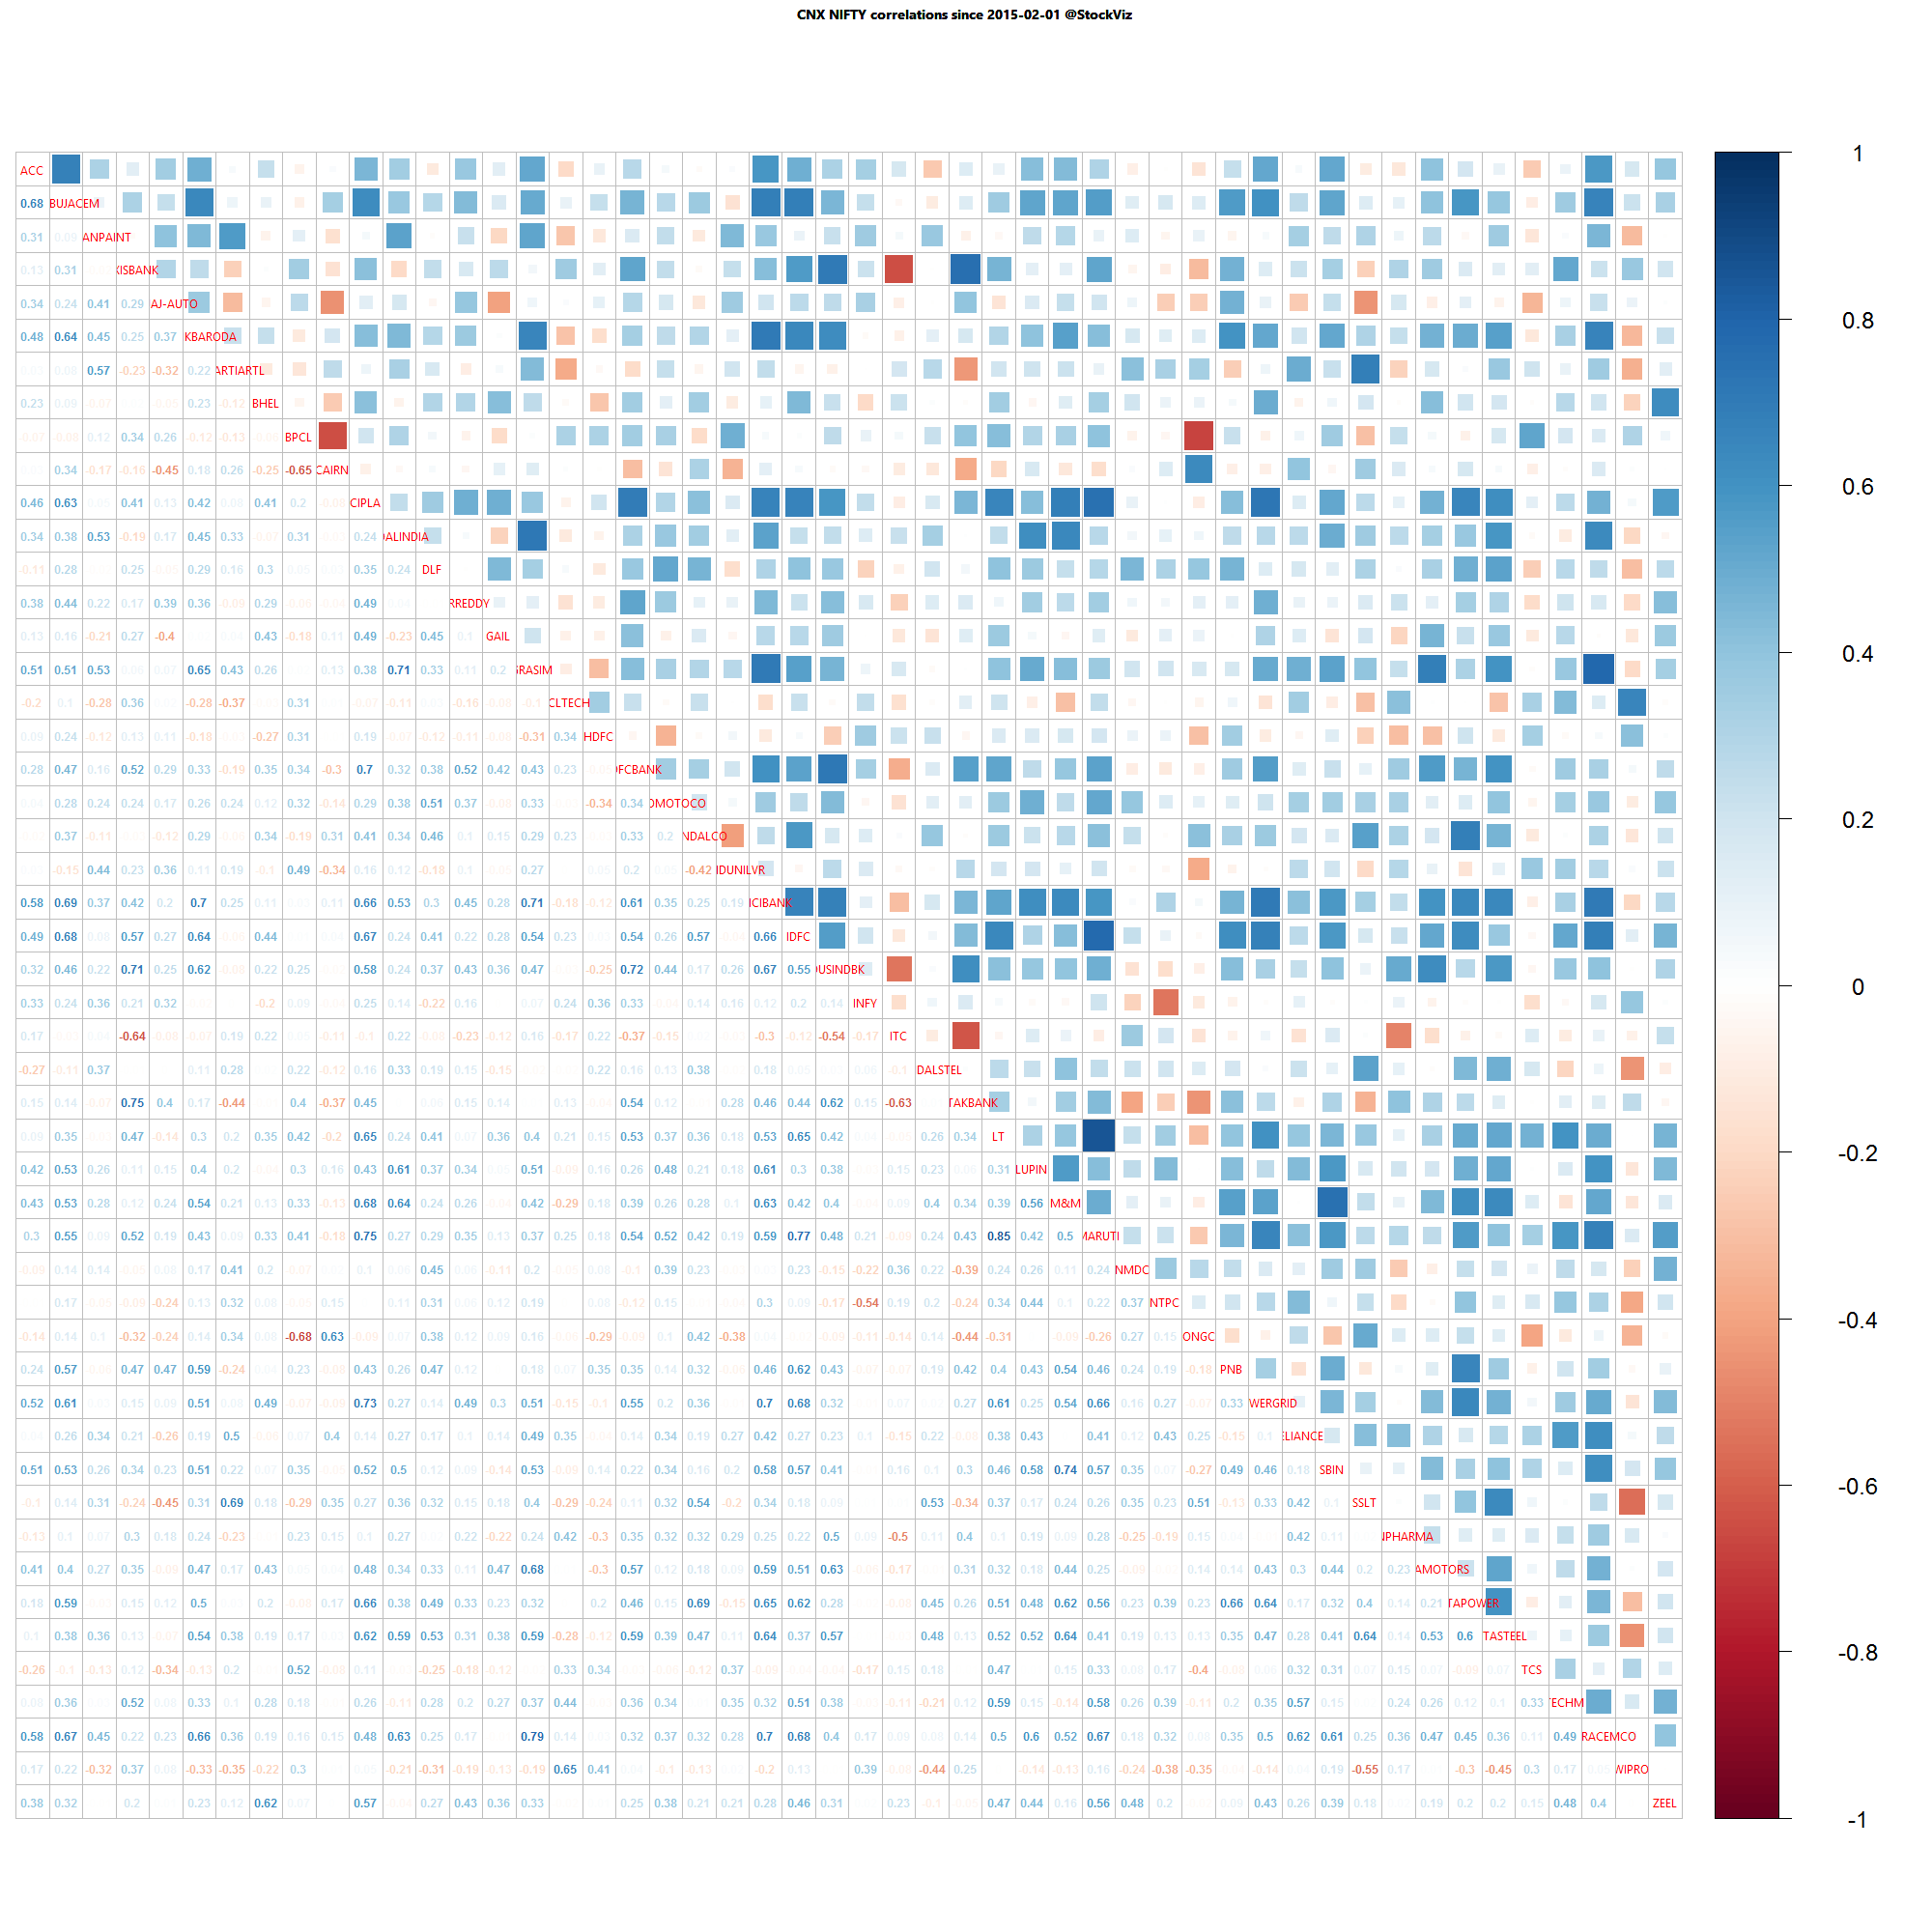
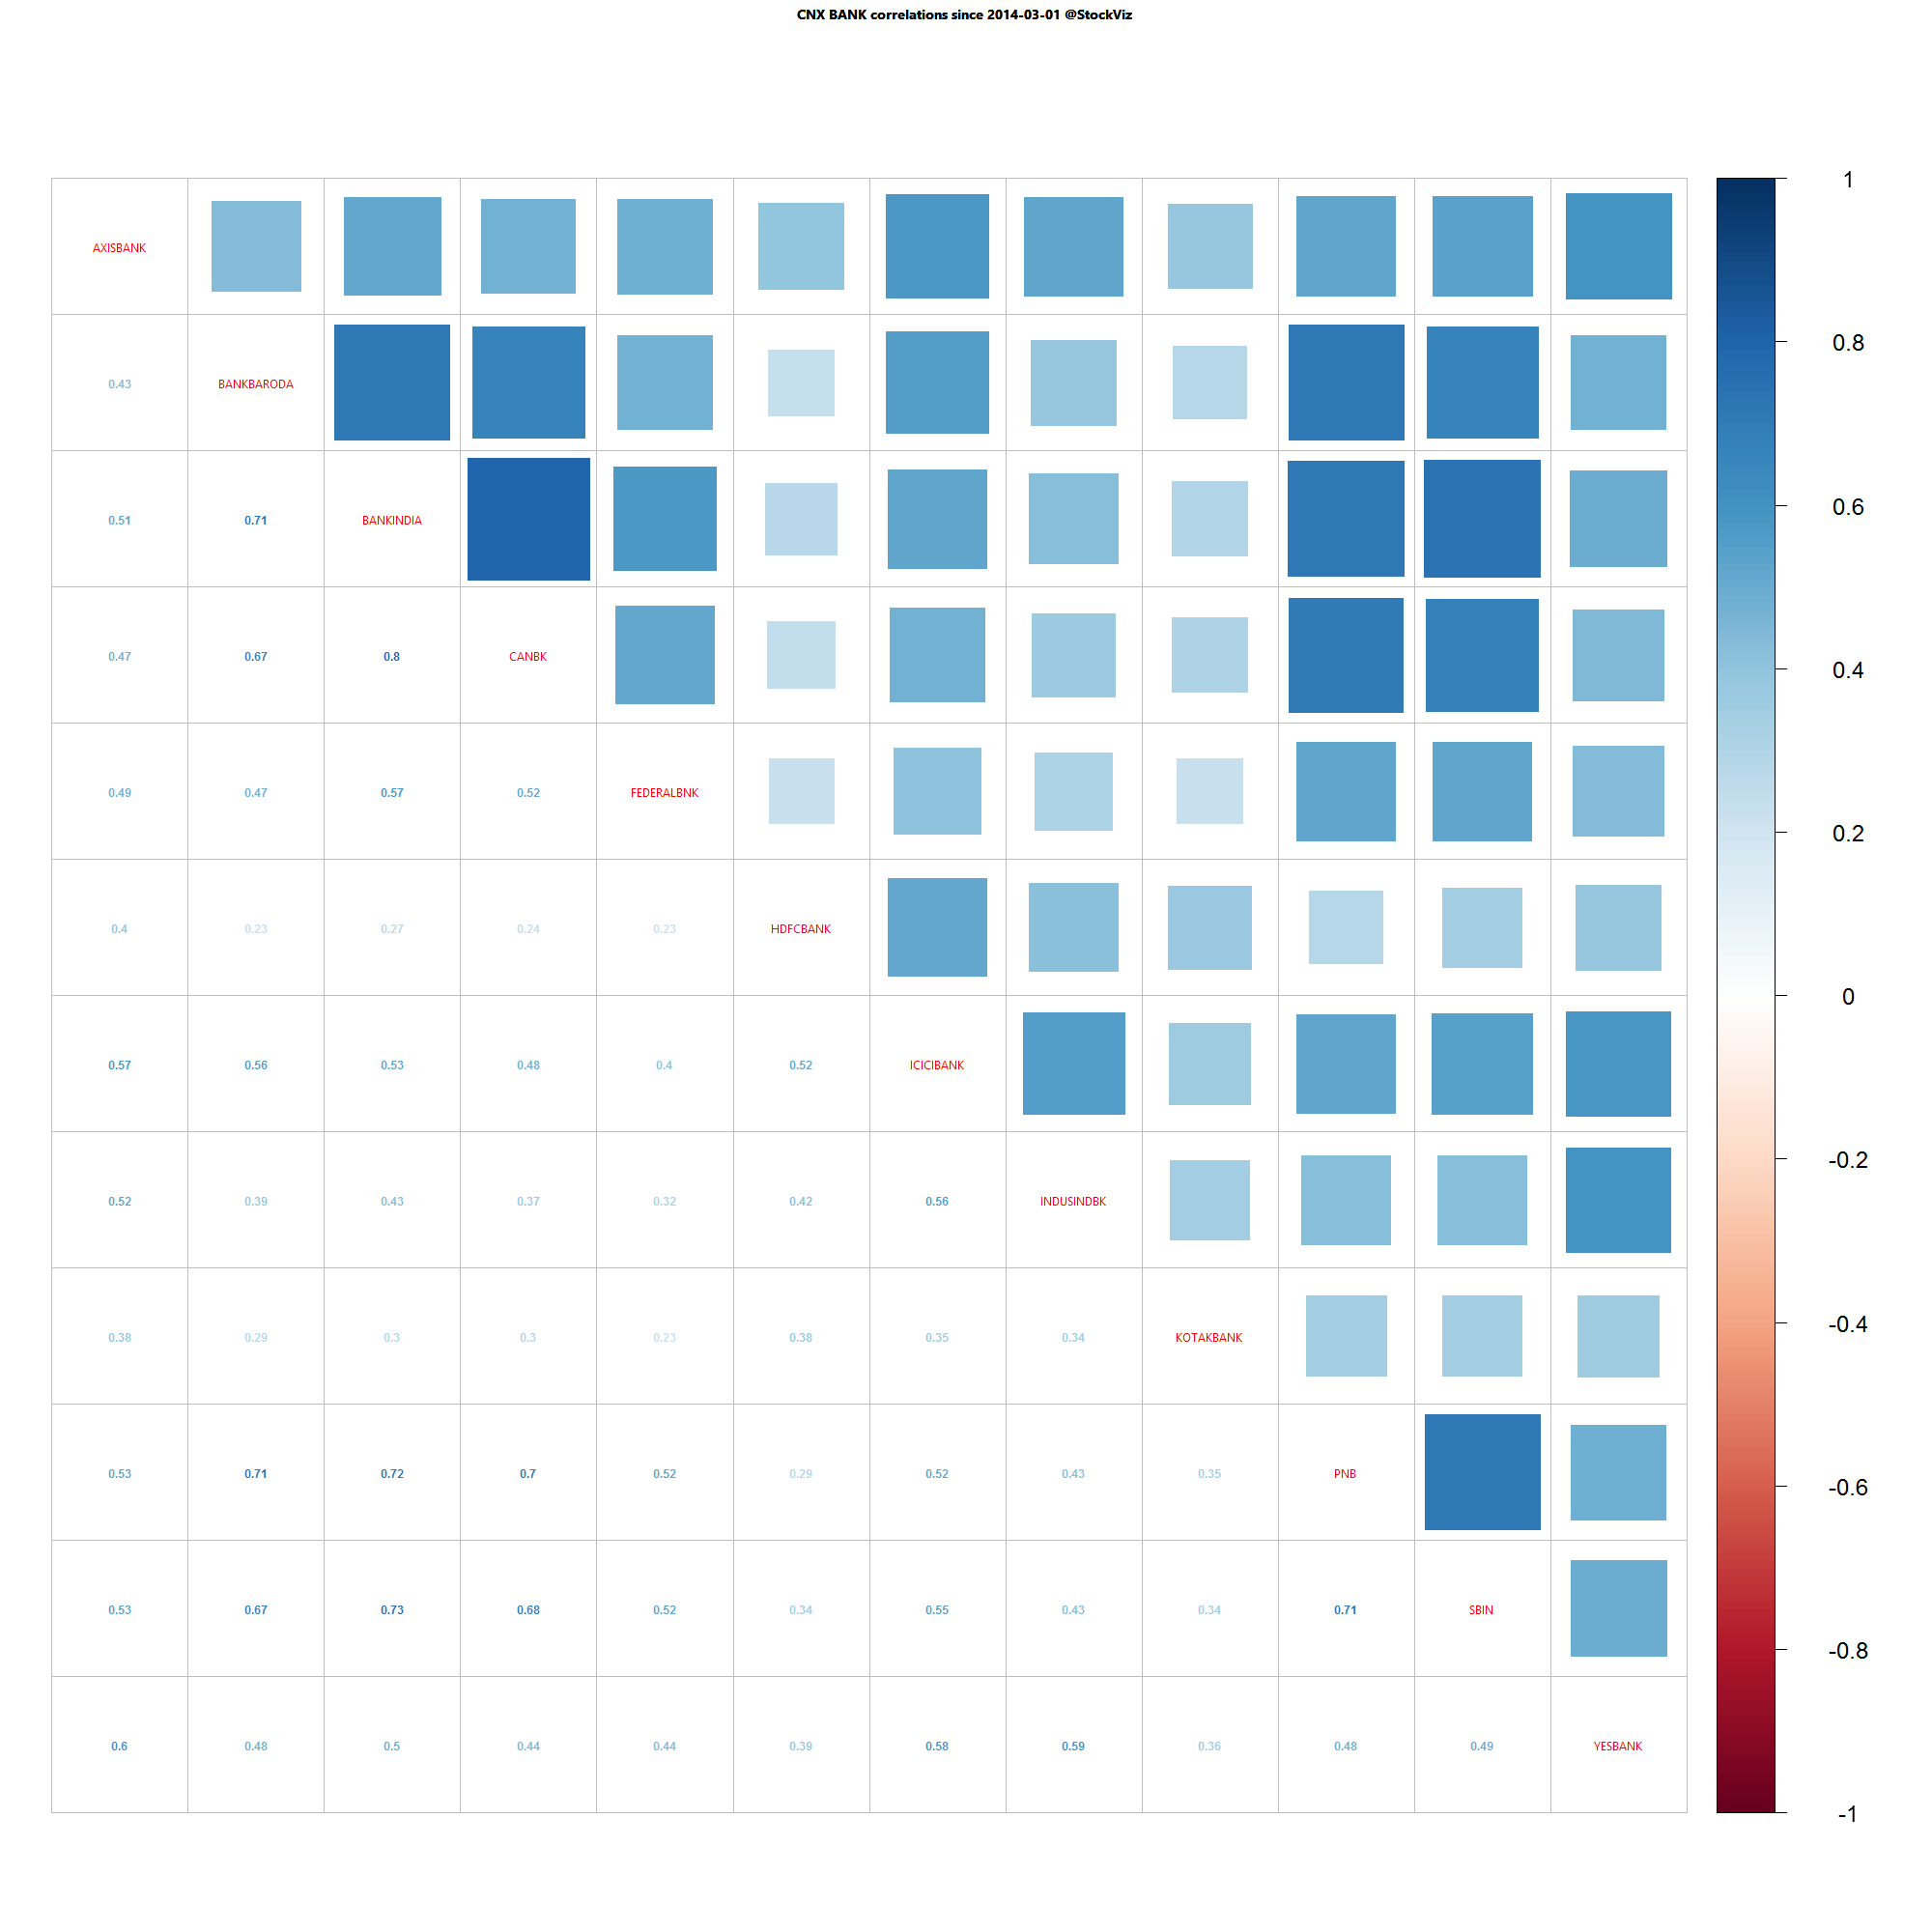
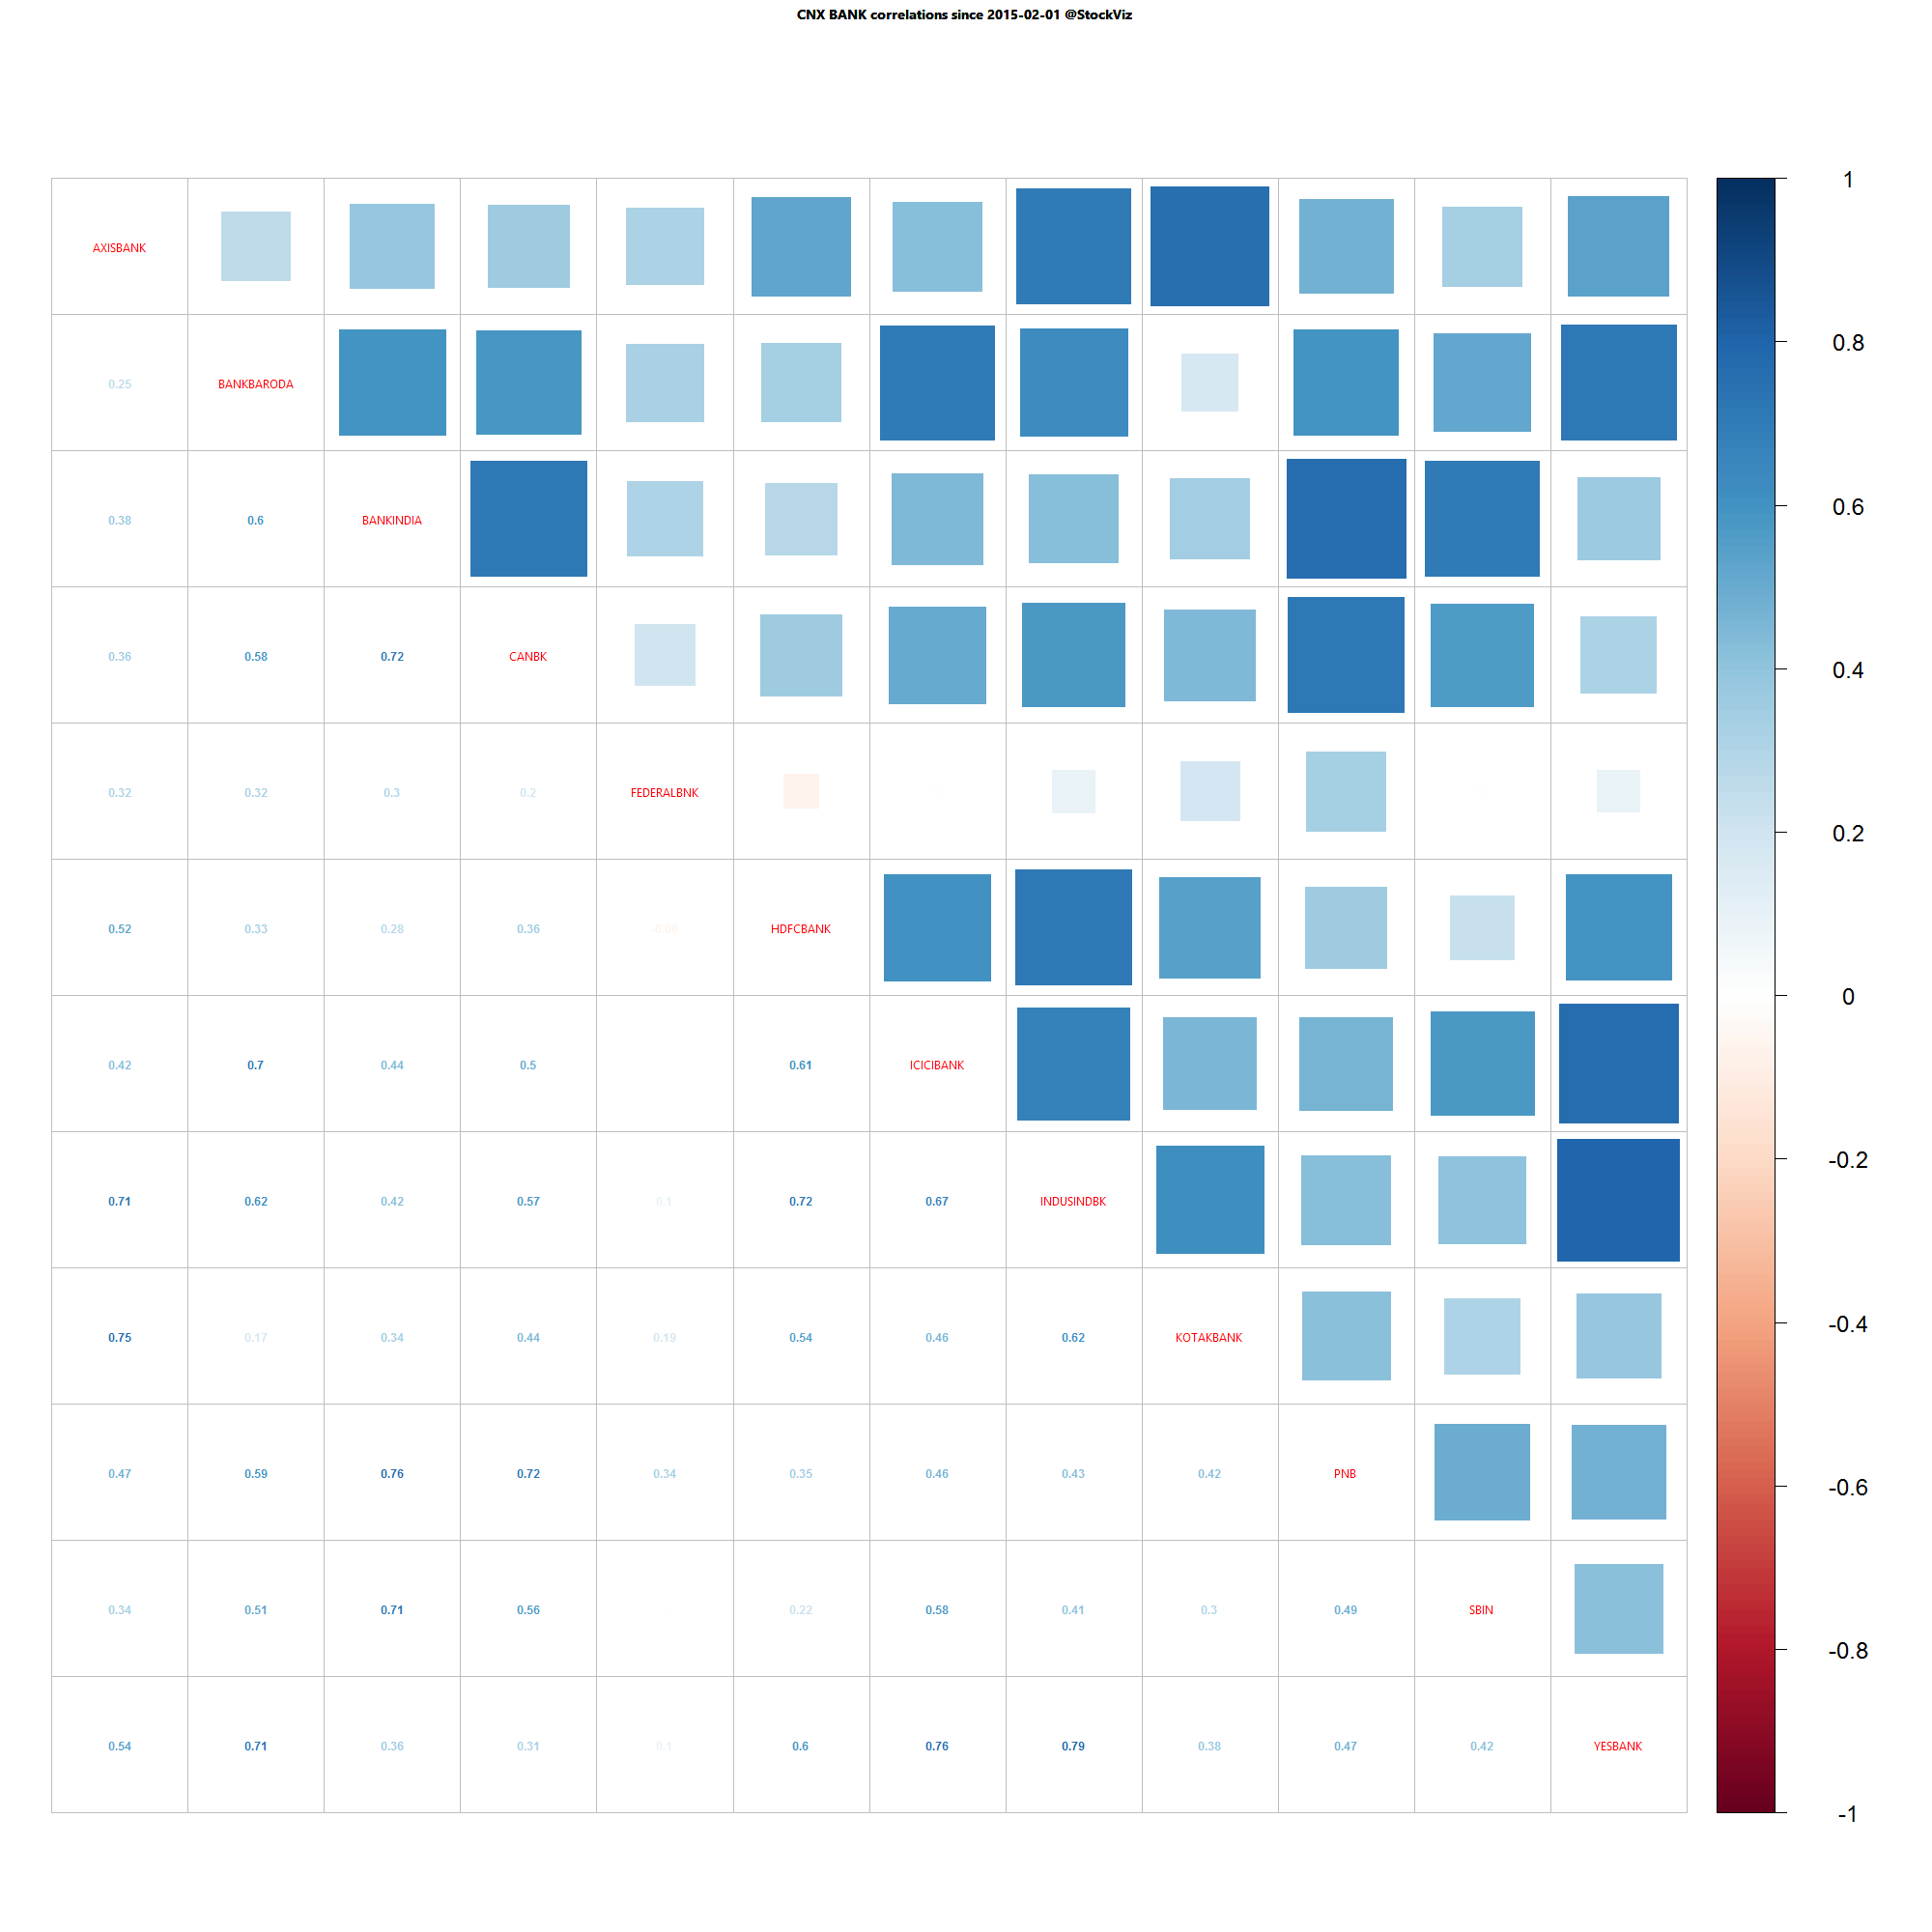
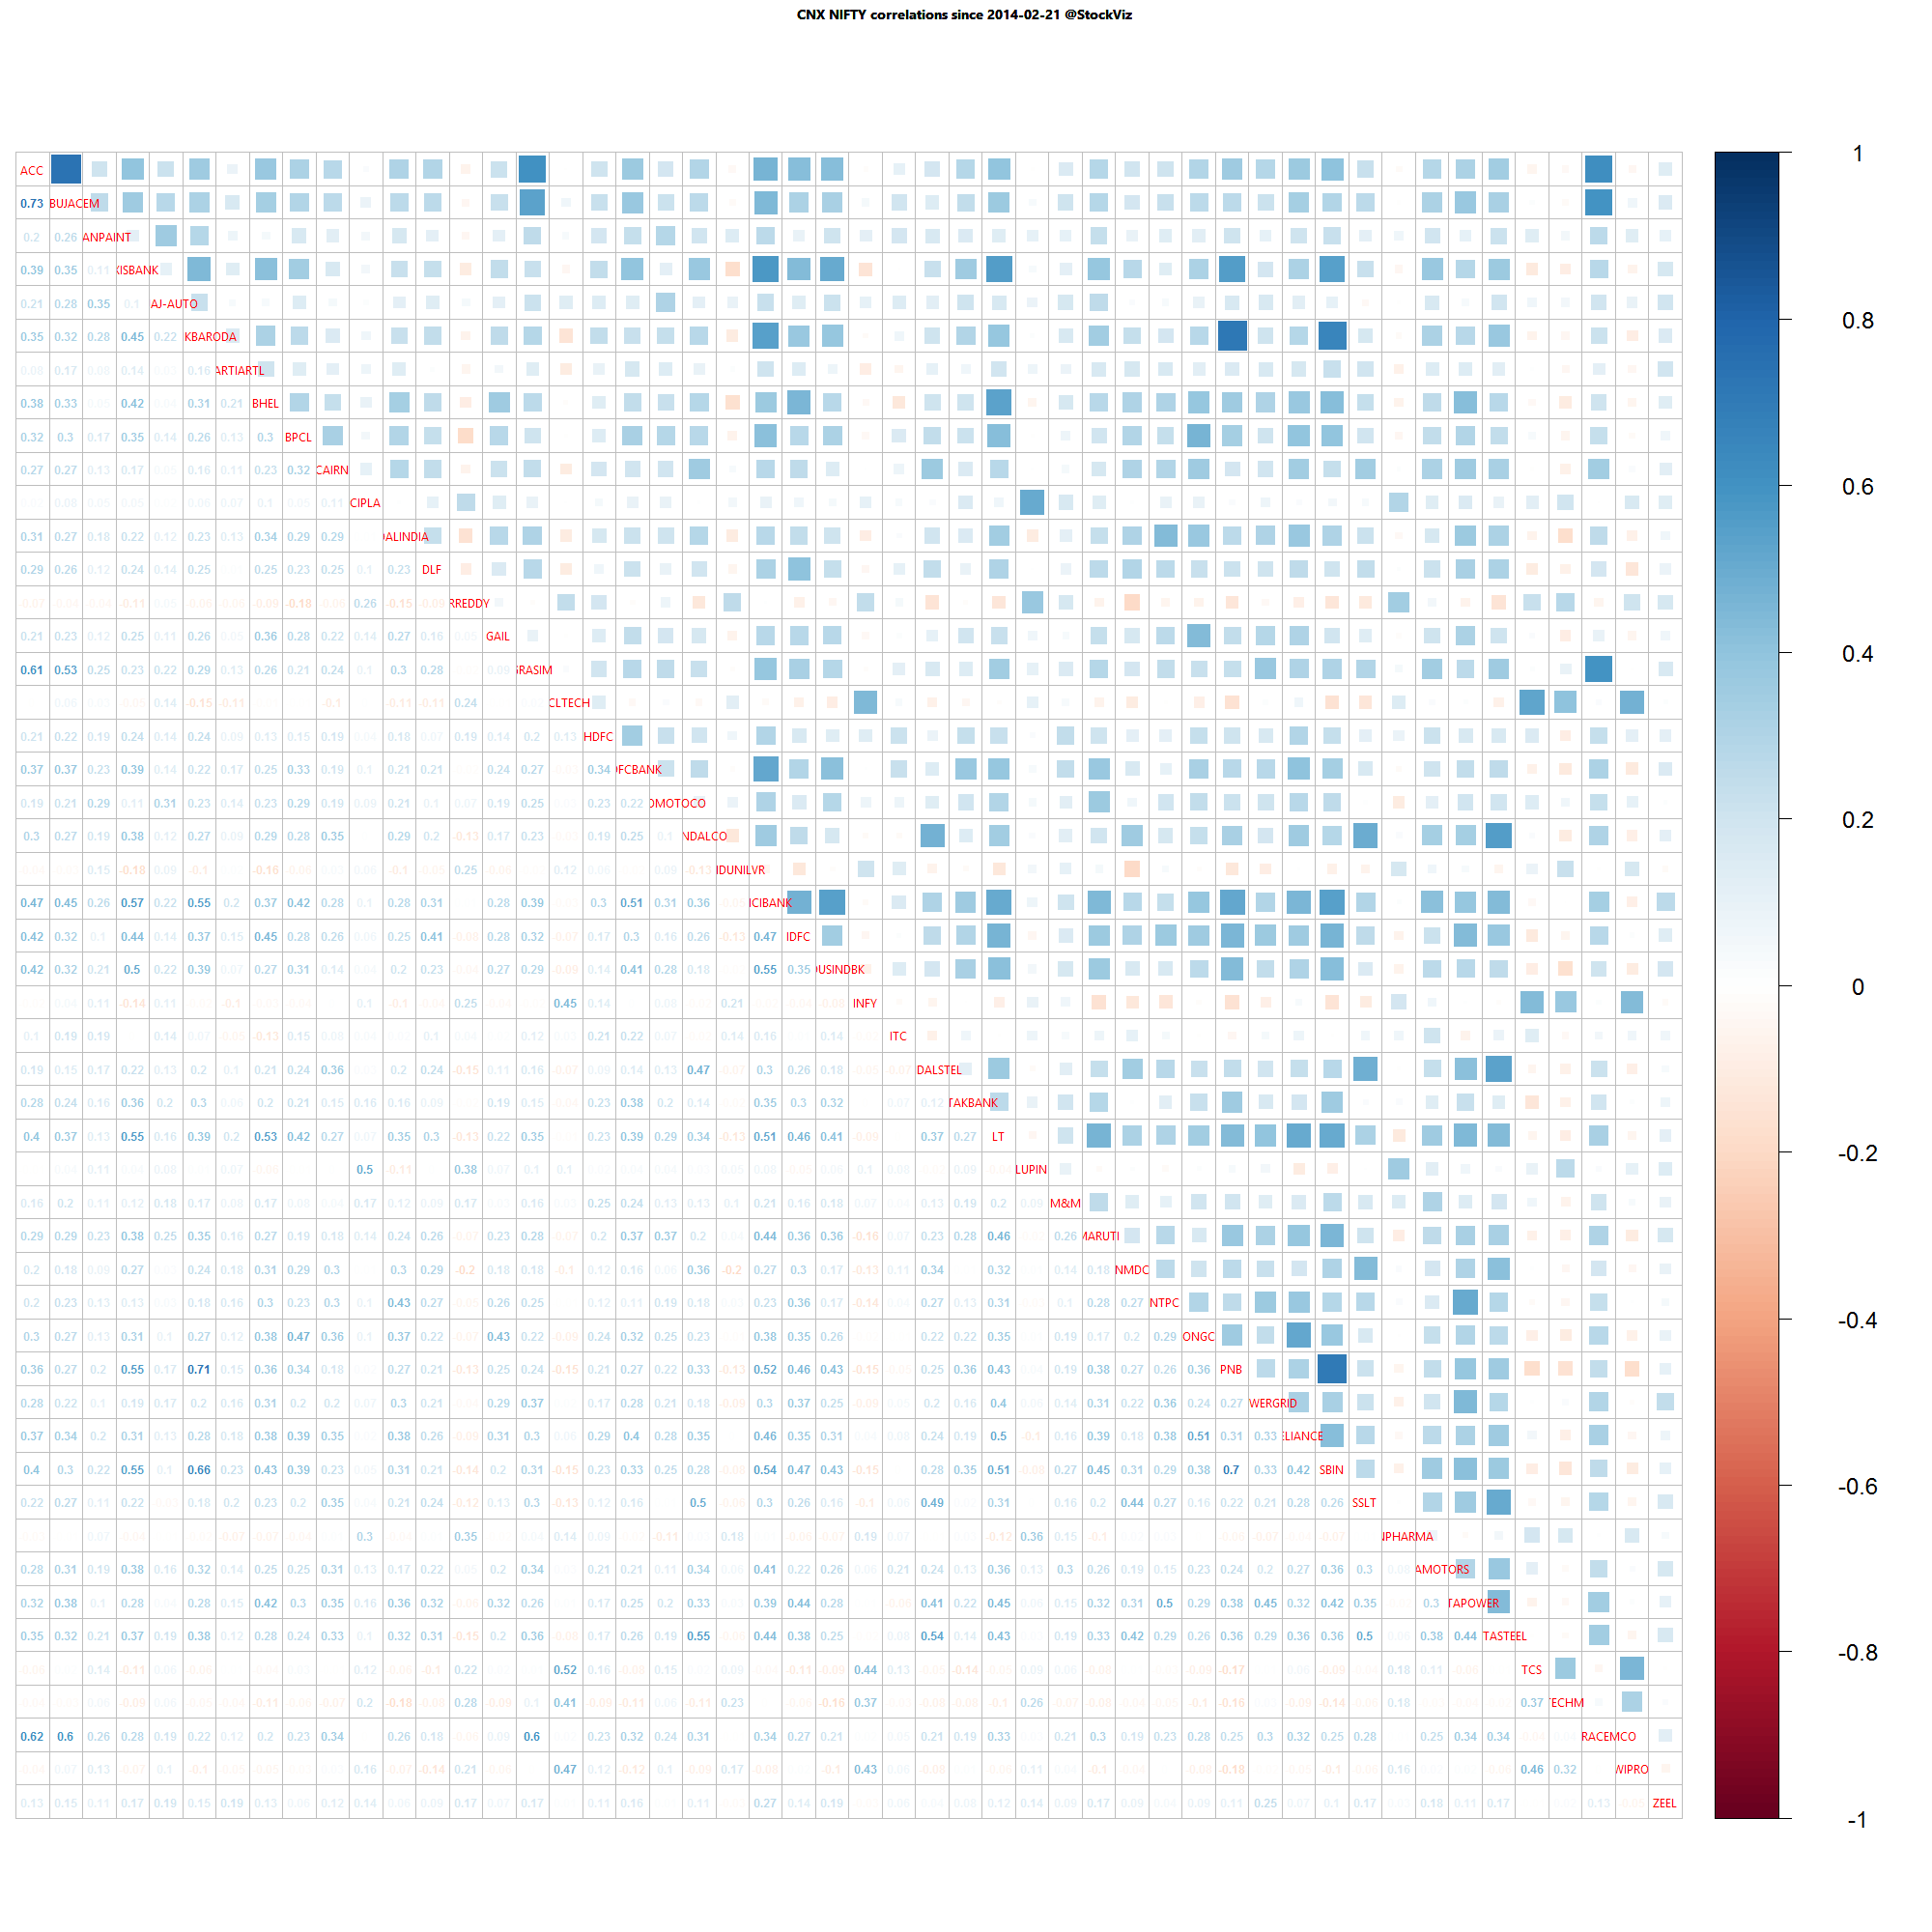
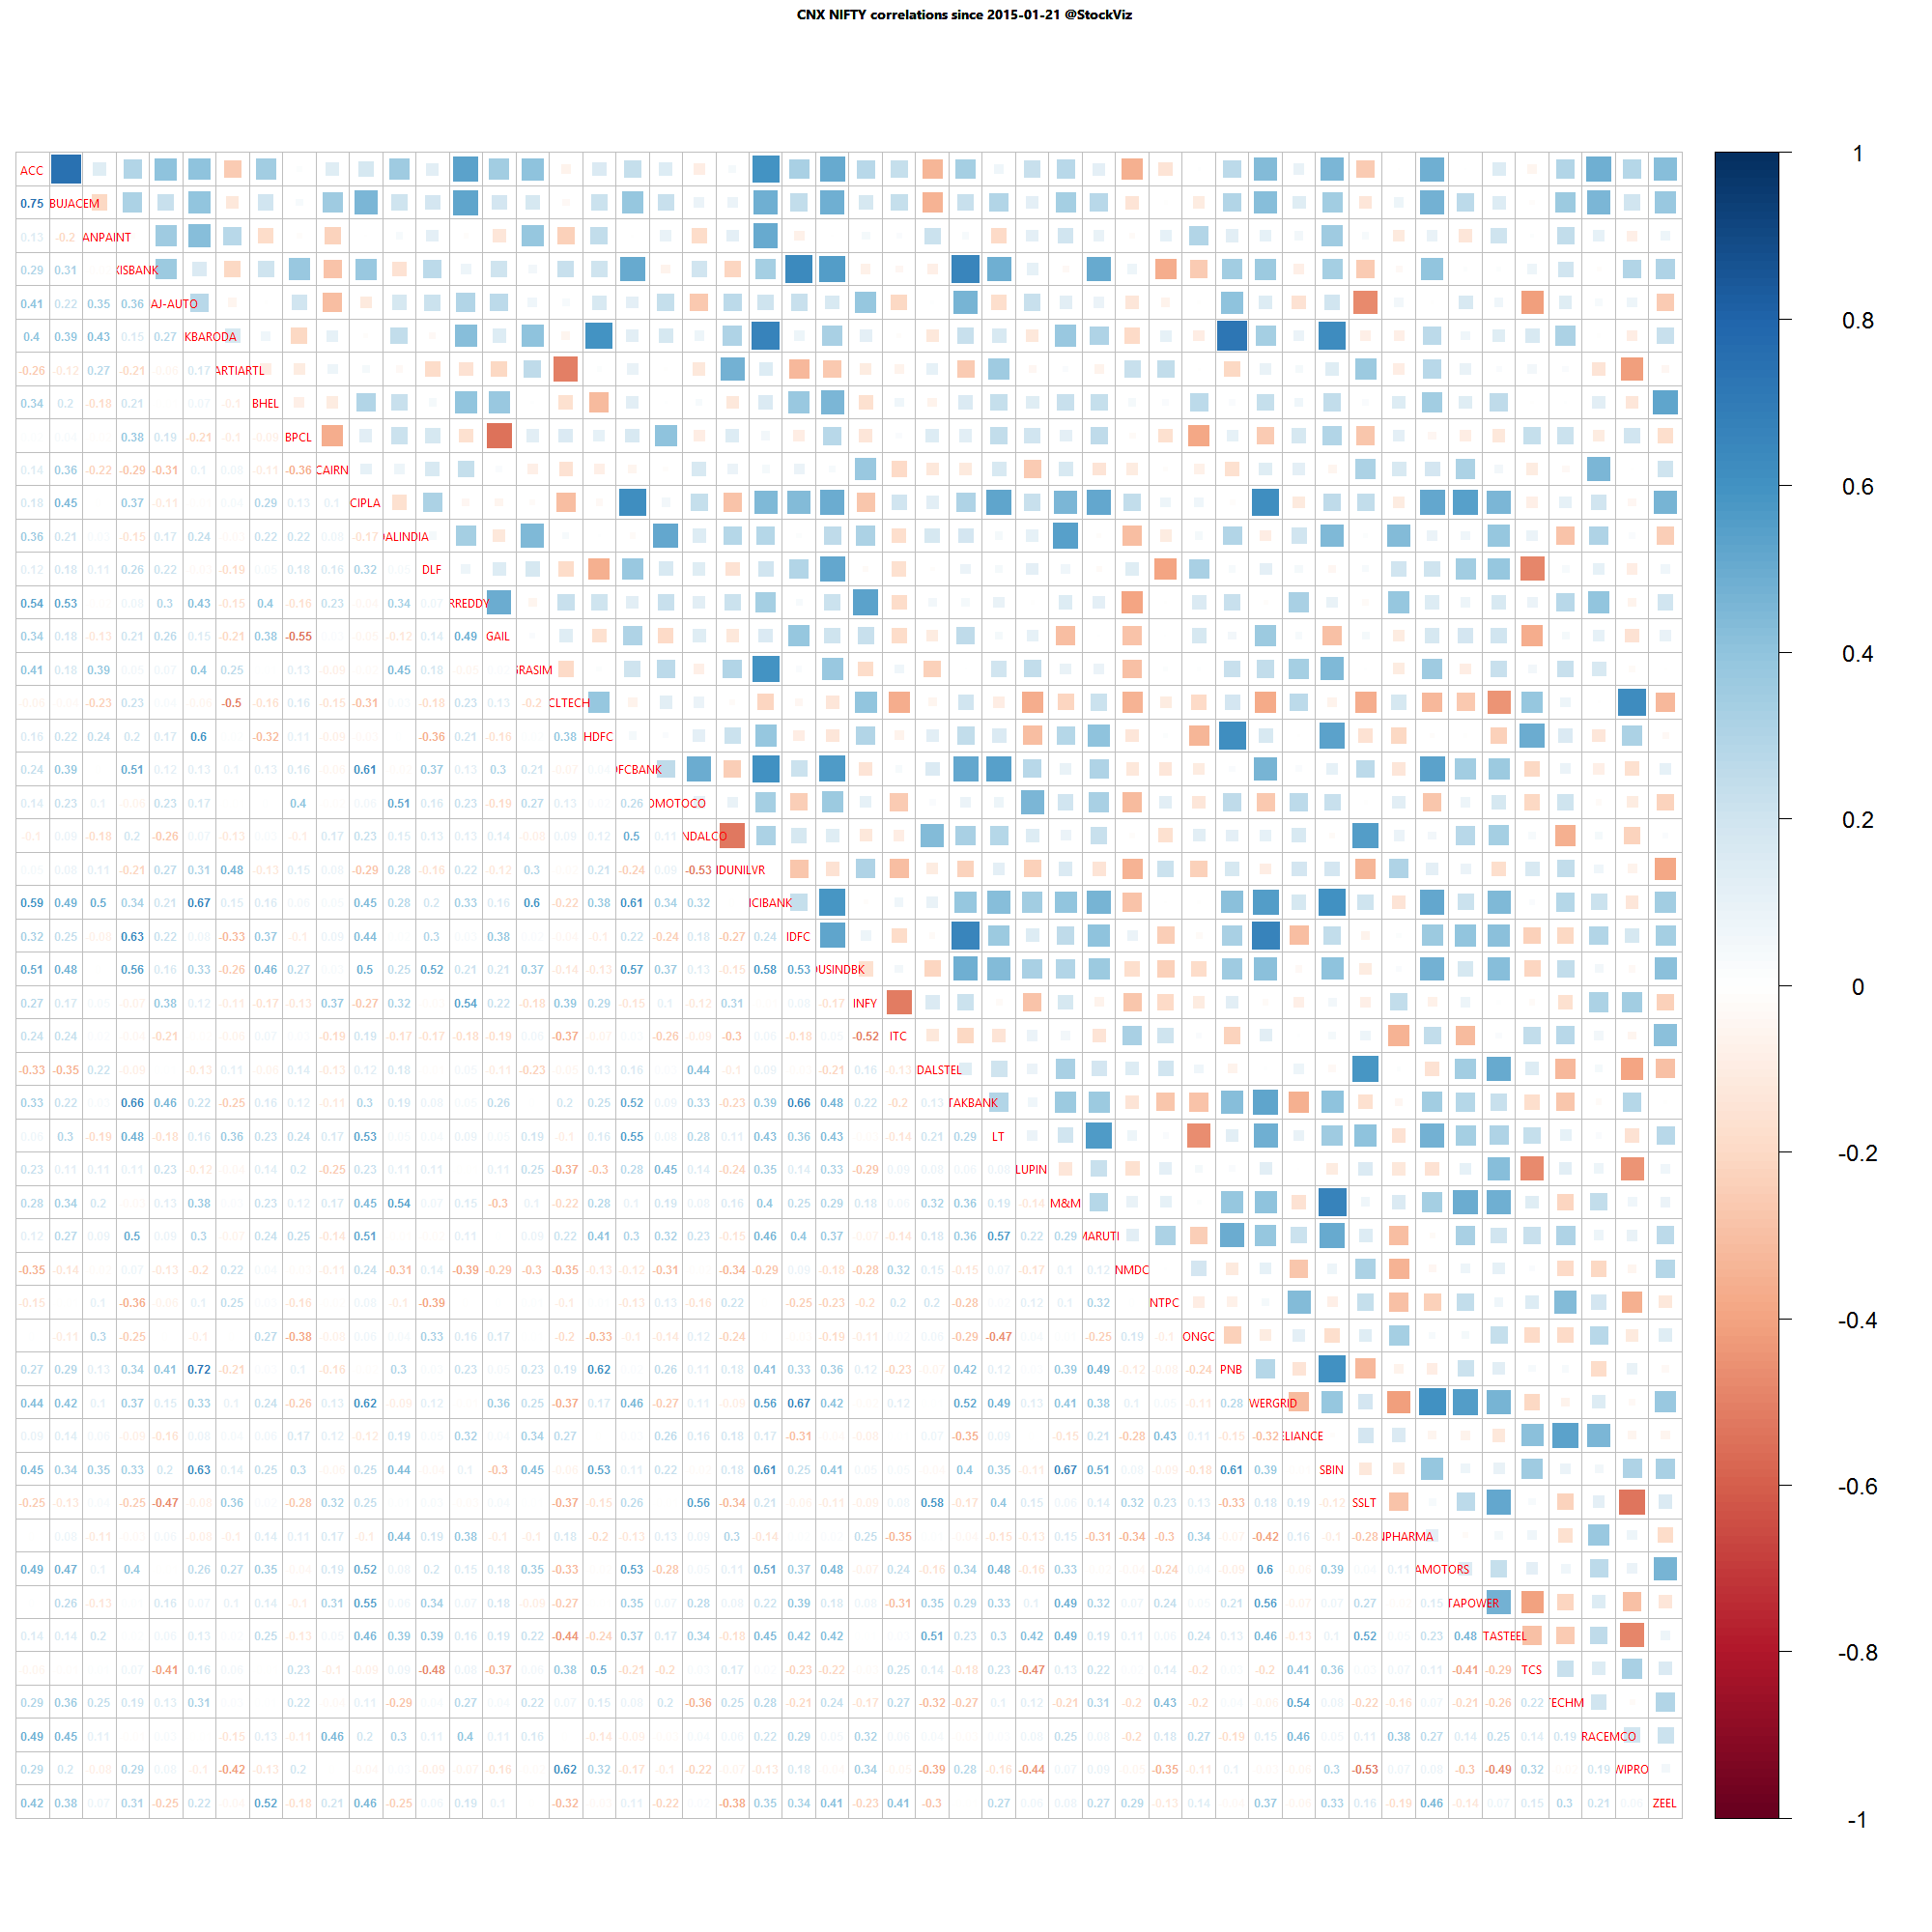
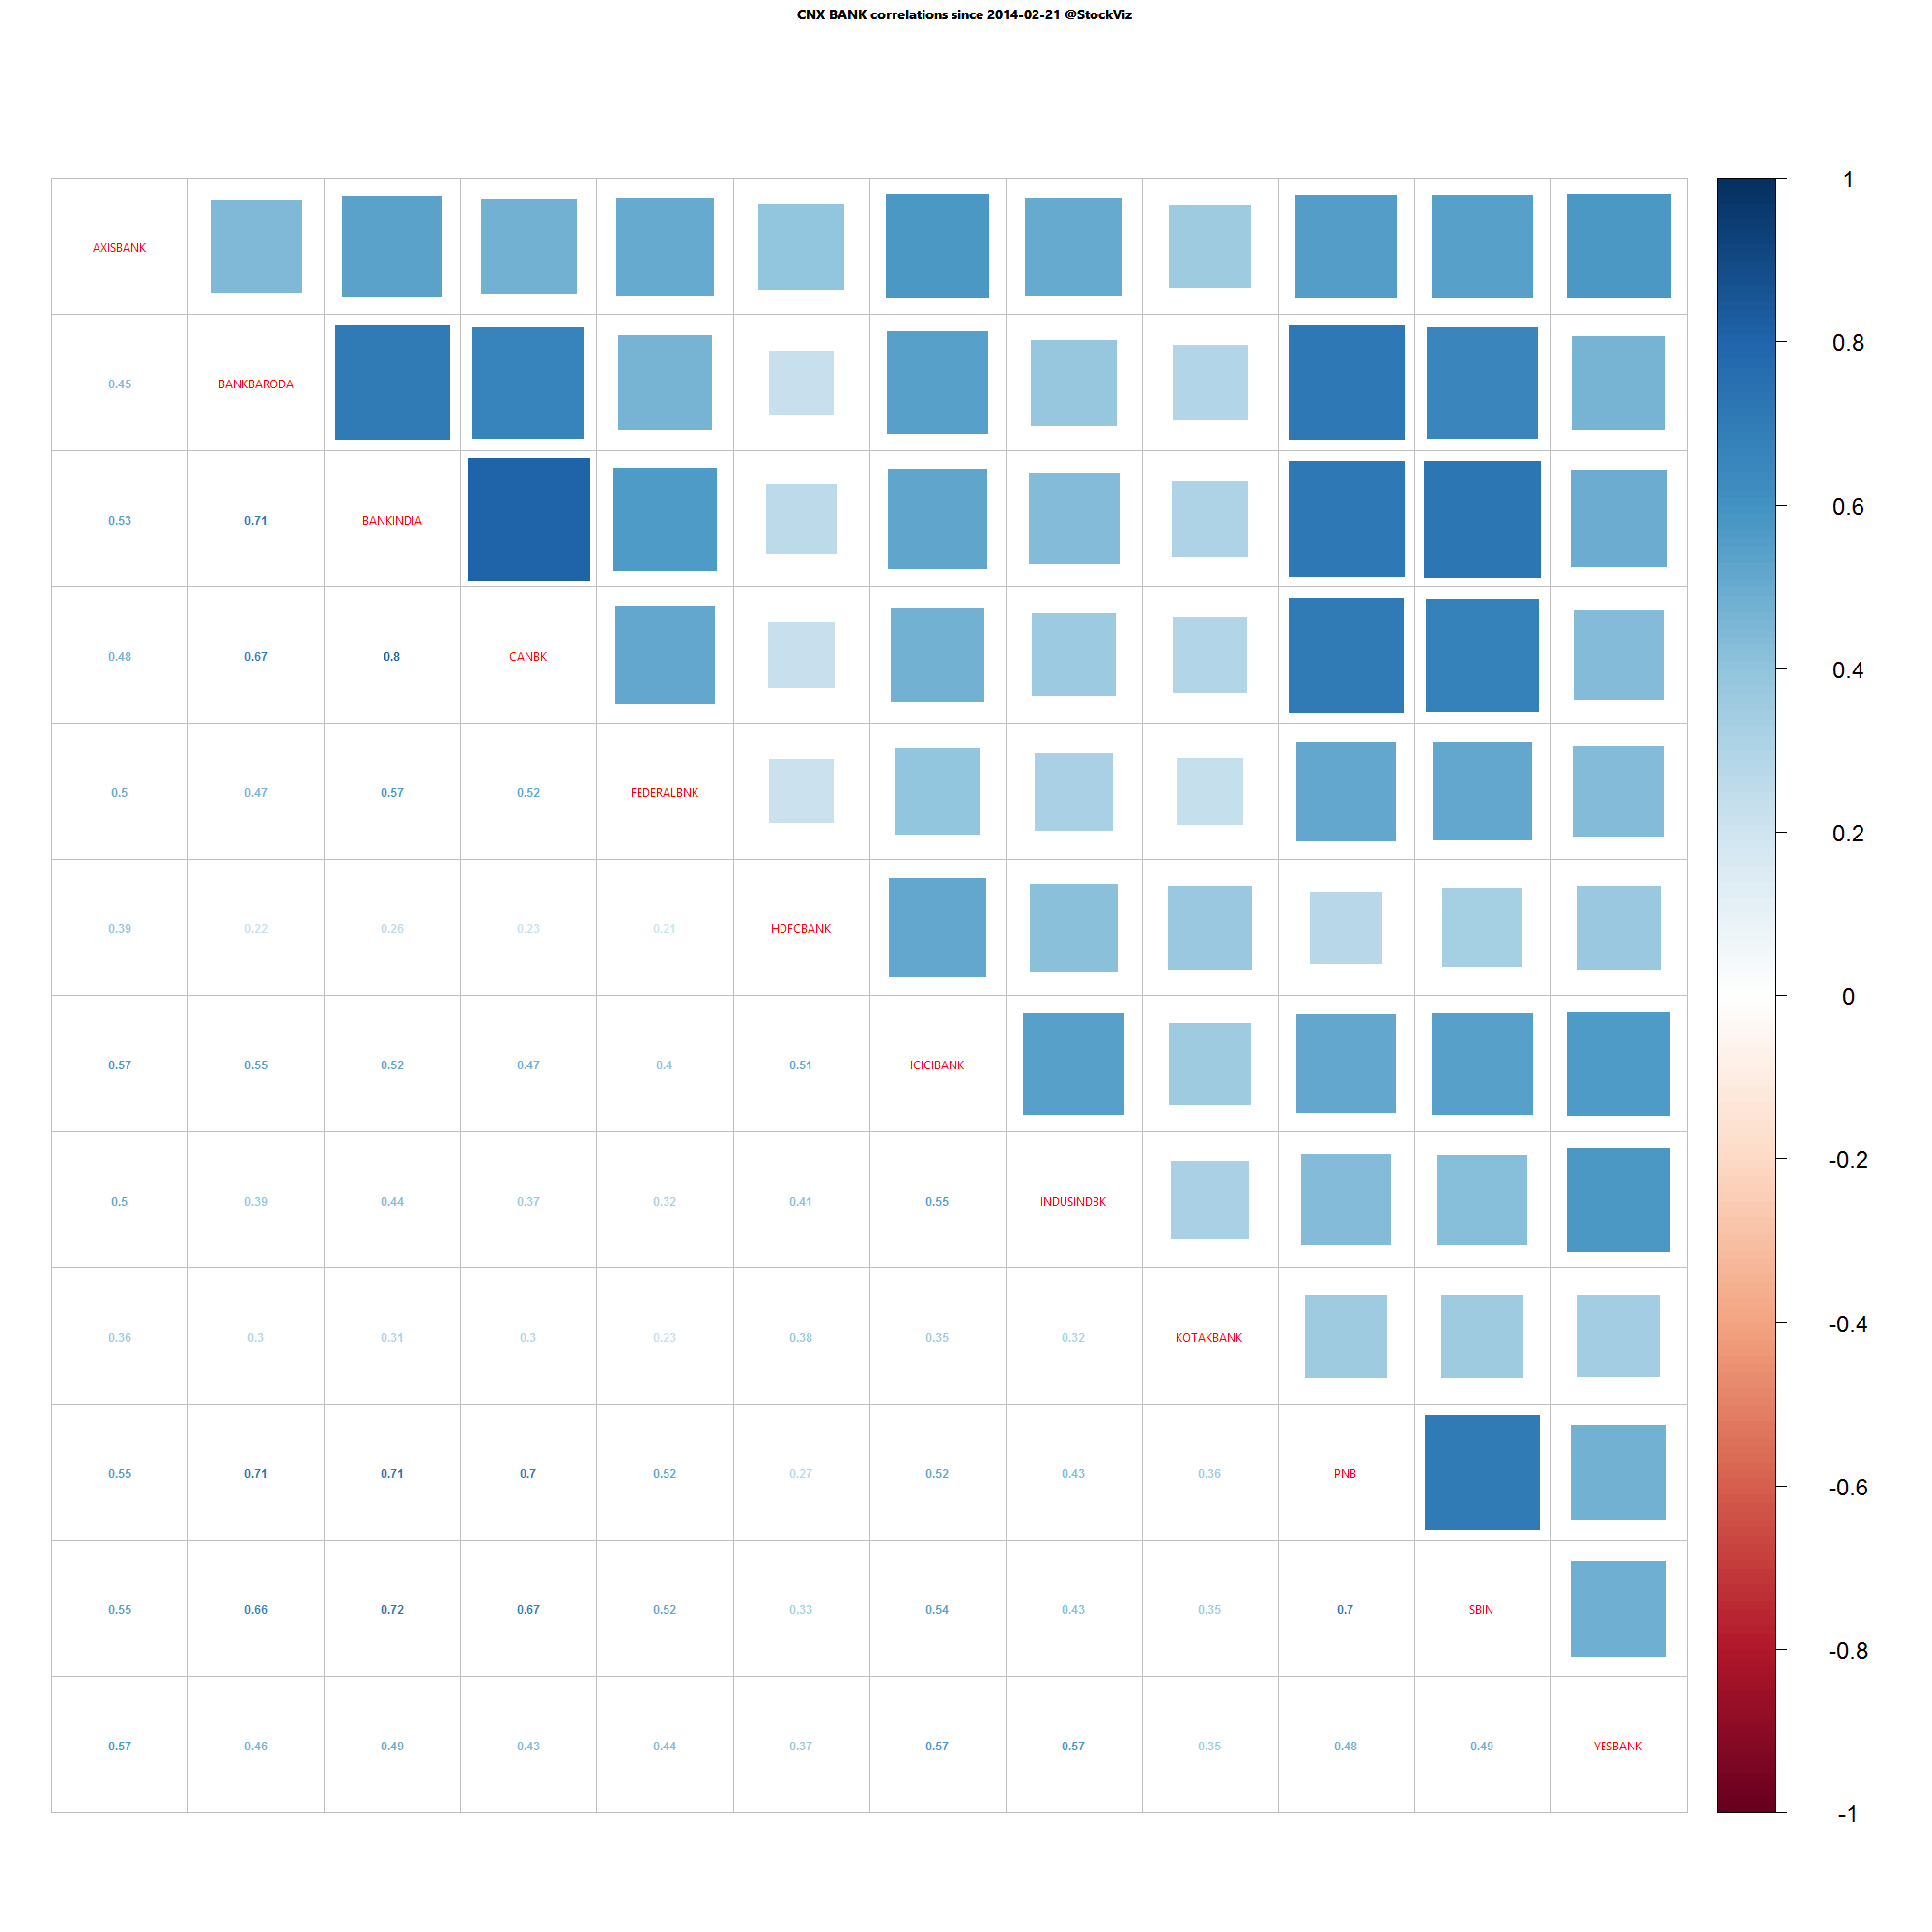
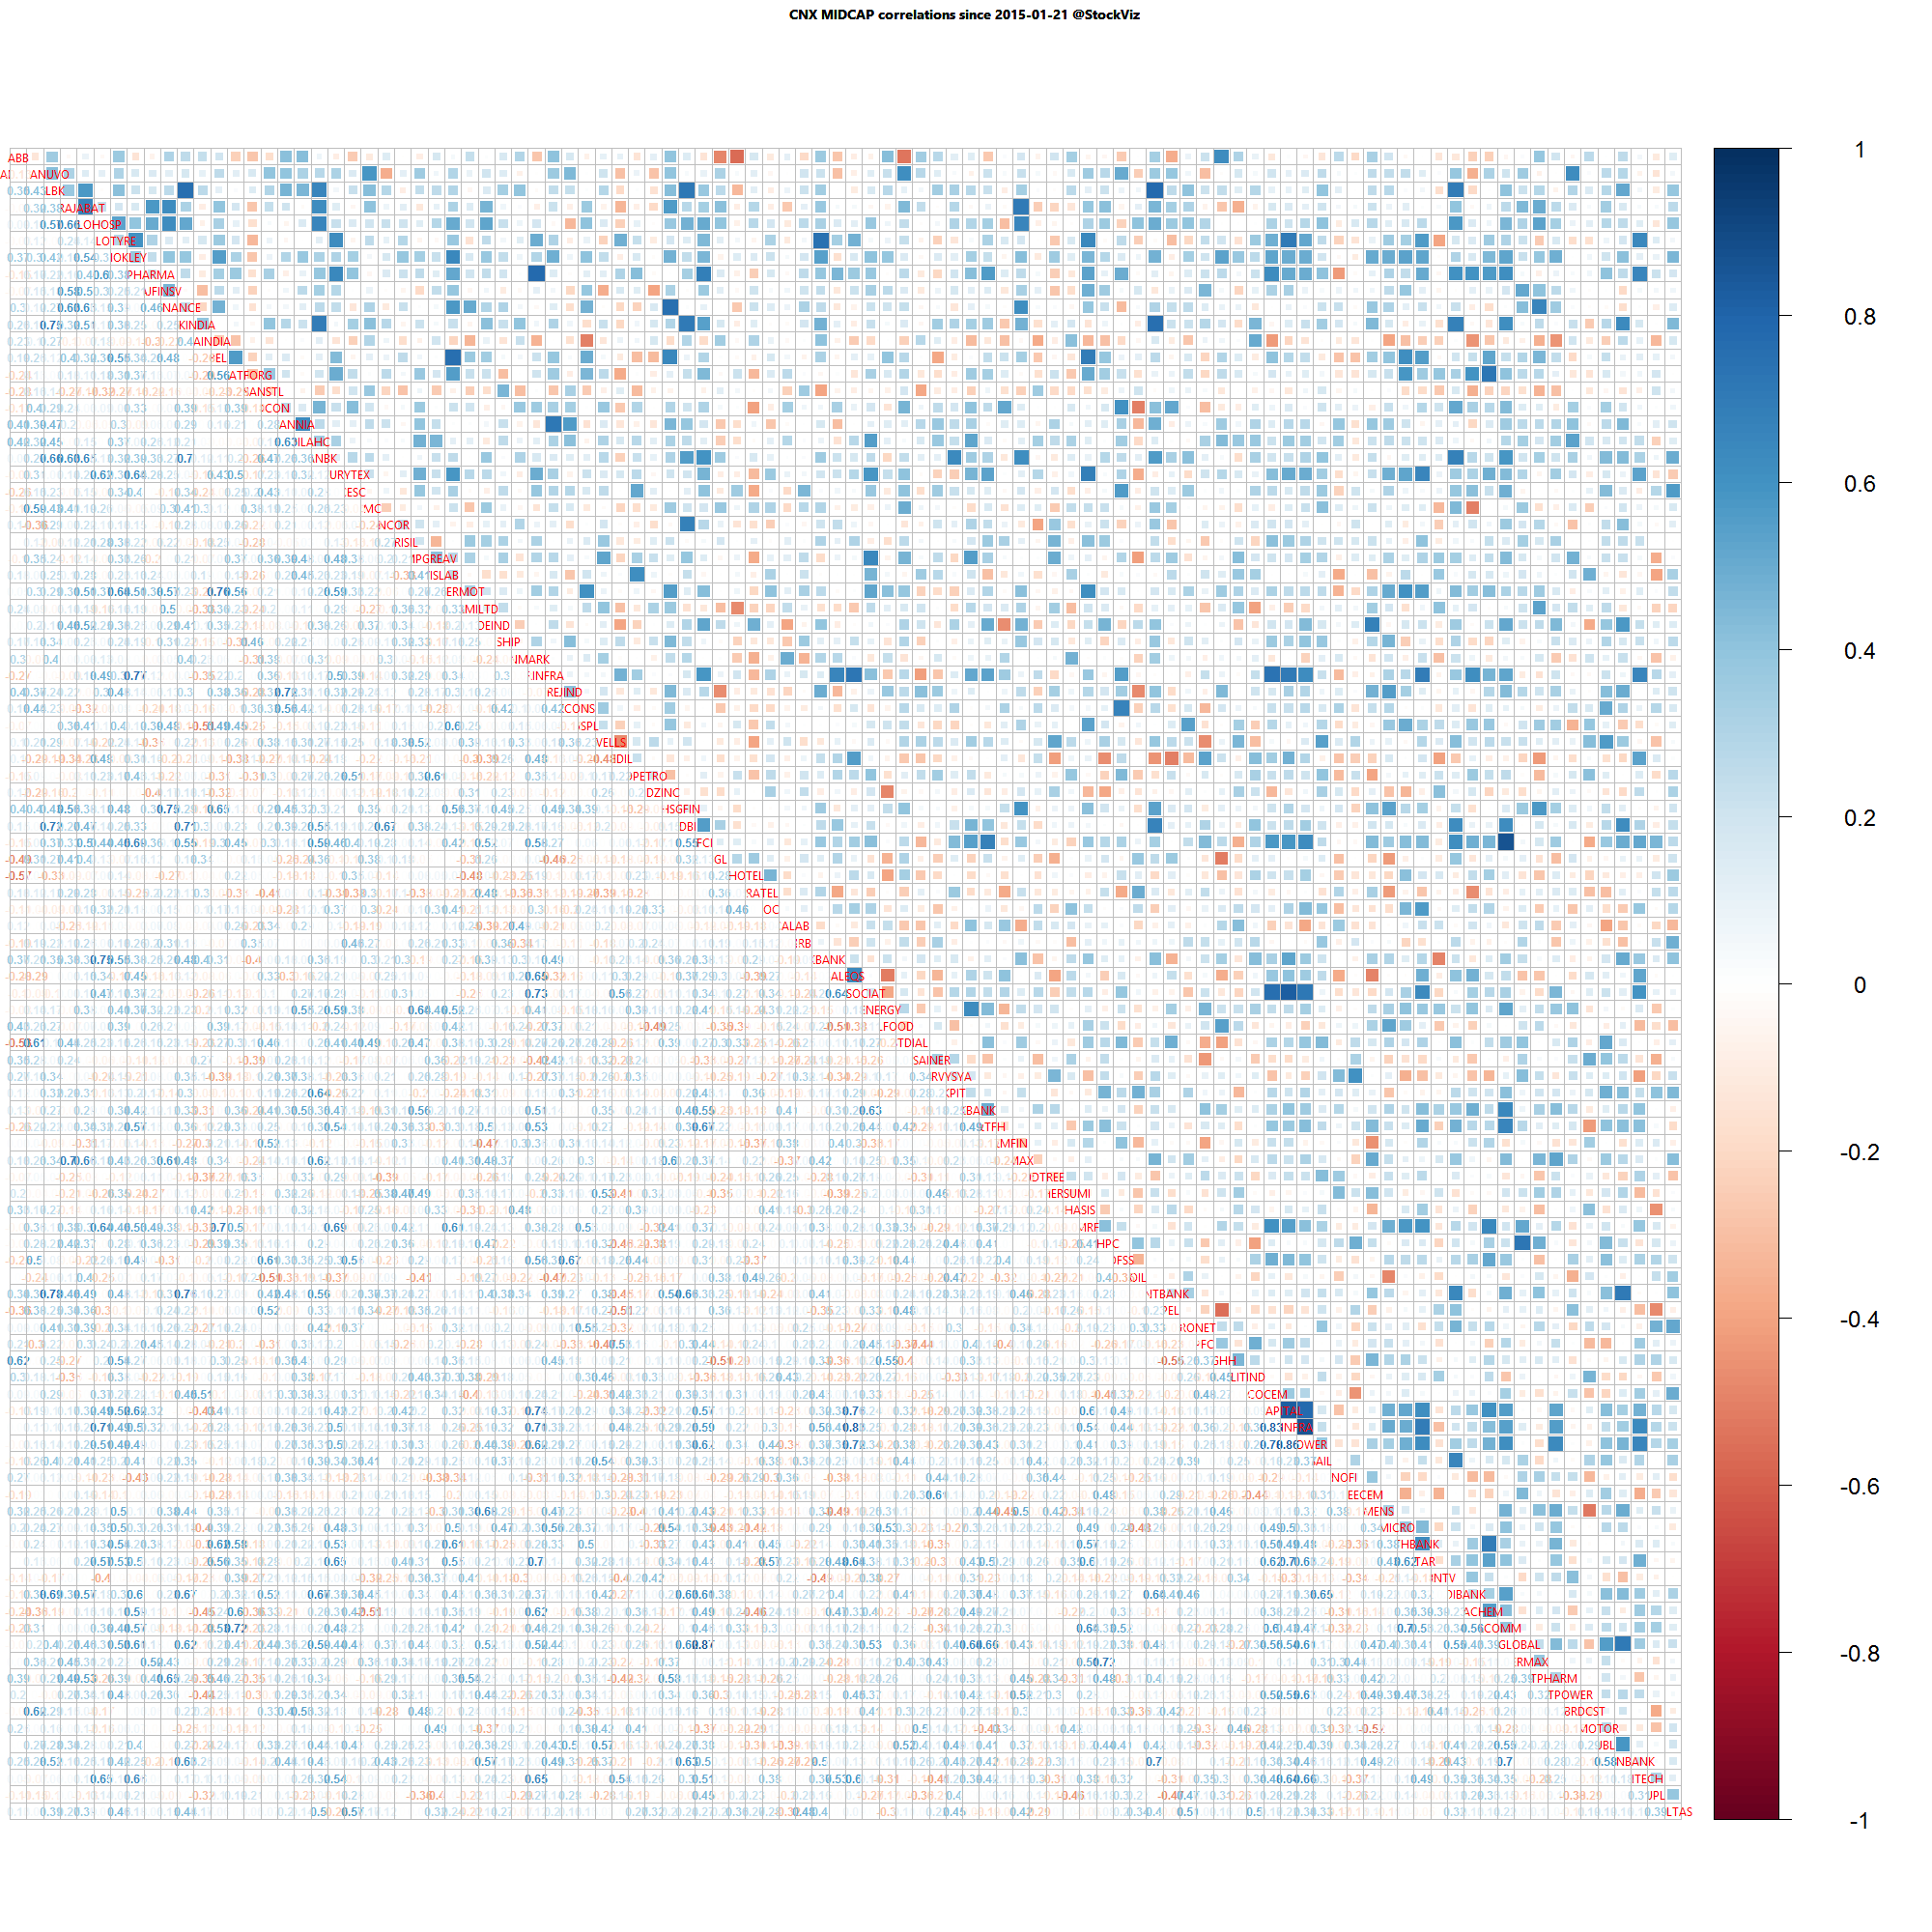
Correlation Update 01.03.2015

Nifty one year daily return correlations

Nifty one year daily return correlations

Nifty one month daily return correlations

Nifty one month daily return correlations

Bank Nifty one year daily return correlations

Bank Nifty one year daily return correlations

Bank Nifty one month daily return correlations

Bank Nifty one month daily return correlations

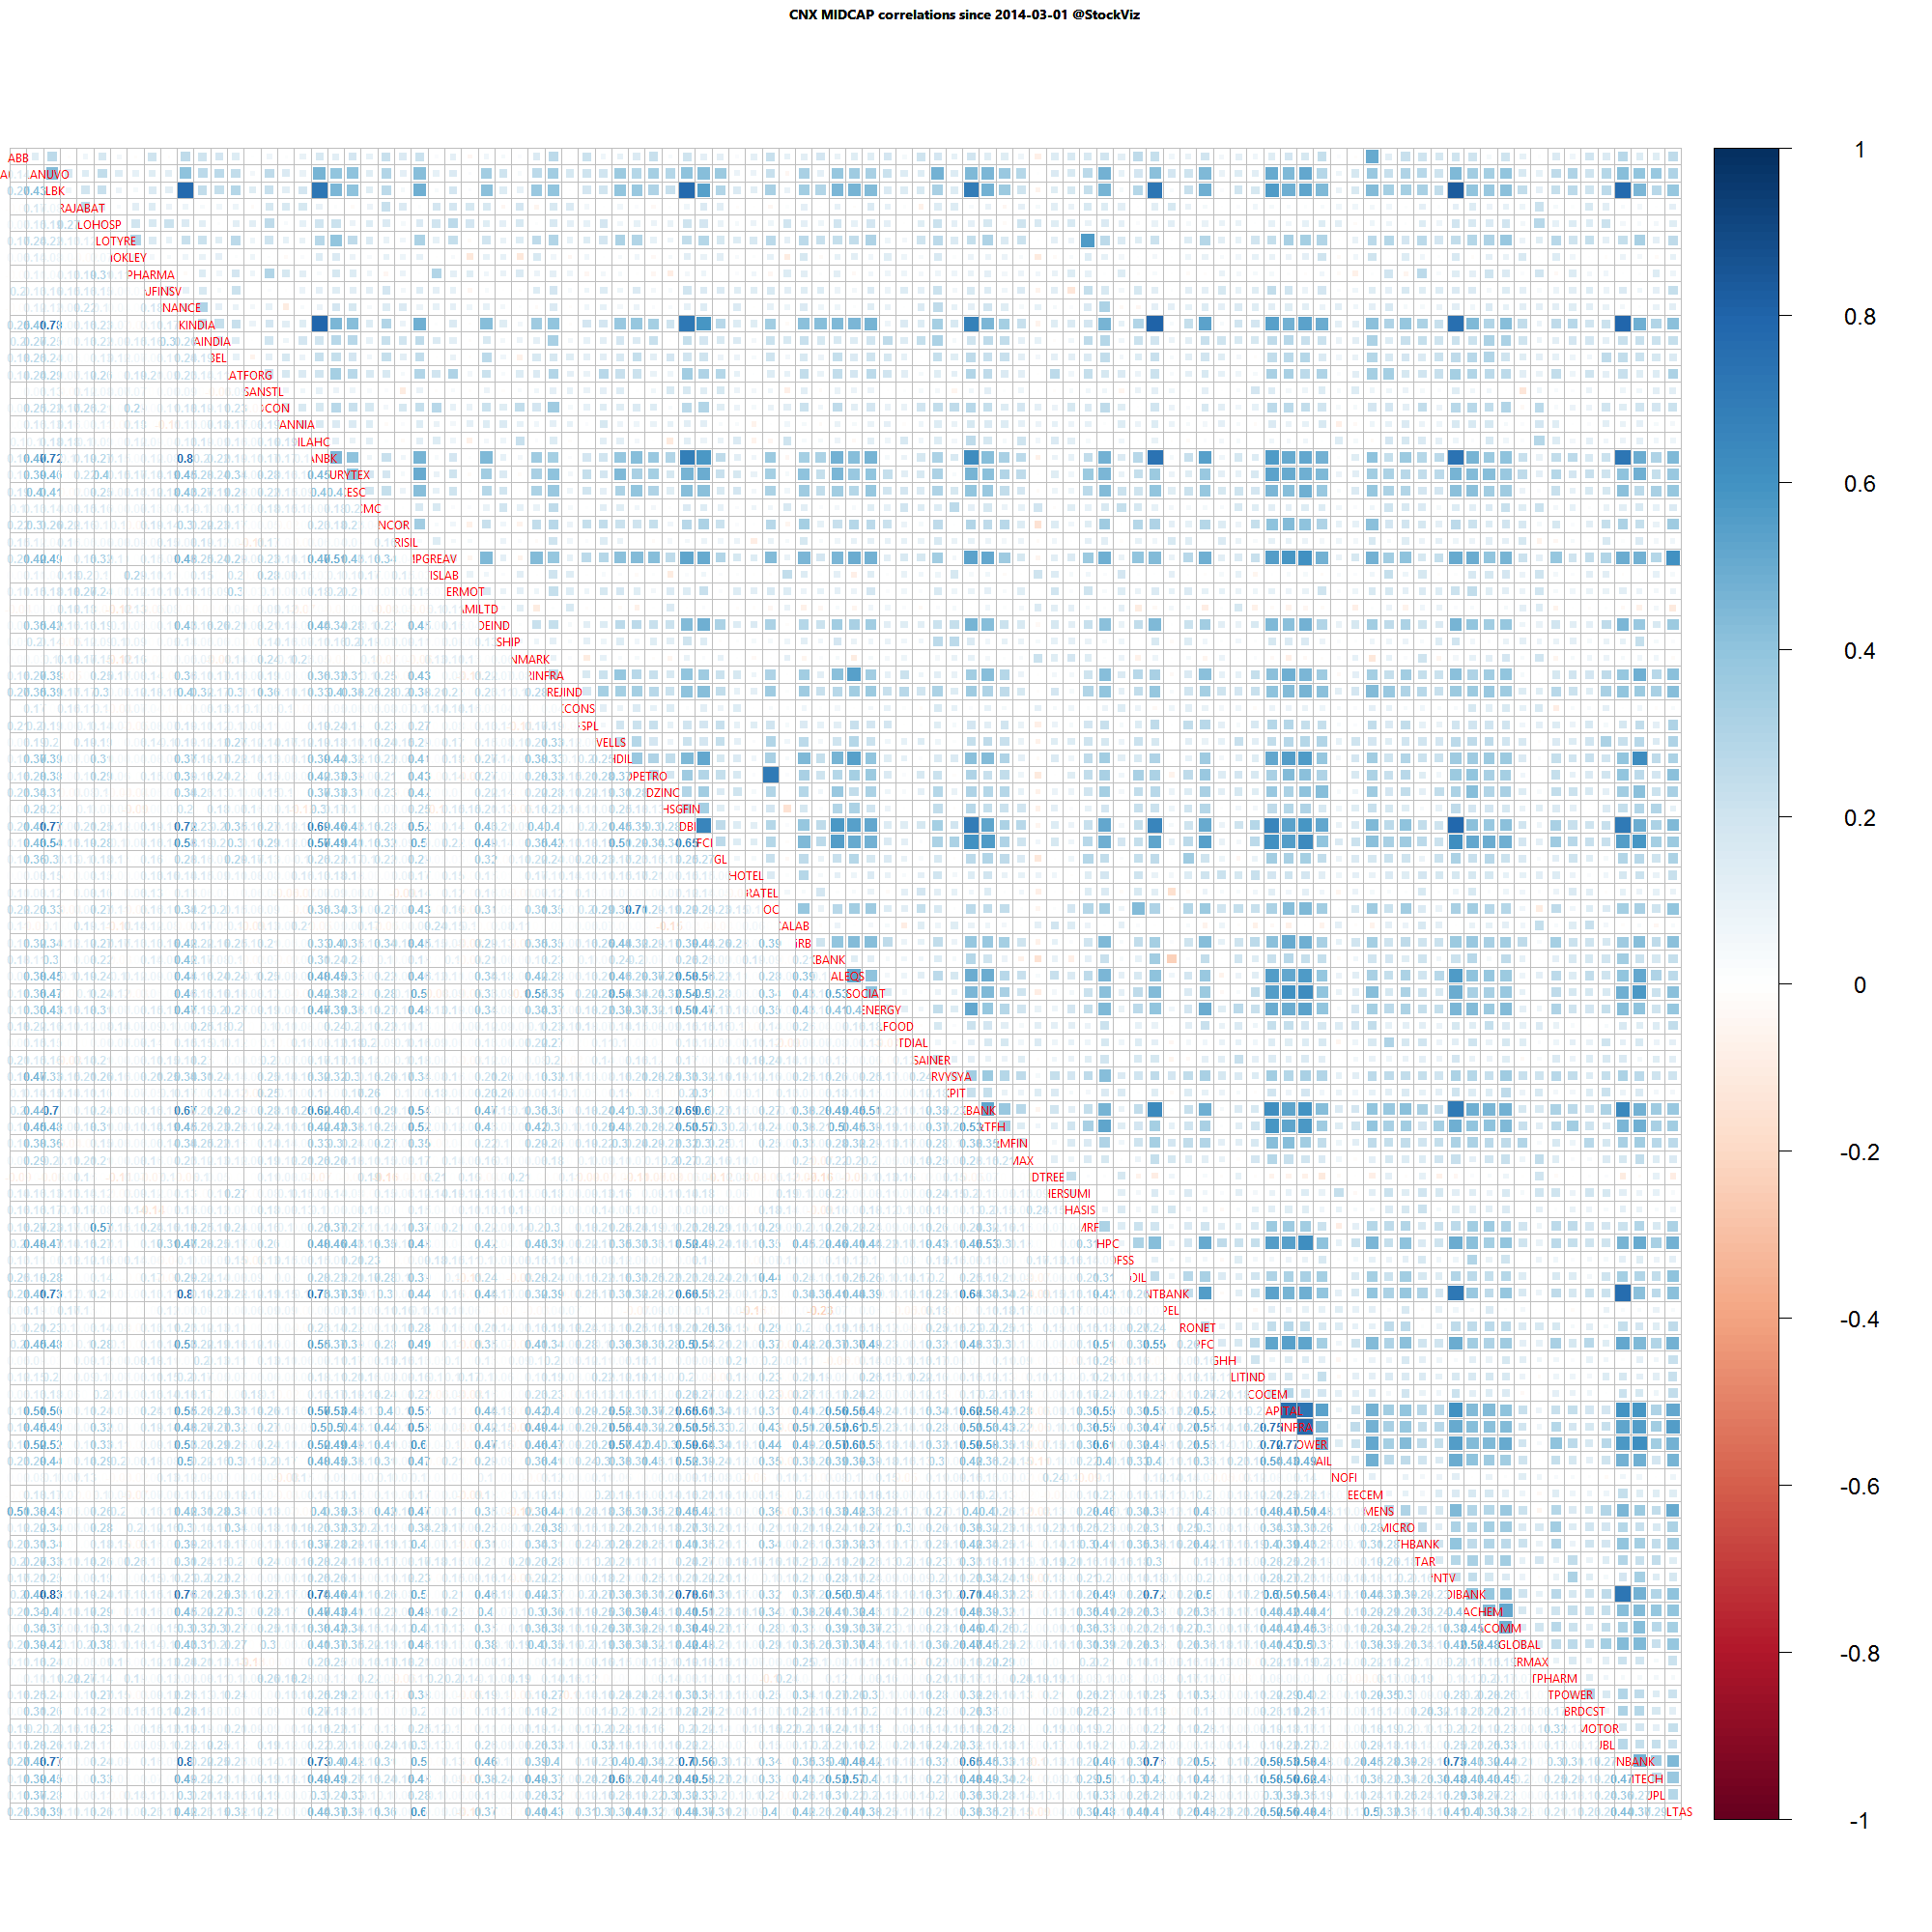
Midcap one year daily return correlations

Midcap one year daily return correlations

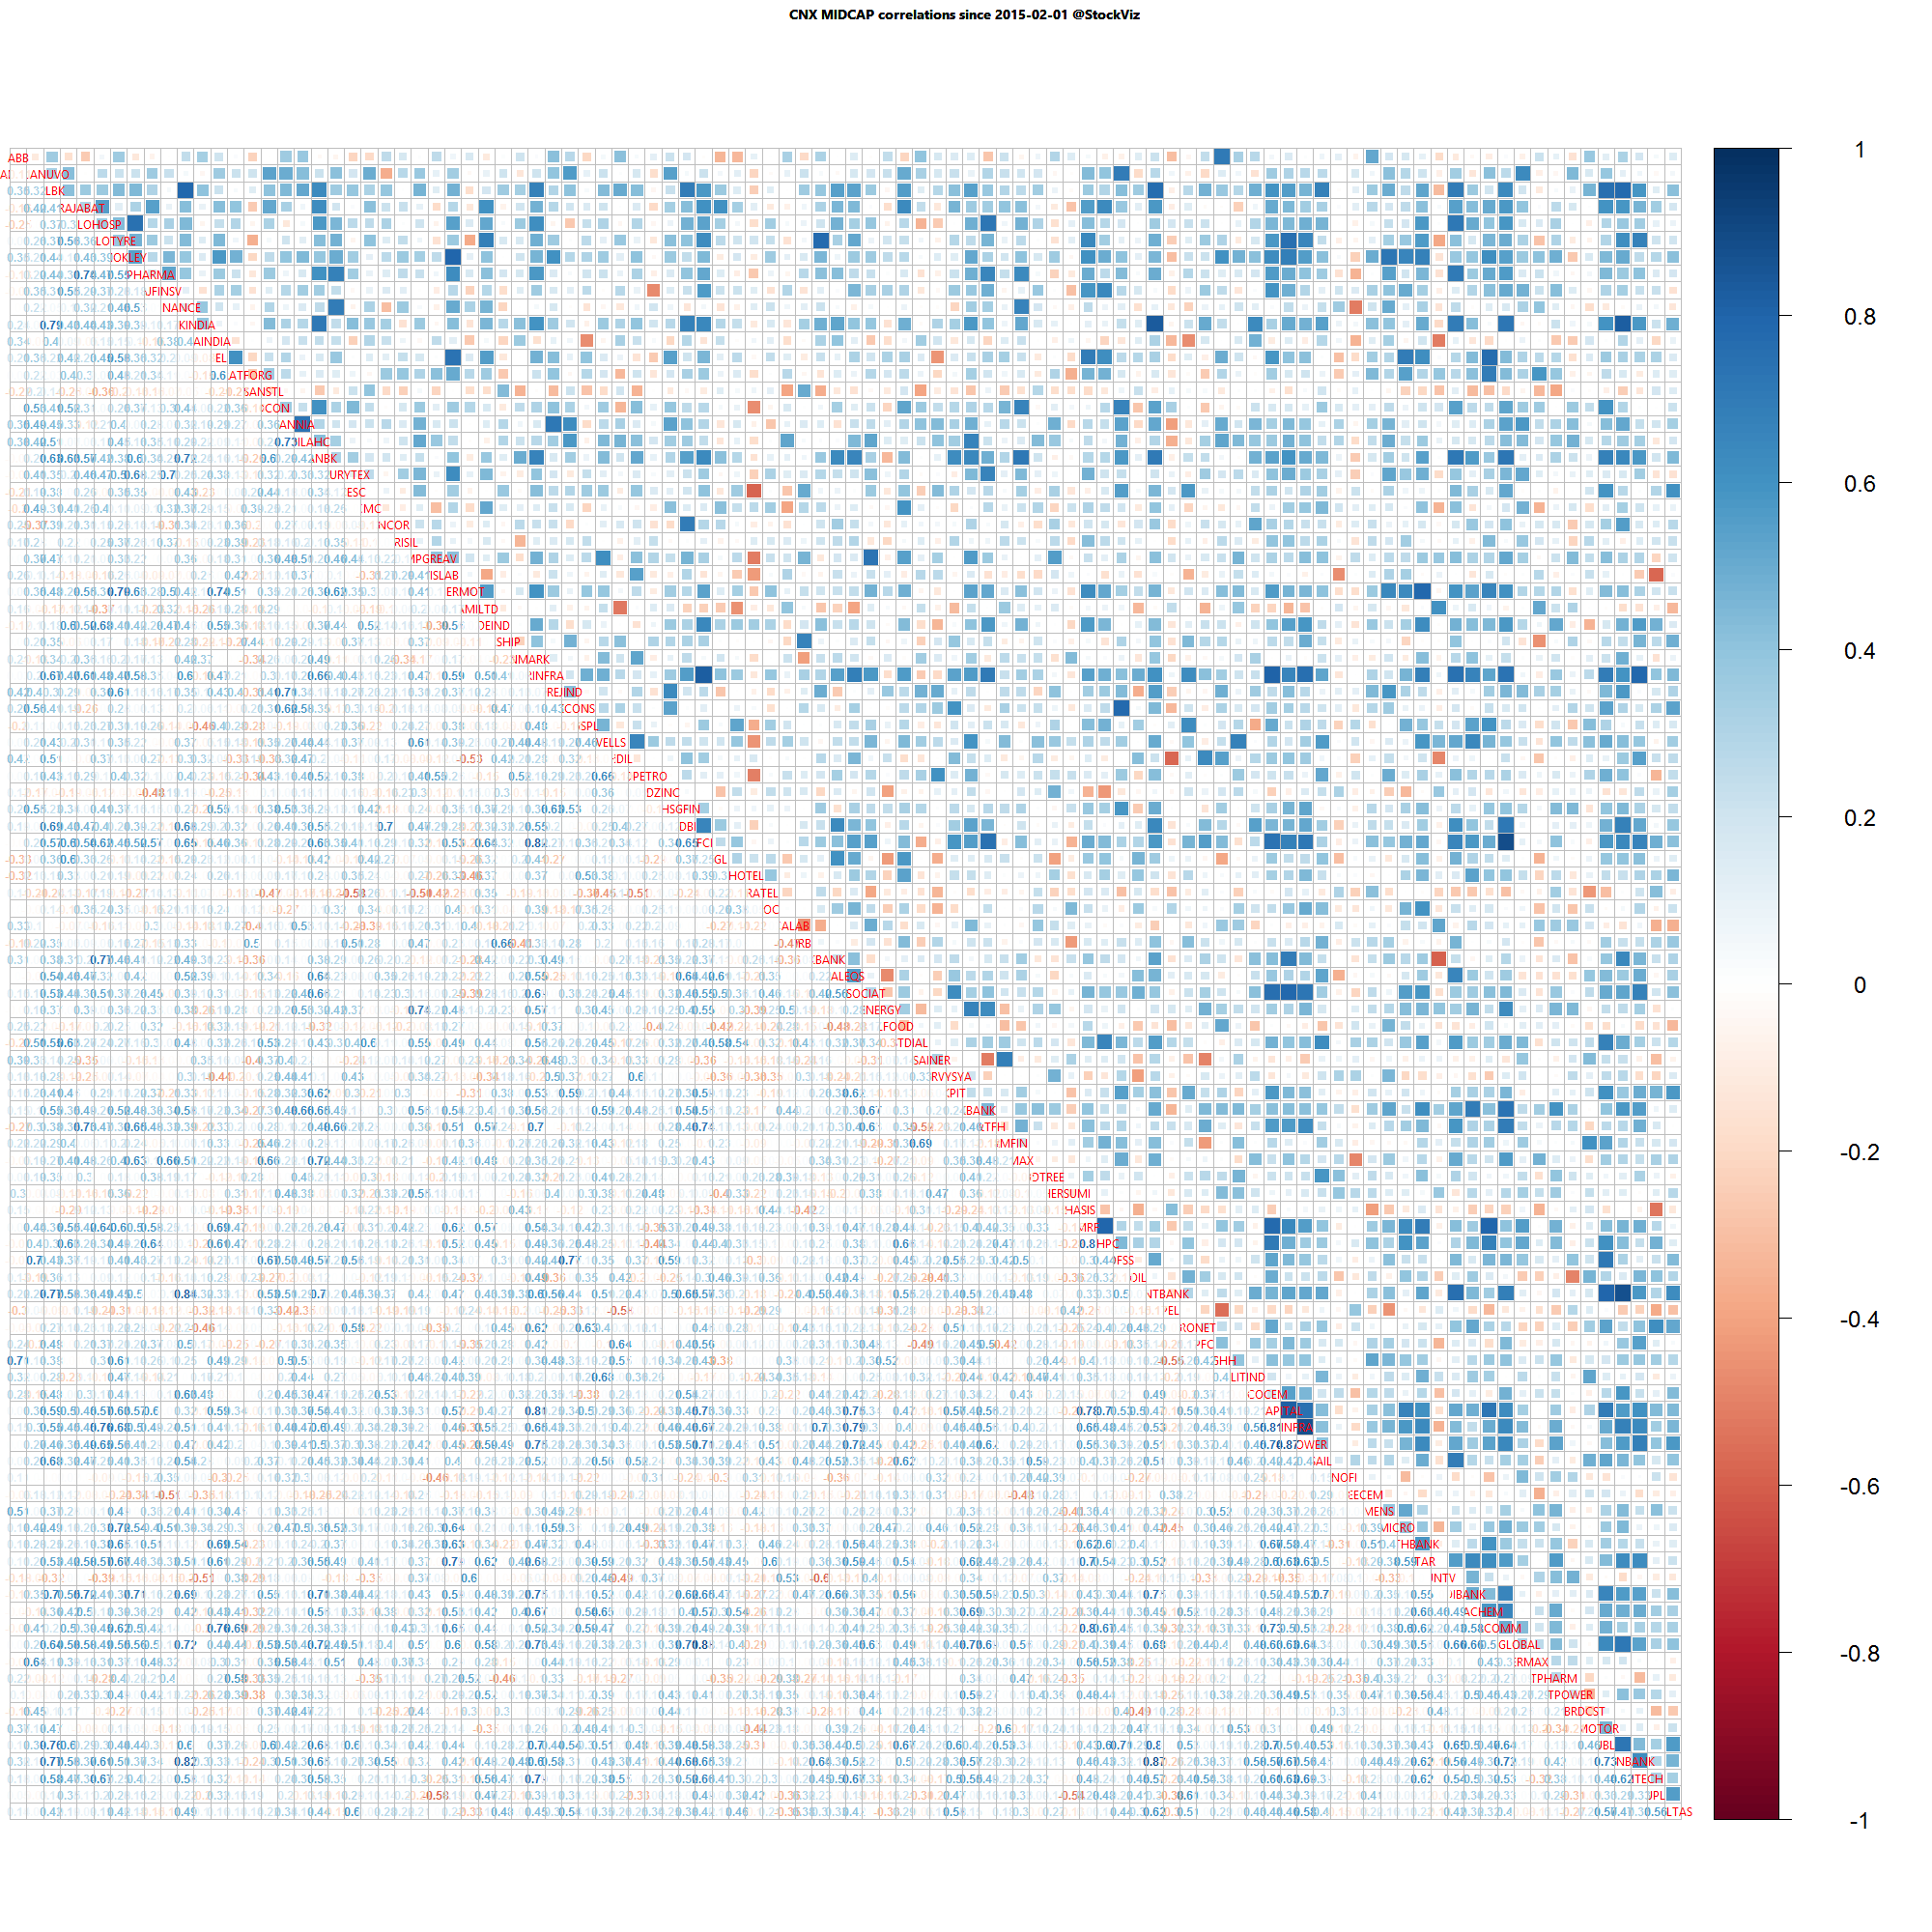
Midcap one month daily return correlations

Midcap one month daily return correlations

A lot of thick blue squares mean that positive correlations are high. Red squares mean negative correlations are high. Whites are the doldrums.

Weekly Recap: Why are all the good guys taken?

world.2015-02-13.2015-02-20

Equities

Major
DAX(DEU) +0.80%
CAC(FRA) +1.50%
UKX(GBR) +0.61%
NKY(JPN) +2.34%
SPX(USA) +0.88%
MINTs
JCI(IDN) +0.48%
INMEX(MEX) +1.36%
NGSEINDX(NGA) +6.52%
XU030(TUR) -0.50%
BRICS
IBOV(BRA) +1.08%
SHCOMP(CHN) +1.34%
NIFTY(IND) +0.32%
INDEXCF(RUS) -2.47%
TOP40(ZAF) +0.30%

Commodities

Energy
Brent Crude Oil -1.67%
RBOB Gasoline +1.77%
WTI Crude Oil -3.96%
Heating Oil +8.30%
Natural Gas +5.42%
Ethanol +0.28%
Metals
Palladium -1.69%
Platinum -3.61%
Copper +0.00%
Gold 100oz -2.36%
Silver 5000oz -3.53%

Currencies

USDEUR:+0.14% USDJPY:+0.27%

MINTs
USDIDR(IDN) +0.21%
USDMXN(MEX) +0.90%
USDNGN(NGA) -1.94%
USDTRY(TUR) -0.32%
BRICS
USDBRL(BRA) +1.21%
USDCNY(CHN) +0.25%
USDINR(IND) +0.04%
USDRUB(RUS) -2.38%
USDZAR(ZAF) +0.05%
Agricultural
Cattle -2.49%
Cocoa +1.04%
Cotton +2.94%
Lean Hogs +8.86%
Soybean Meal +4.14%
Soybeans +0.83%
Sugar #11 -3.09%
Wheat -4.05%
White Sugar -0.47%
Coffee (Arabica) -9.31%
Feeder Cattle -2.69%
Lumber -2.84%
Corn -0.13%
Orange Juice -4.07%
Coffee (Robusta) -3.28%

Credit Indices

Index Change
Markit CDX EM +0.20%
Markit CDX NA HY -0.06%
Markit CDX NA IG -1.35%
Markit iTraxx Asia ex-Japan IG -4.89%
Markit iTraxx Australia -4.29%
Markit iTraxx Europe -3.72%
Markit iTraxx Europe Crossover -12.07%
Markit iTraxx Japan -1.86%
Markit iTraxx SovX Western Europe +0.22%
Markit LCDX (Loan CDS) +0.00%
Markit MCDX (Municipal CDS) +1.66%
Most equity markets ended this week on a positive note. The precious metals complex, however, were gasping for breath. The US Dollar rally remained somewhat intact. Credit spreads mostly tighter…

Nifty Heatmap

CNX NIFTY.2015-02-13.2015-02-20

Index Returns

index performance.2015-02-13.2015-02-20

Sector Performance

sector performance.2015-02-13.2015-02-20

Advance Decline

advance.decline.line2.2015-02-13.2015-02-20

Market Cap Decile Performance

Decile Mkt. Cap. Adv/Decl
1 (micro) -0.96% 71/62
2 +0.48% 62/71
3 +5.52% 72/61
4 +3.51% 75/58
5 +2.91% 69/64
6 +2.53% 69/64
7 +2.77% 69/64
8 +2.84% 70/63
9 +3.18% 68/65
10 (mega) +2.73% 66/67
Midcaps outperformed the large-caps.

Top Winners and Losers

BHARATFORG +7.76%
CONCOR +11.59%
JINDALSTEL +27.59%
HEROMOTOCO -6.80%
GODREJCP -6.25%
PETRONET -5.68%
Bharatforge was up on defense and joint-venture announcements; Hero Motors’ promoters are dumping their own stock and the market is not taking it lying down…

ETF Performance

PSUBNKBEES +2.11%
CPSEETF +1.77%
INFRABEES +0.54%
JUNIORBEES +0.12%
NIFTYBEES -0.24%
GOLDBEES -1.10%
BANKBEES -2.12%
Private vs. Public sector banks: a delicate balance between the well and awfully managed; between efficiency and never-ending bailouts; profit-motive vs. political calculus; a cold-embrace where just when one tries to make a profit, the other can light tax-payer money on fire…

Yield Curve

yield Curve.2015-02-13.2015-02-20

Bond Indices

Sub Index Change in YTM Total Return(%)
GSEC TB -0.10 +0.18%
GSEC SUB 1-3 -0.21 +0.05%
GSEC SUB 3-8 -0.10 +0.37%
GSEC SUB 8 -0.04 -0.21%
Flat curve, flatter P&L

Investment Theme Performance

Equity Mutual Funds

Bond Mutual Funds

Thought for the weekend

Why are there lots of single “boring Bernards and psycho Suzies?”

Because good couples stay together for longer.
Even if there is a large share of good romantic partners, most single people are crazy.
Even if only 50% of the population is crazy, in equilibrium around 63% of single people are crazy.

Source: A Dynamic Theory of Romantic Choice

Correlation Update 21.02.2015

Nifty one year daily return correlations

Nifty one year daily return correlations

Nifty one month daily return correlations

Nifty one month daily return correlations

Bank Nifty one year daily return correlations

Bank Nifty one year daily return correlations

Bank Nifty one month daily return correlations

Bank Nifty one month daily return correlations

Midcap one year daily return correlations

Midcap one year daily return correlations

Midcap one month daily return correlations

Midcap one month daily return correlations

A lot of thick blue squares mean that positive correlations are high. Red squares mean negative correlations are high. Whites are the doldrums.

Weekly Recap: The Arc of Company Life

world.2015-2-6.2015-2-13

Equities

Major
DAX(DEU) +1.08%
CAC(FRA) +1.46%
UKX(GBR) +0.29%
NKY(JPN) +1.50%
SPX(USA) +1.59%
MINTs
JCI(IDN) +0.59%
INMEX(MEX) +0.73%
NGSEINDX(NGA) -8.00%
XU030(TUR) +1.01%
BRICS
IBOV(BRA) +4.47%
SHCOMP(CHN) +4.16%
NIFTY(IND) +1.67%
INDEXCF(RUS) +4.71%
TOP40(ZAF) +2.18%

Commodities

Energy
Heating Oil +6.49%
Brent Crude Oil +5.51%
RBOB Gasoline +3.90%
WTI Crude Oil +0.82%
Ethanol +0.91%
Natural Gas +8.33%
Metals
Copper +0.38%
Gold 100oz -0.19%
Palladium +1.06%
Platinum -1.06%
Silver 5000oz -1.16%

Currencies

USDEUR:-0.68% USDJPY:-0.34%

MINTs
USDIDR(IDN) +1.40%
USDMXN(MEX) -0.21%
USDNGN(NGA) +4.98%
USDTRY(TUR) -0.84%
BRICS
USDBRL(BRA) +2.18%
USDCNY(CHN) -0.07%
USDINR(IND) +0.80%
USDRUB(RUS) -5.79%
USDZAR(ZAF) +1.23%
Agricultural
Coffee (Arabica) -2.40%
Cotton +2.06%
Soybeans +2.03%
Cocoa +3.01%
Coffee (Robusta) +3.88%
Corn +1.17%
Feeder Cattle +2.03%
Lean Hogs -3.62%
Sugar #11 +2.13%
Cattle +2.50%
Lumber -0.61%
Orange Juice +2.07%
Soybean Meal +1.28%
Wheat +1.52%
White Sugar +0.03%

Credit Indices

Index Change
Markit CDX EM -0.17%
Markit CDX NA HY -0.08%
Markit CDX NA IG +0.71%
Markit iTraxx Asia ex-Japan IG +0.07%
Markit iTraxx Australia -0.53%
Markit iTraxx Europe +3.69%
Markit iTraxx Europe Crossover +10.76%
Markit iTraxx Japan -1.11%
Markit iTraxx SovX Western Europe +0.75%
Markit LCDX (Loan CDS) +0.00%
Markit MCDX (Municipal CDS) -2.19%
All in all, a good week for the equity markets.
The energy complex found a bid – remains to be seen if it was a dead cat bounce or something more significant.
Credit was mostly tighter – probably a reflection of the worsening finances of fracking cos.

Nifty Heatmap
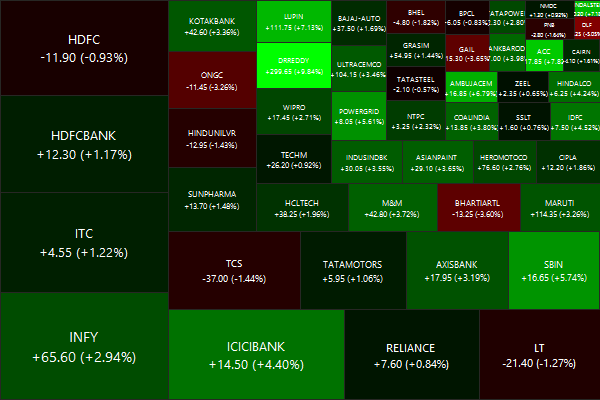
CNX NIFTY heatmap.2015-2-6.2015-2-13

Index Returns

index performance.2015-2-6.2015-2-13

Sector Performance

sector performance.2015-2-6.2015-2-13

Advance Decline

advance.decline.line2.2015-2-6.2015-2-13

Market Cap Decile Performance

Decile Mkt. Cap. Adv/Decl
1 (micro) -5.53% 57/76
2 -3.58% 60/72
3 -3.05% 61/71
4 -2.19% 55/77
5 -1.60% 58/74
6 -1.09% 69/64
7 -0.20% 65/67
8 +0.47% 67/66
9 +0.73% 64/68
10 (mega) +0.39% 66/67
The rally was primarily driven by large caps…

Top Winners and Losers

SRTRANSFIN +10.52%
ADANIPORTS +11.71%
BHARATFORG +12.33%
OIL -8.56%
INFRATEL -5.13%
DLF -5.05%
Shriram Transport is easily one of the most volatile stocks out there… And will DLF be able to survive a Kejriwal – Raje 1-2 punch?

ETF Performance

PSUBNKBEES +3.94%
BANKBEES +3.16%
JUNIORBEES +1.72%
NIFTYBEES +1.22%
INFRABEES -1.06%
CPSEETF -1.10%
GOLDBEES -1.99%
Hopefully, gold will put in a couple of years of negative returns and Indian savers will finally get over it…

Yield Curve
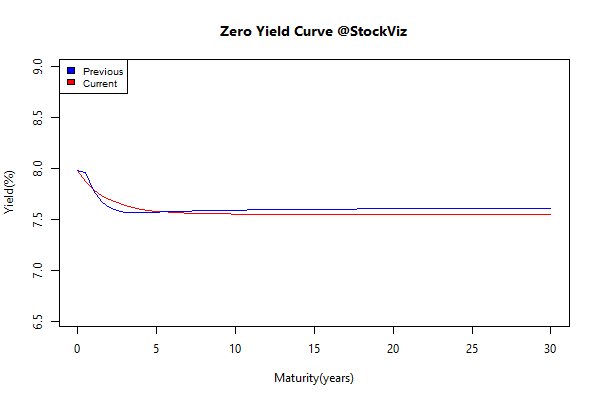
yield Curve.2015-2-6.2015-2-13

Bond Indices

Sub Index Change in YTM Total Return(%)
GSEC TB +0.13 +0.11%
GSEC SUB 1-3 +0.22 -0.05%
GSEC SUB 3-8 +0.12 -0.22%
GSEC SUB 8 +0.05 -0.30%
Too much supply? Budget jitters? Plain-old reversion to mean?

Investment Theme Performance

Equity Mutual Funds

Bond Mutual Funds

Thought for the weekend

Successful enterprises have a cycle of life. Startups build a product or service, enter the market and attract customers. Once they’re over these initial hurdles, they enter a growth phase, rapidly increasing their revenue and market share with big gains year-over-year. They continue to work on their product, fine-tuning it as revenue starts to flatten and margins stabilize at lower but still attractive levels.

As these companies mature, growth slows even more, eventually flattening out — yet operational expenses continue to climb as they strive to compete with new players in the market. Finally, unable to keep up, burdened with bloated budgets, companies spiral into negative growth, marked by layoffs, high burn rates and eventual bankruptcy or liquidation.

Source: The Arc of Company Life